Analytics
Kinsta charges for Application Hosting based on bandwidth, build time, and application hosting pod usage. With Application Analytics, you can get insights into your application’s usage data. You can view analytics for each application in application-level analytics or for all of your applications in company-level analytics. For more information about how we calculate your invoice, refer to Application Pricing.
When viewing analytics, you can choose to see data for the past 24 hours, 7 days, 30 days, or the current billing cycle (Current month in the dropdown menu).
If you highlight a specific point in time on a graph, it will show you some comparison data, such as the percentage difference between each day.
Application Level Analytics
Application-level analytics shows you the following data for your application:
- Data usage
- Build time
- Runtime
- CPU usage for processes
- Memory usage for processes
- HTTP Requests
To access these in-depth reports, go to your application’s Analytics page (Applications > appname > Analytics).
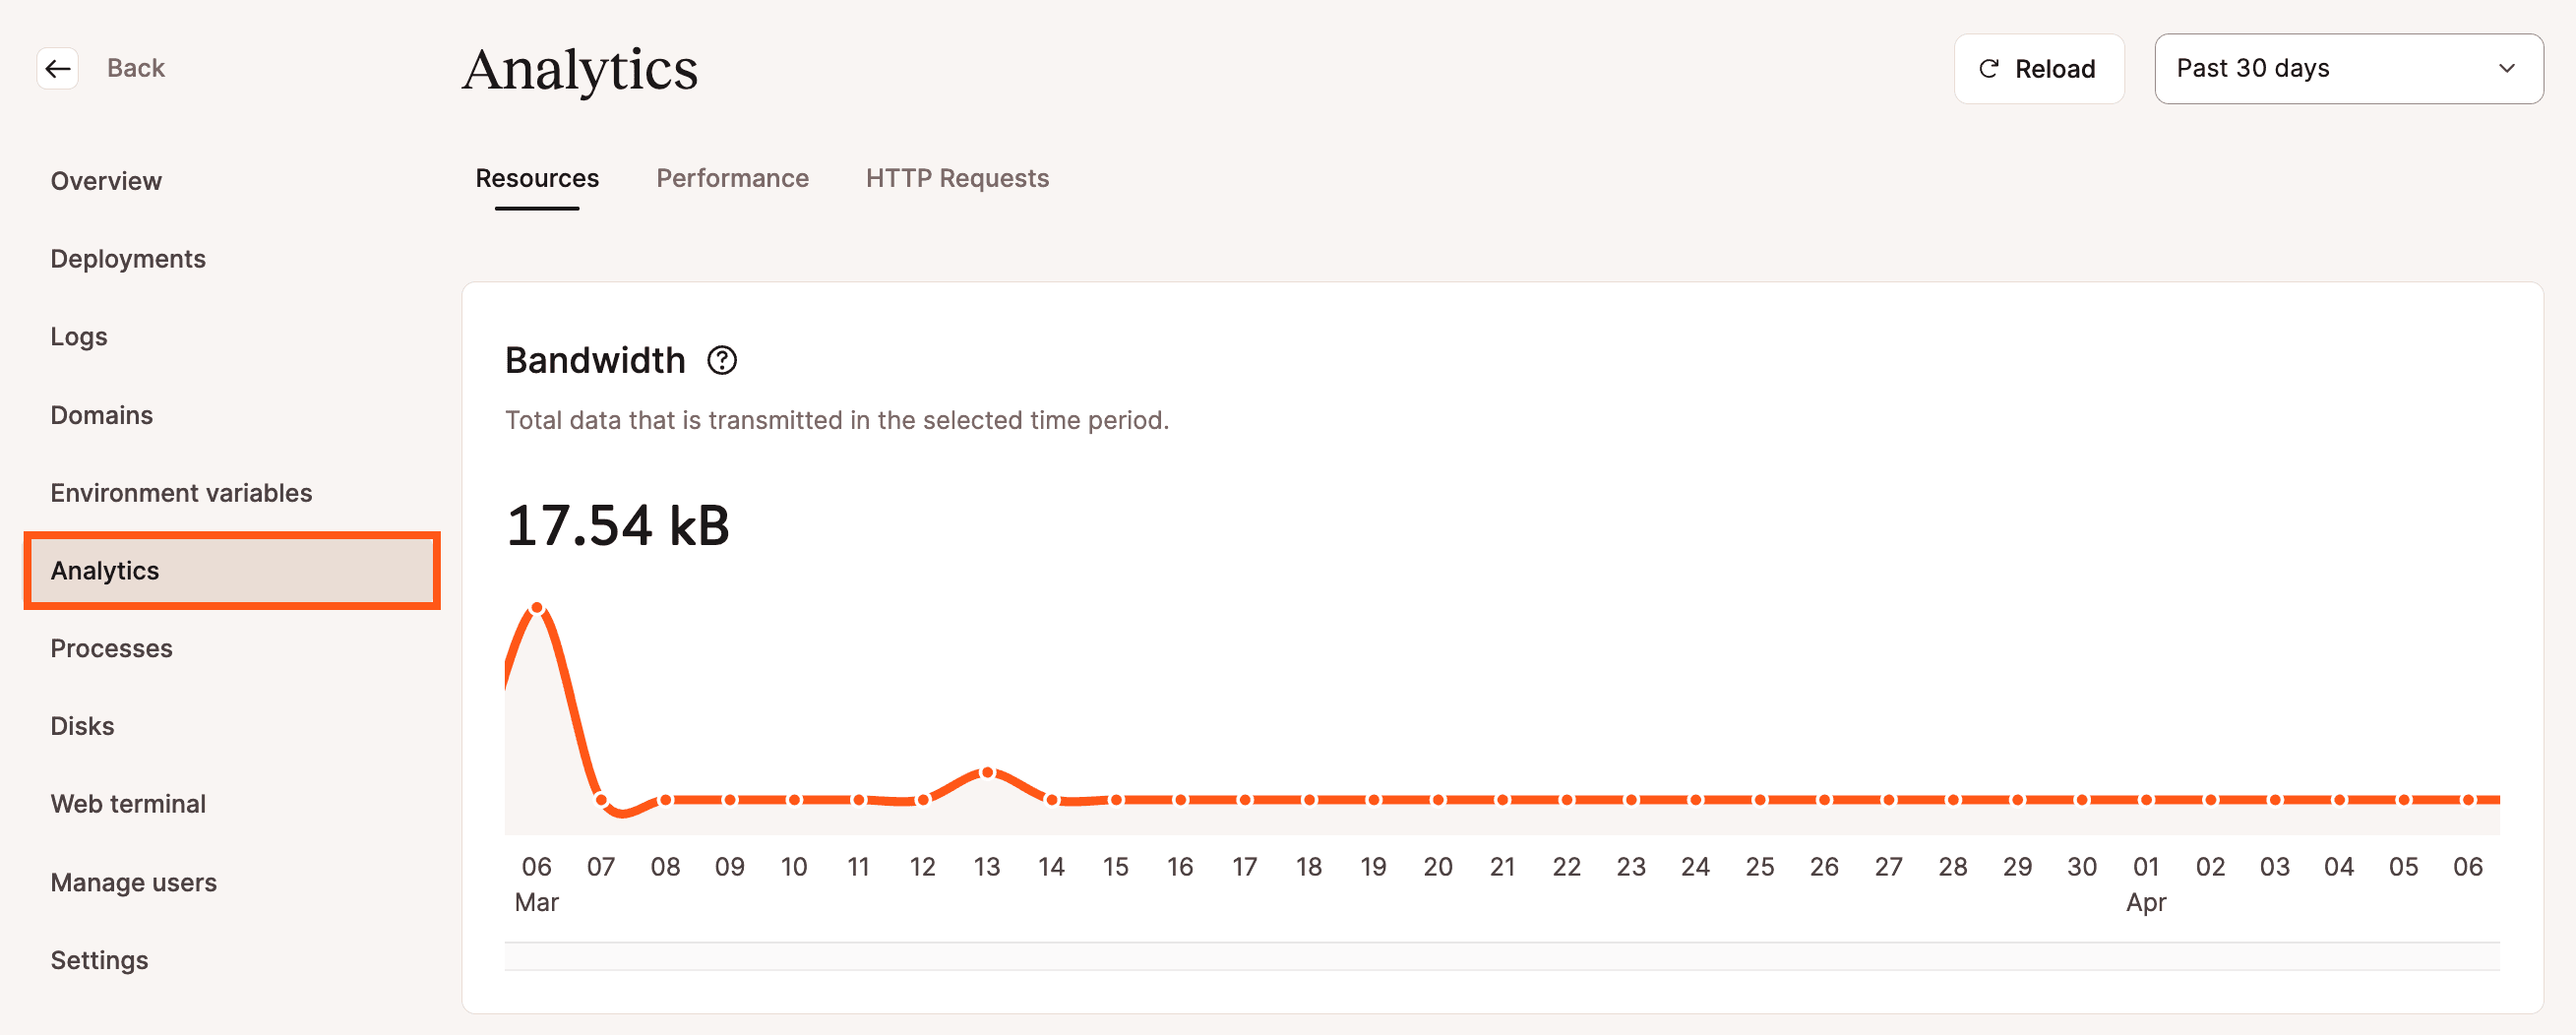
Select each tab under Analytics to see the associated data.
Resources
Under the Resources section, you can view data about your application’s bandwidth, build time, and runtime.
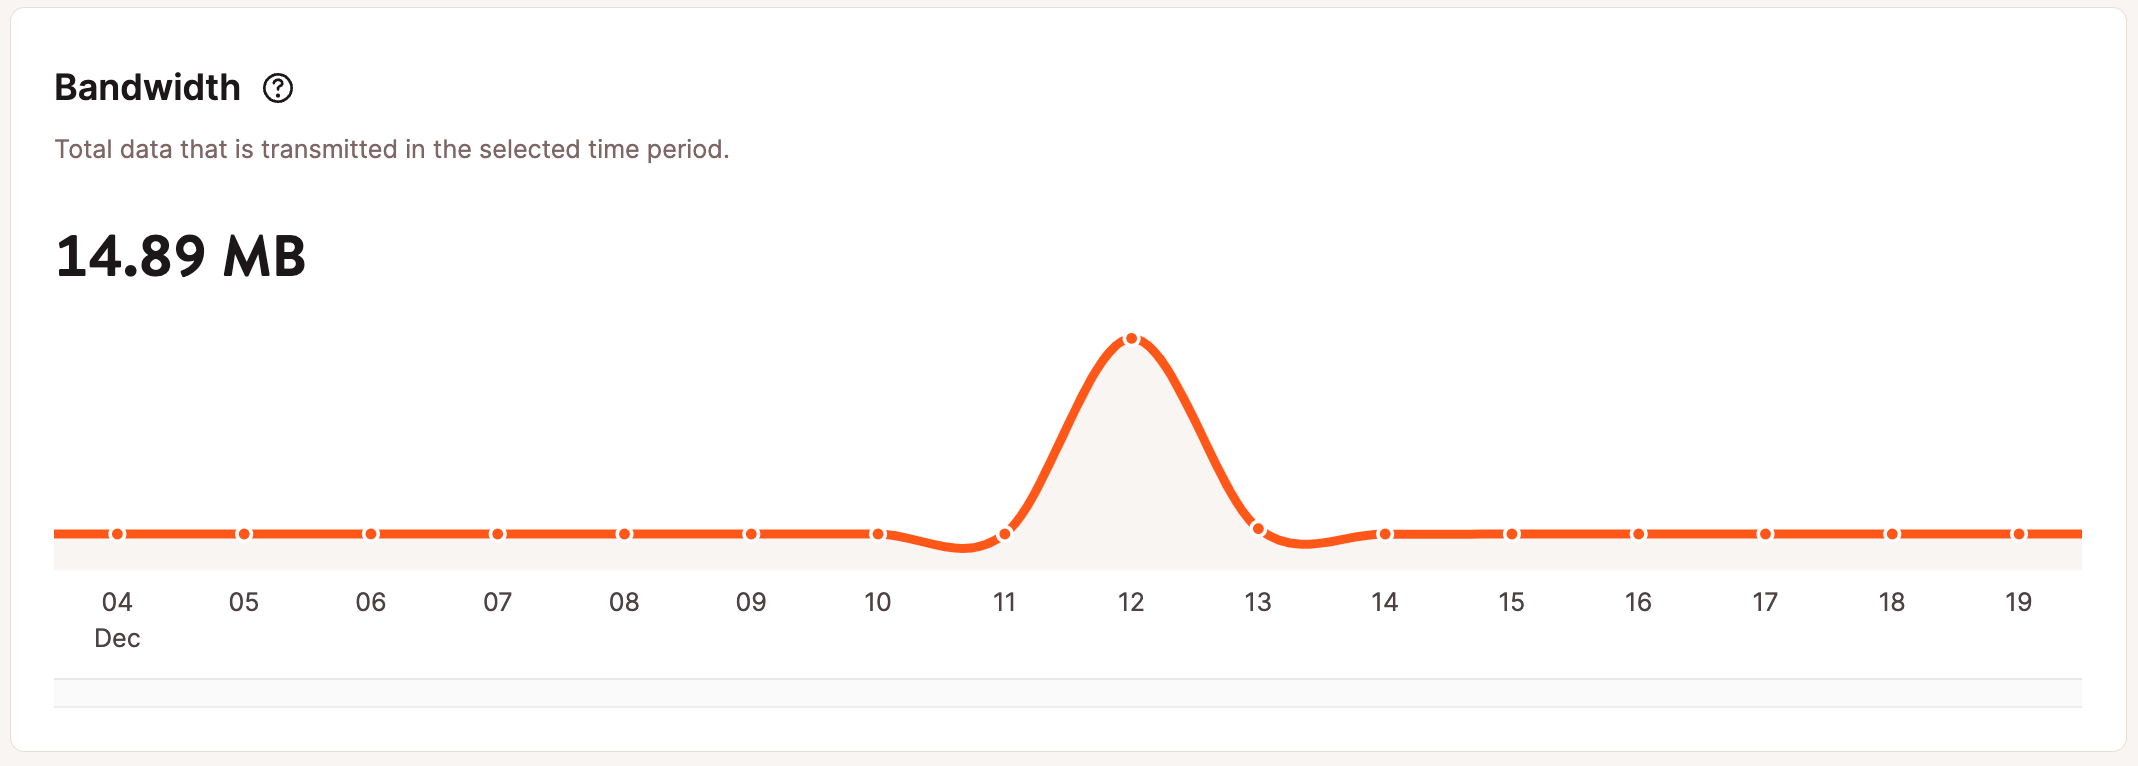
Bandwidth
The bandwidth chart shows the total egress data your application has transmitted. Note: We only charge for egress (traffic from the application to the user); we do not charge for ingress (traffic coming into your application).
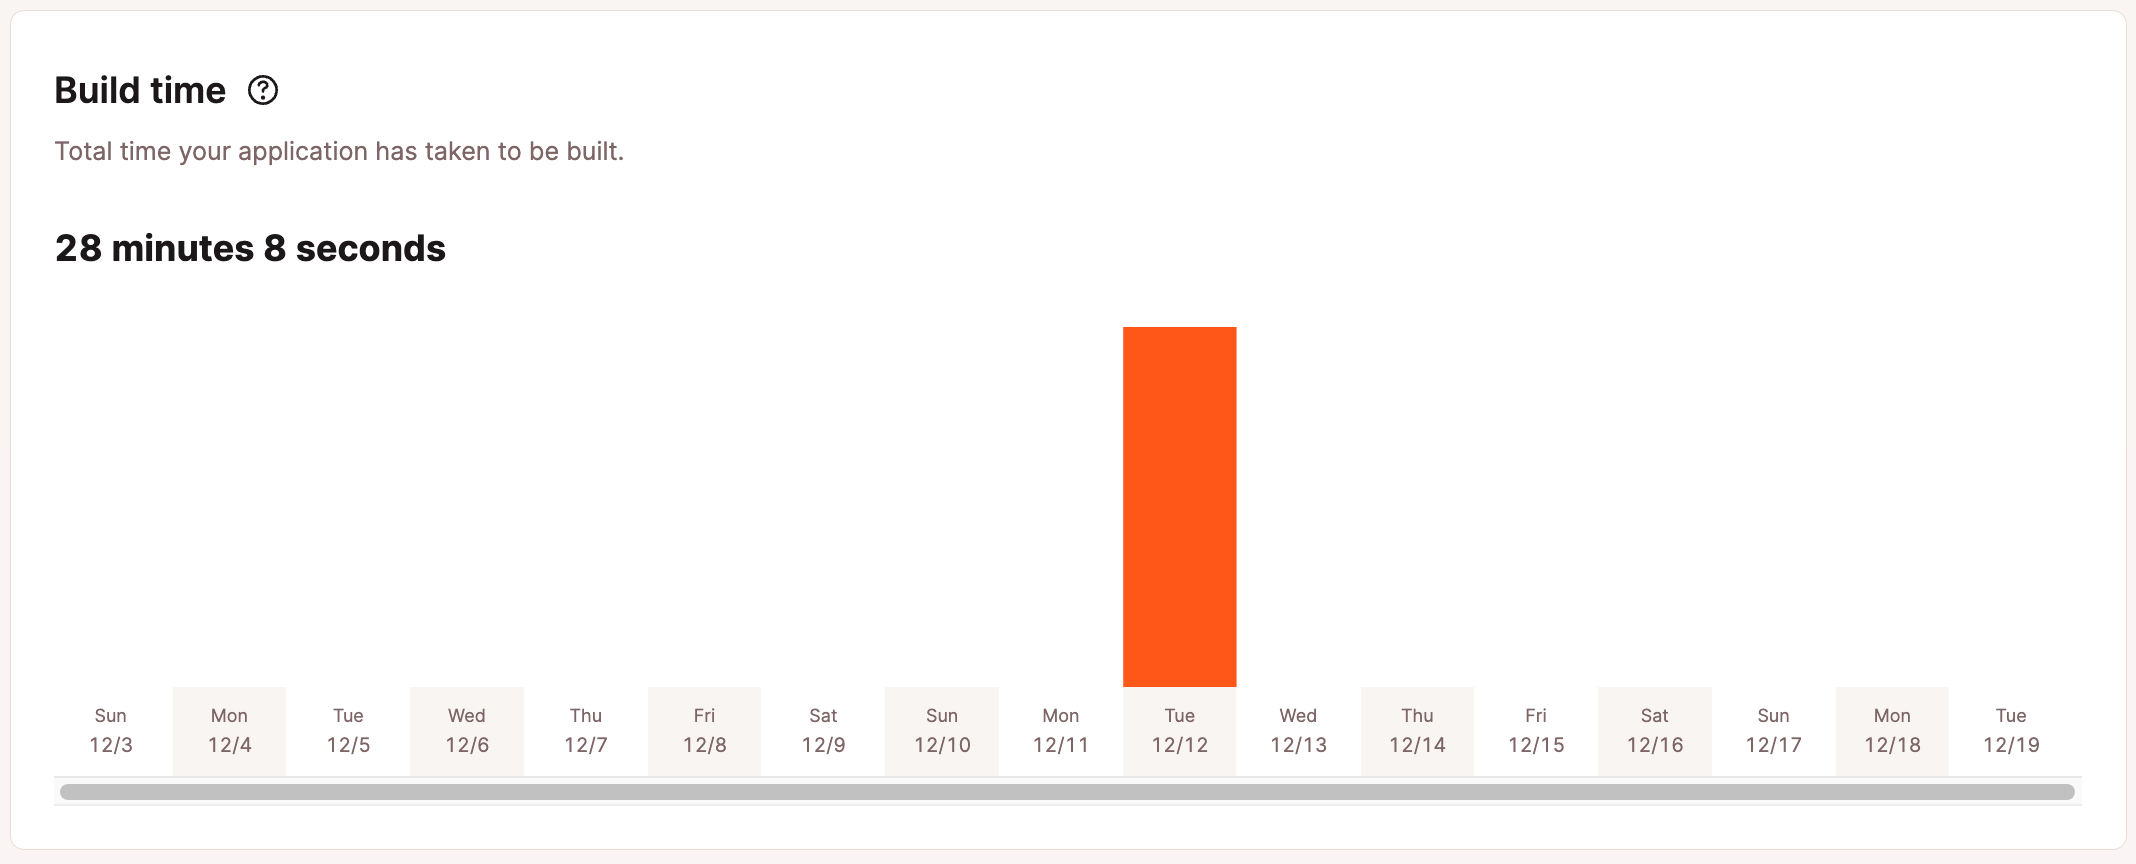
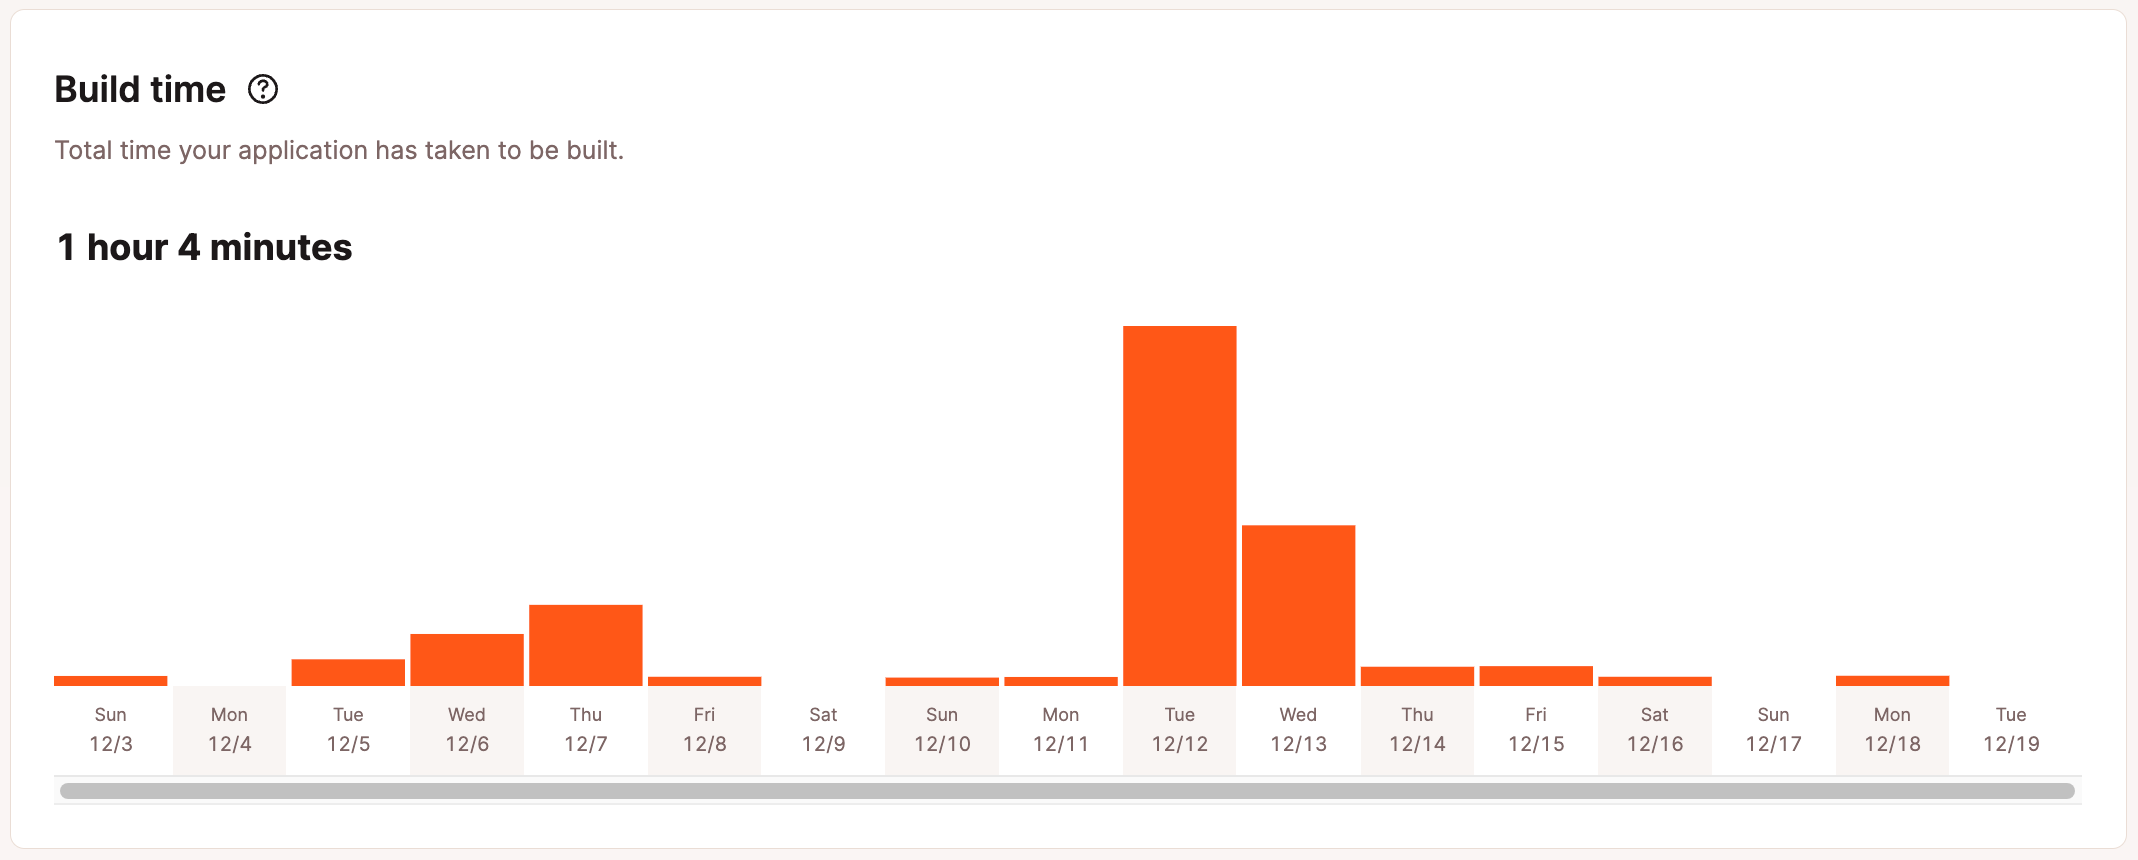
Build time
The build time chart shows you the total time spent building the application.
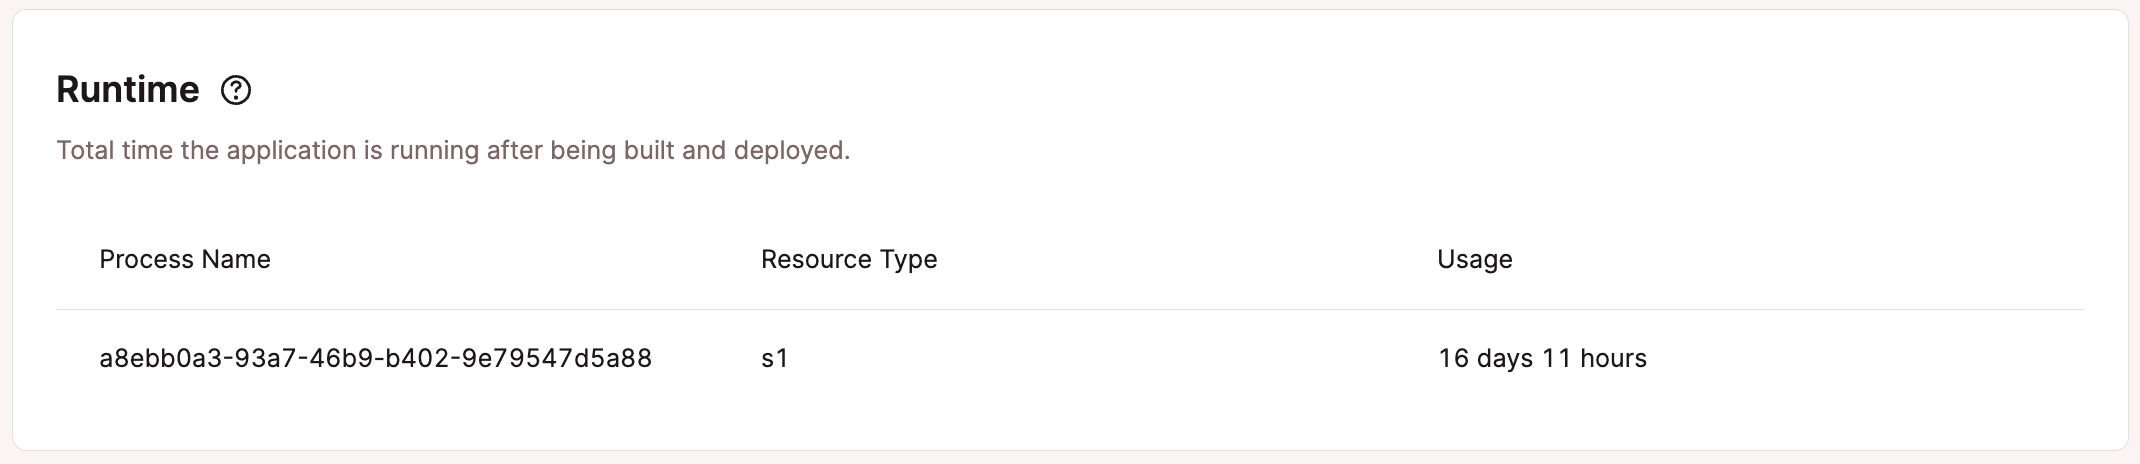
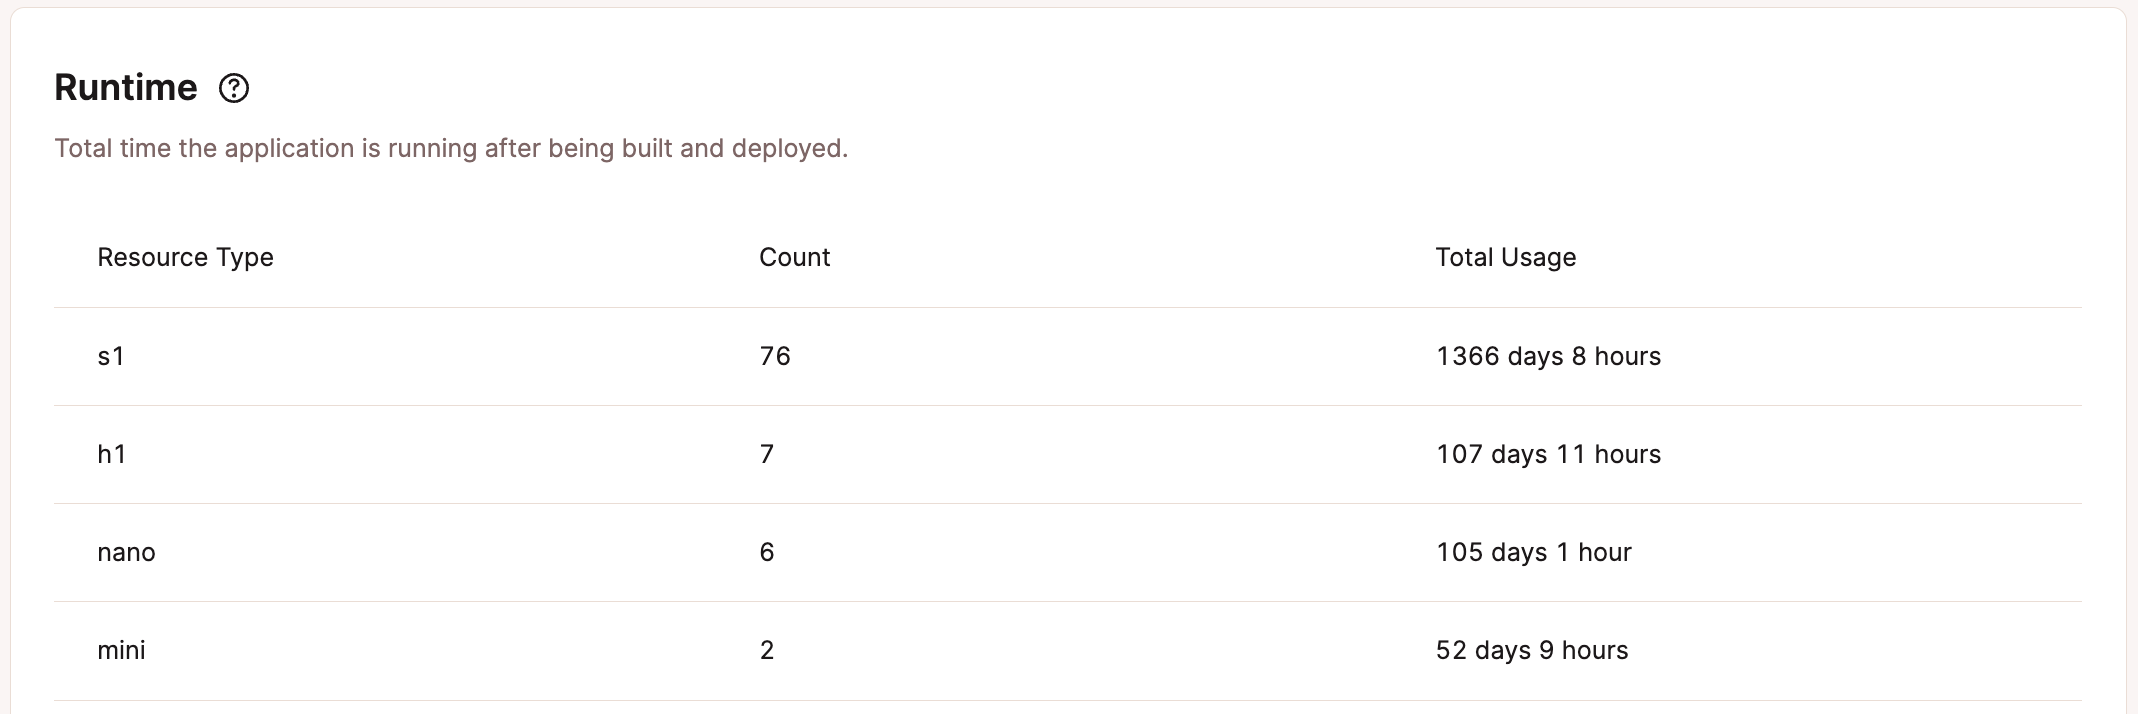
Runtime
In the runtime report, you can see the total time the application has been running after being built and deployed, with each process and its associated pod size in a separate row.
Performance
Under the Performance section, you can view charts for CPU usage and memory usage for each of your application’s processes. You can use the drop-down to view the performance for each process type.
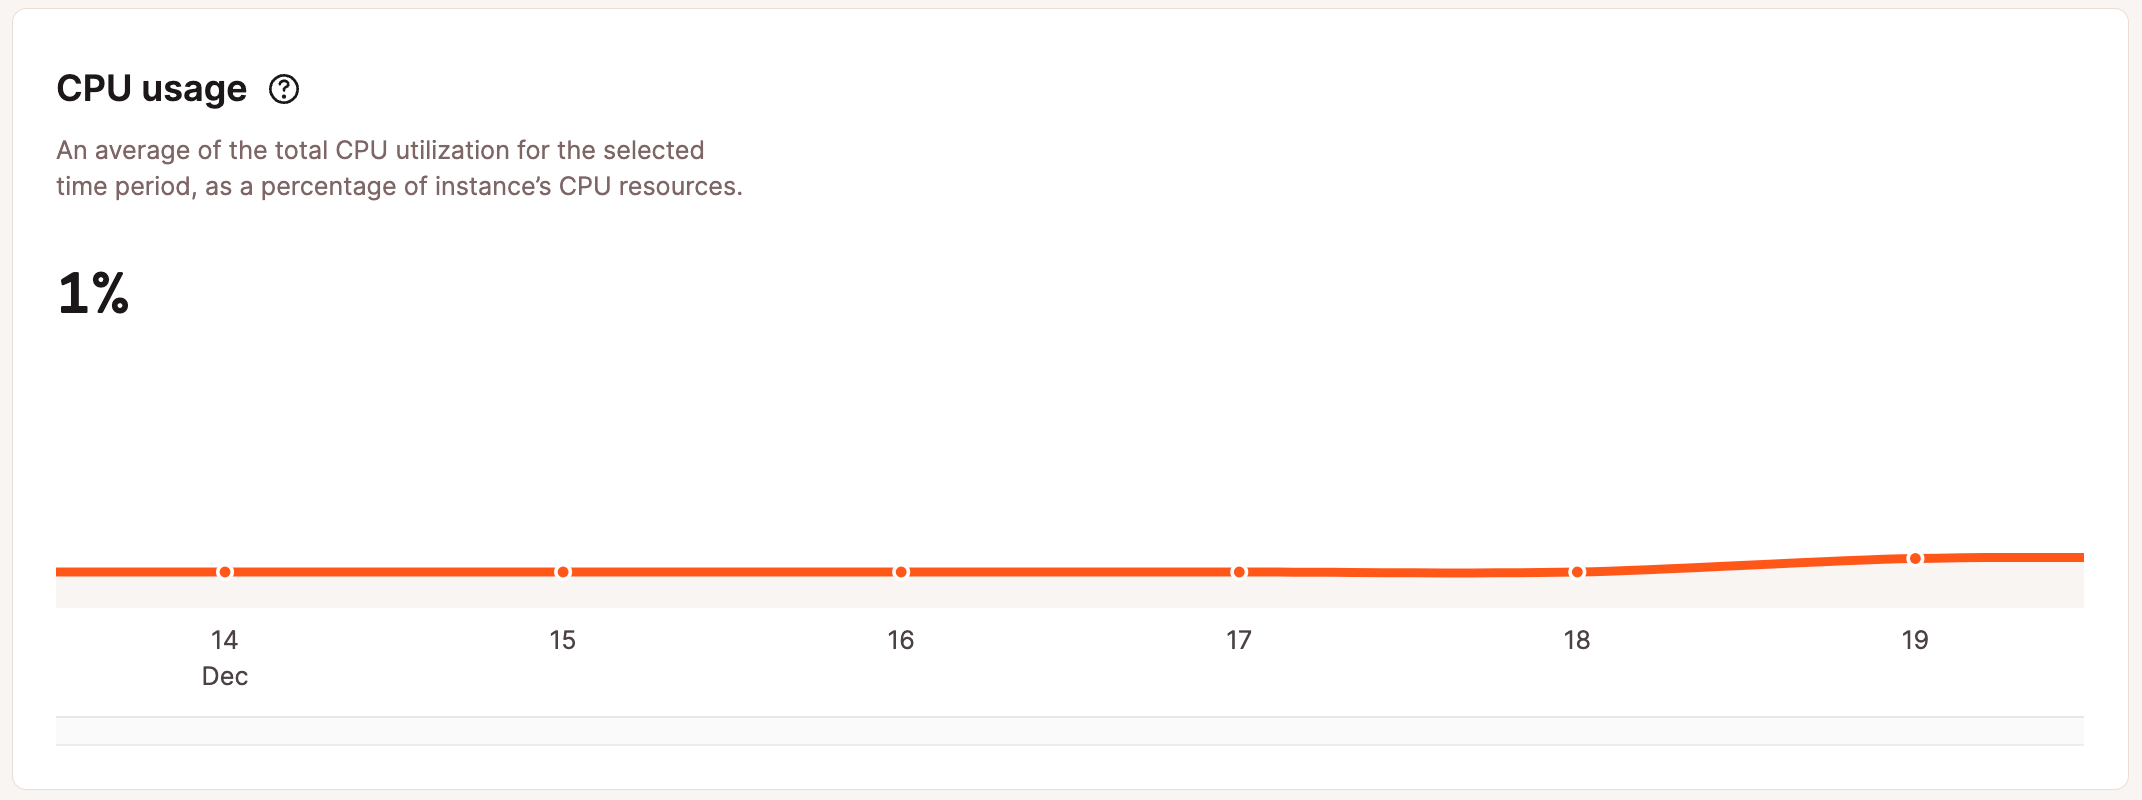
CPU usage
In the CPU usage chart, you can see the average of the total CPU utilization for the selected time period, expressed as a percentage of the instance’s CPU resources. If you see a high percentage of CPU usage (near 100%), we recommend upgrading to an application hosting pod with more CPU for that process. If your application is stateless (no persistent storage), you also have the option to enable automatic horizontal scaling for the web process. This lets you set a minimum and maximum number of instances (up to 10) that the process can scale between as needed.
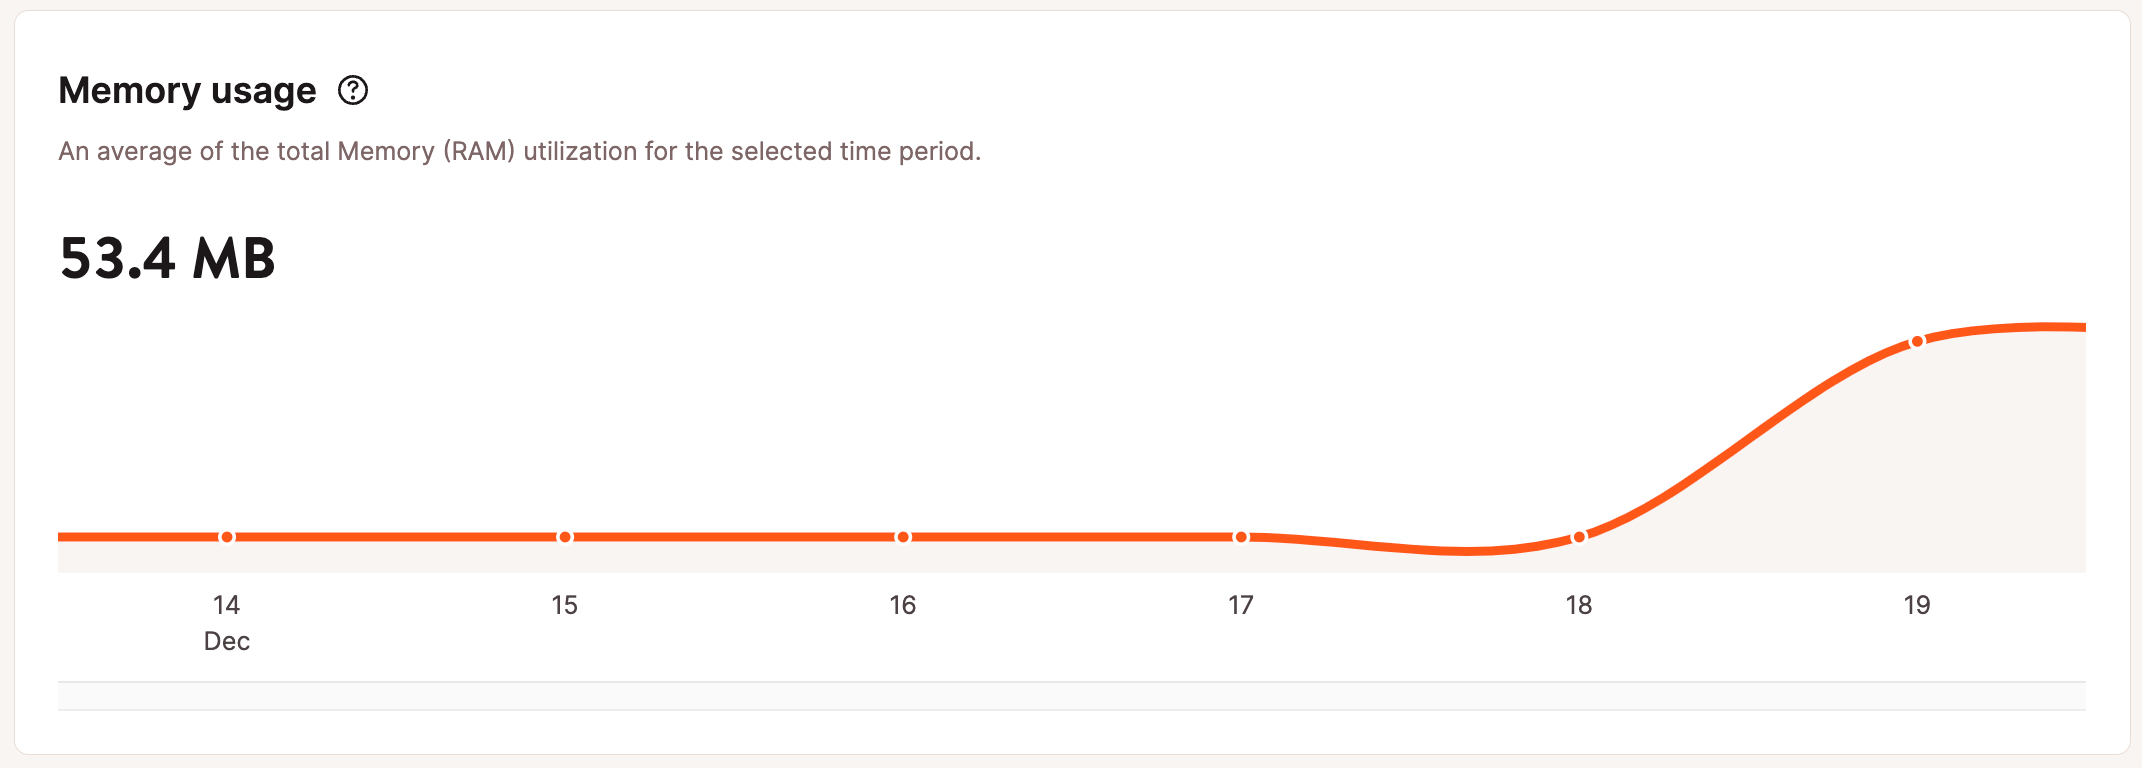
Memory usage
The memory usage chart shows the average of the total memory (RAM) used for the selected time period. If a process uses most or all of the memory available, we recommend upgrading to an application hosting pod with more available memory.
HTTP Requests
Under the HTTP Requests section, you can view data for HTTP requests, HTTP P95 latency, HTTP P50 latency, and slowest requests.
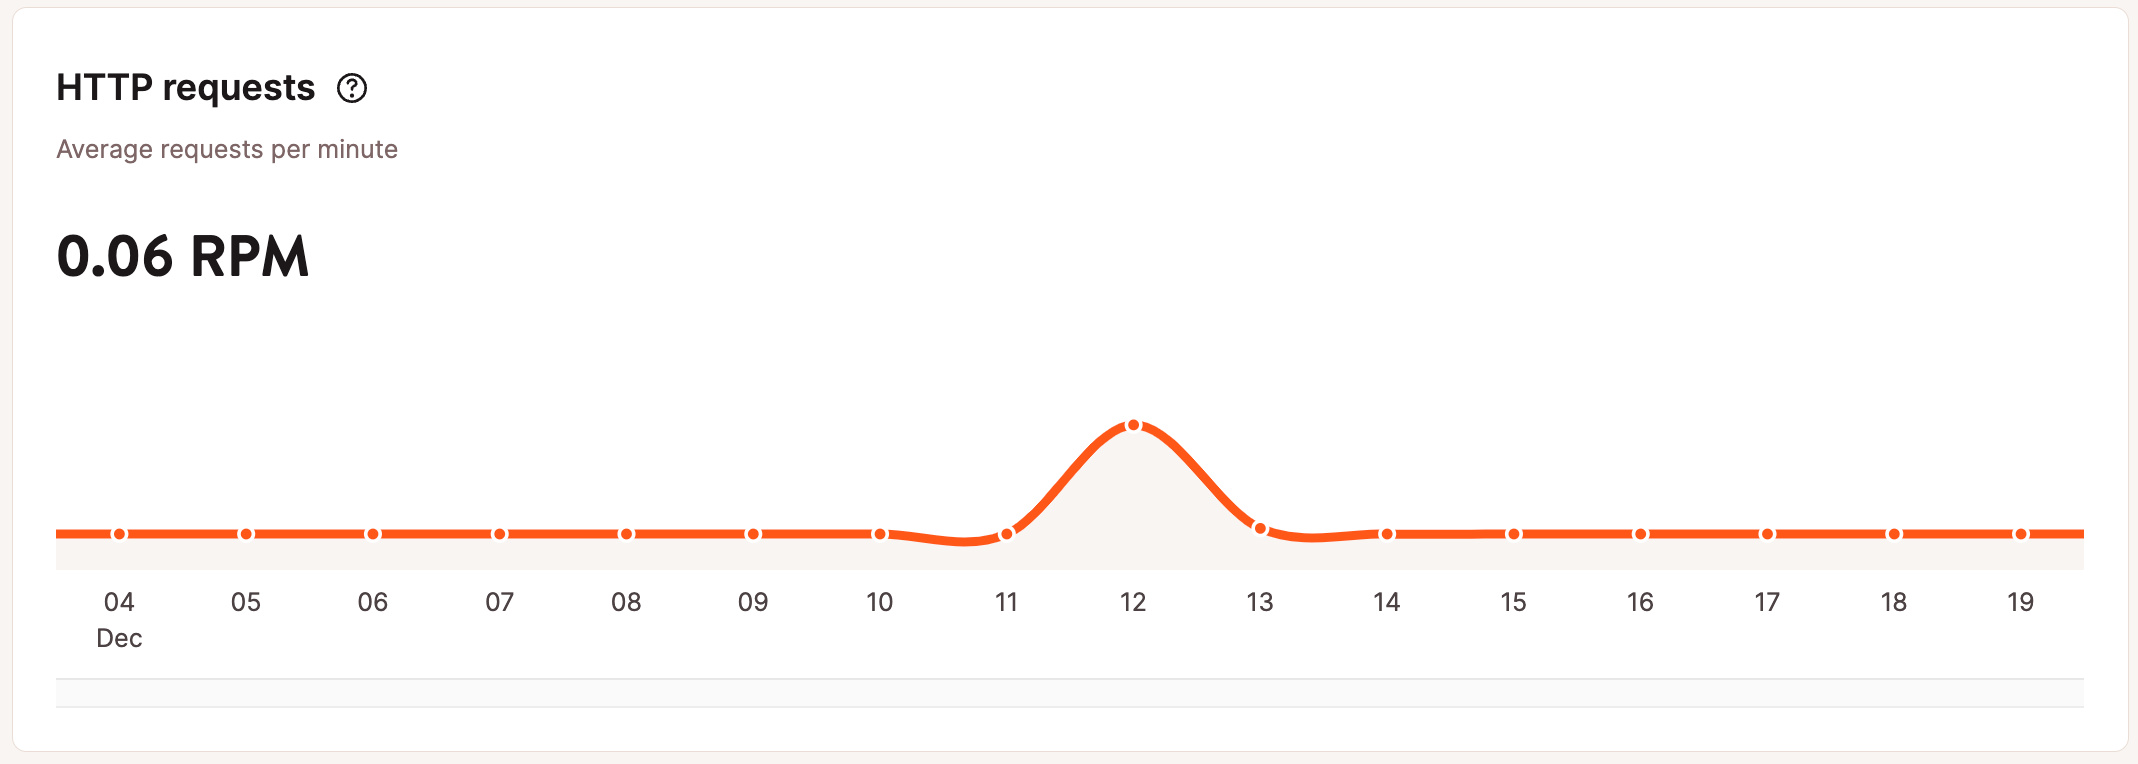
HTTP requests
The HTTP Requests chart shows the average requests per minute (RPM) of all HTTP requests for the time period selected.
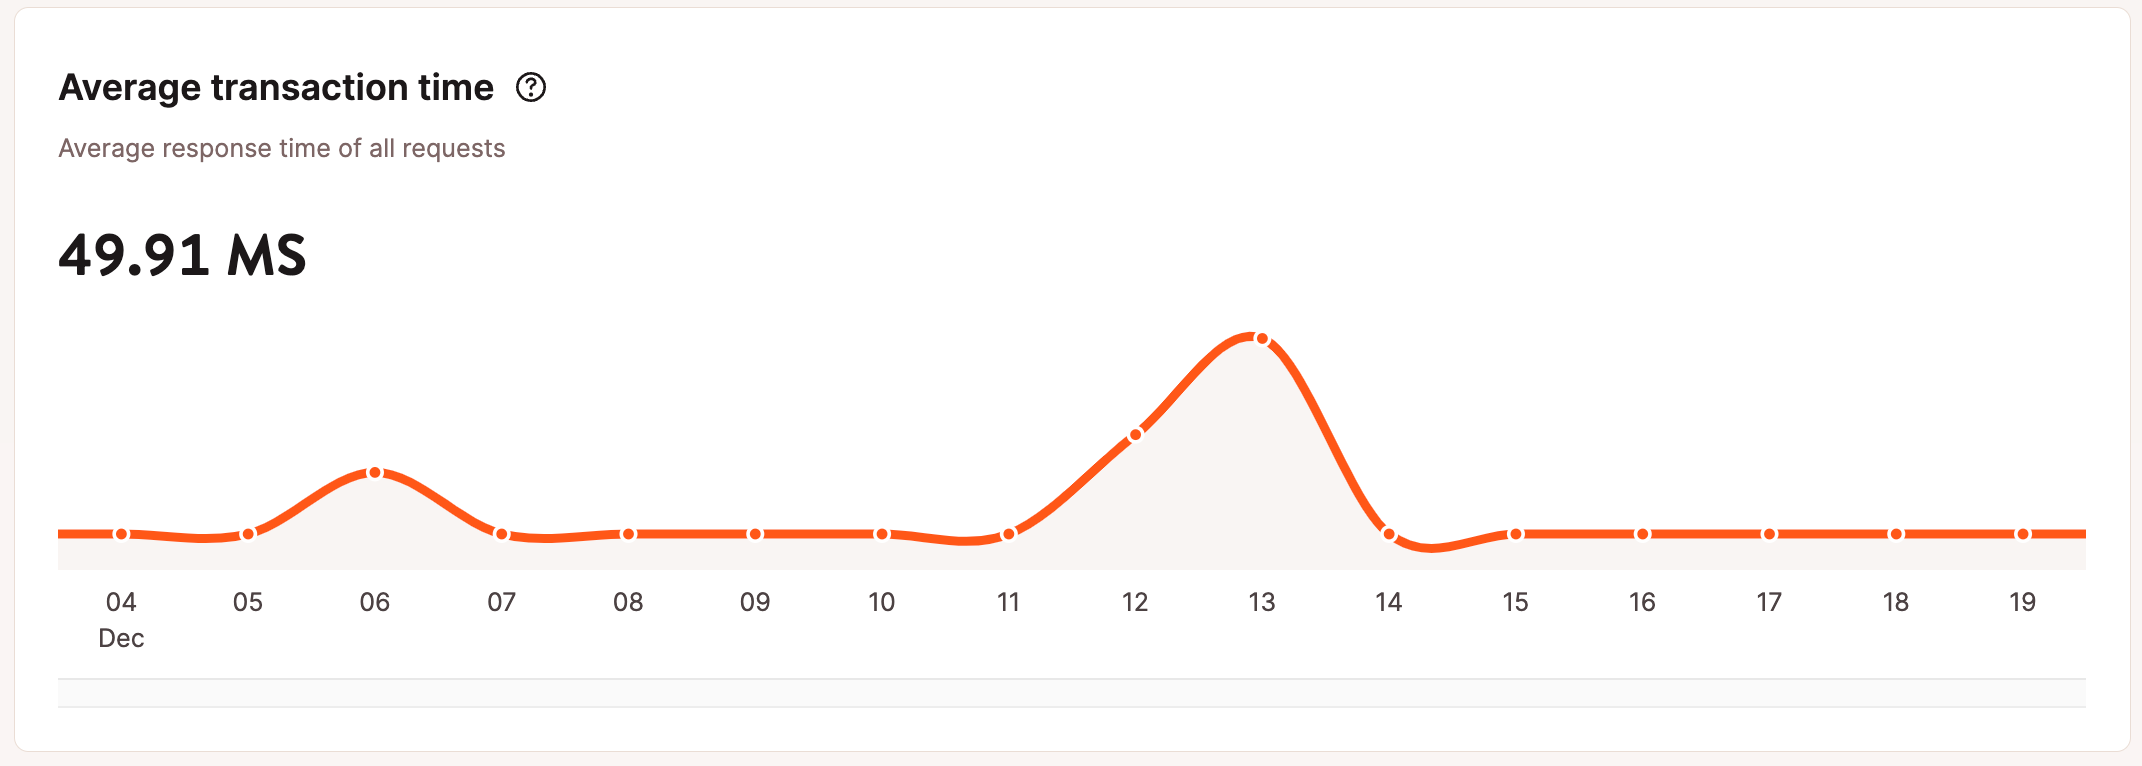
Average transaction time
The average transaction time chart shows the average response time for all HTTP requests for the time period selected.
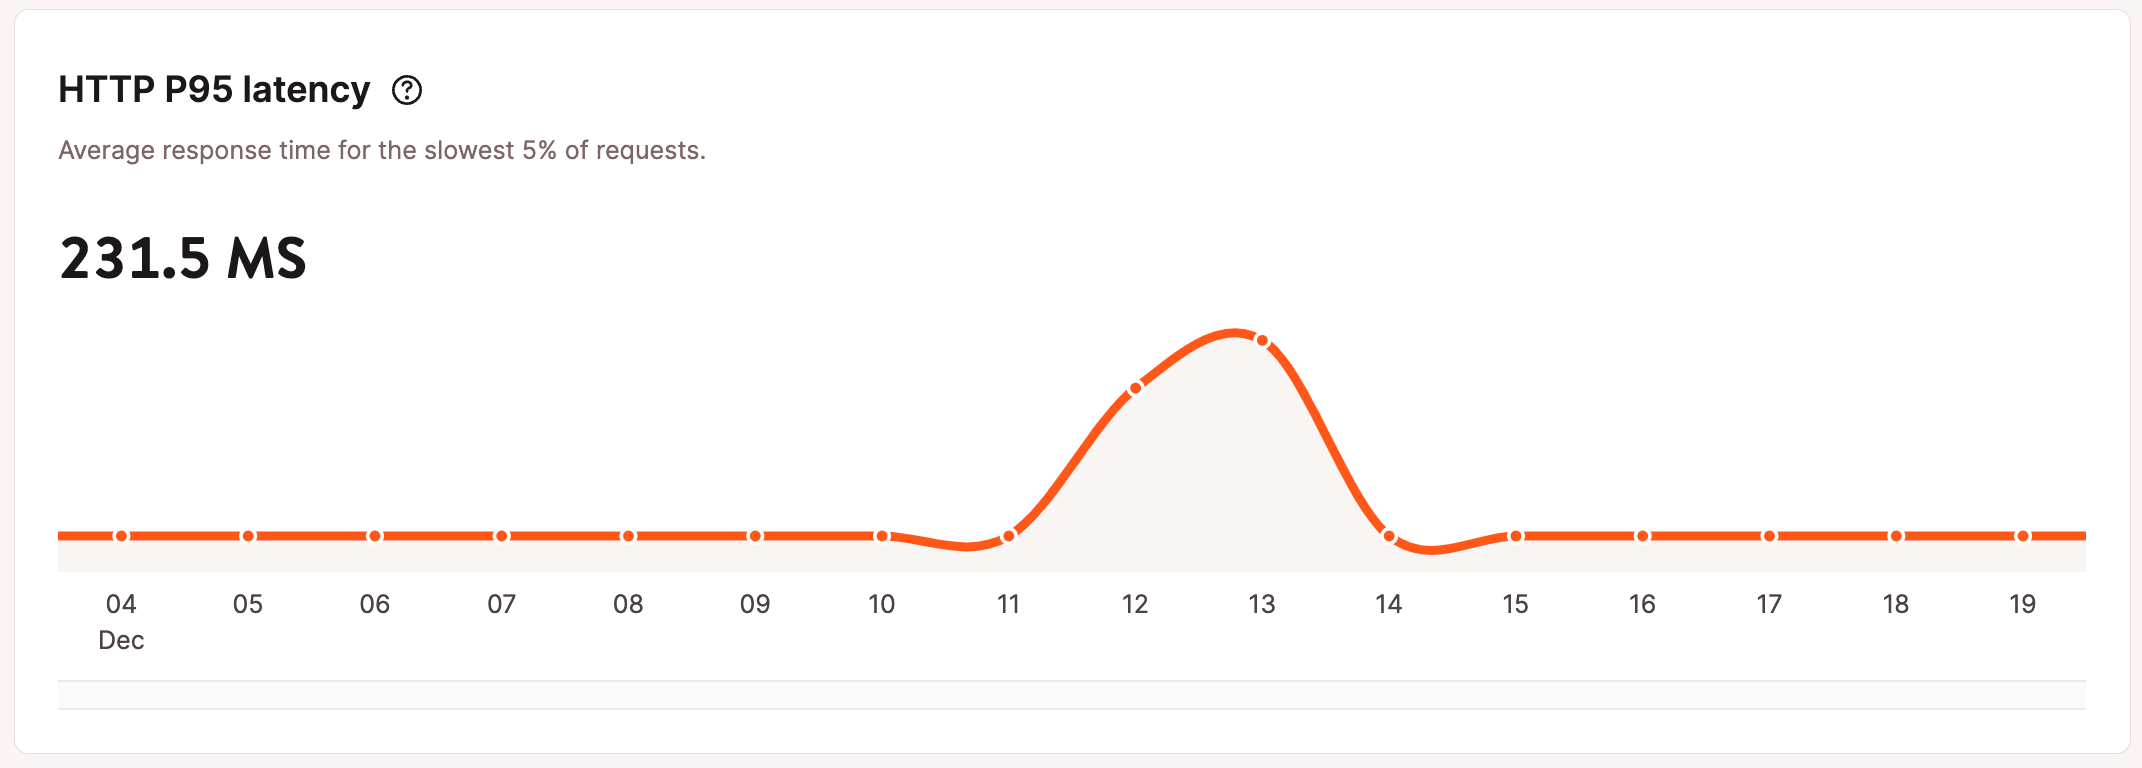
HTTP P95 latency
HTTP P95 latency is the value at which 5% of the requests exceed the duration of (are slower than) the P95 latency threshold of all requests for the duration selected.
For example, if the 95th percentile threshold (response time) is 907.8 ms and there were 100 requests during the time period selected, 95 out of 100 requests are 907.8 ms or faster, and 5 out of 100 requests are slower than 907.8 ms.
The HTTP P95 latency chart shows the average P95 threshold for the duration selected. Each point on the chart shows the P95 threshold for that specific hour or day, depending on the duration selected.
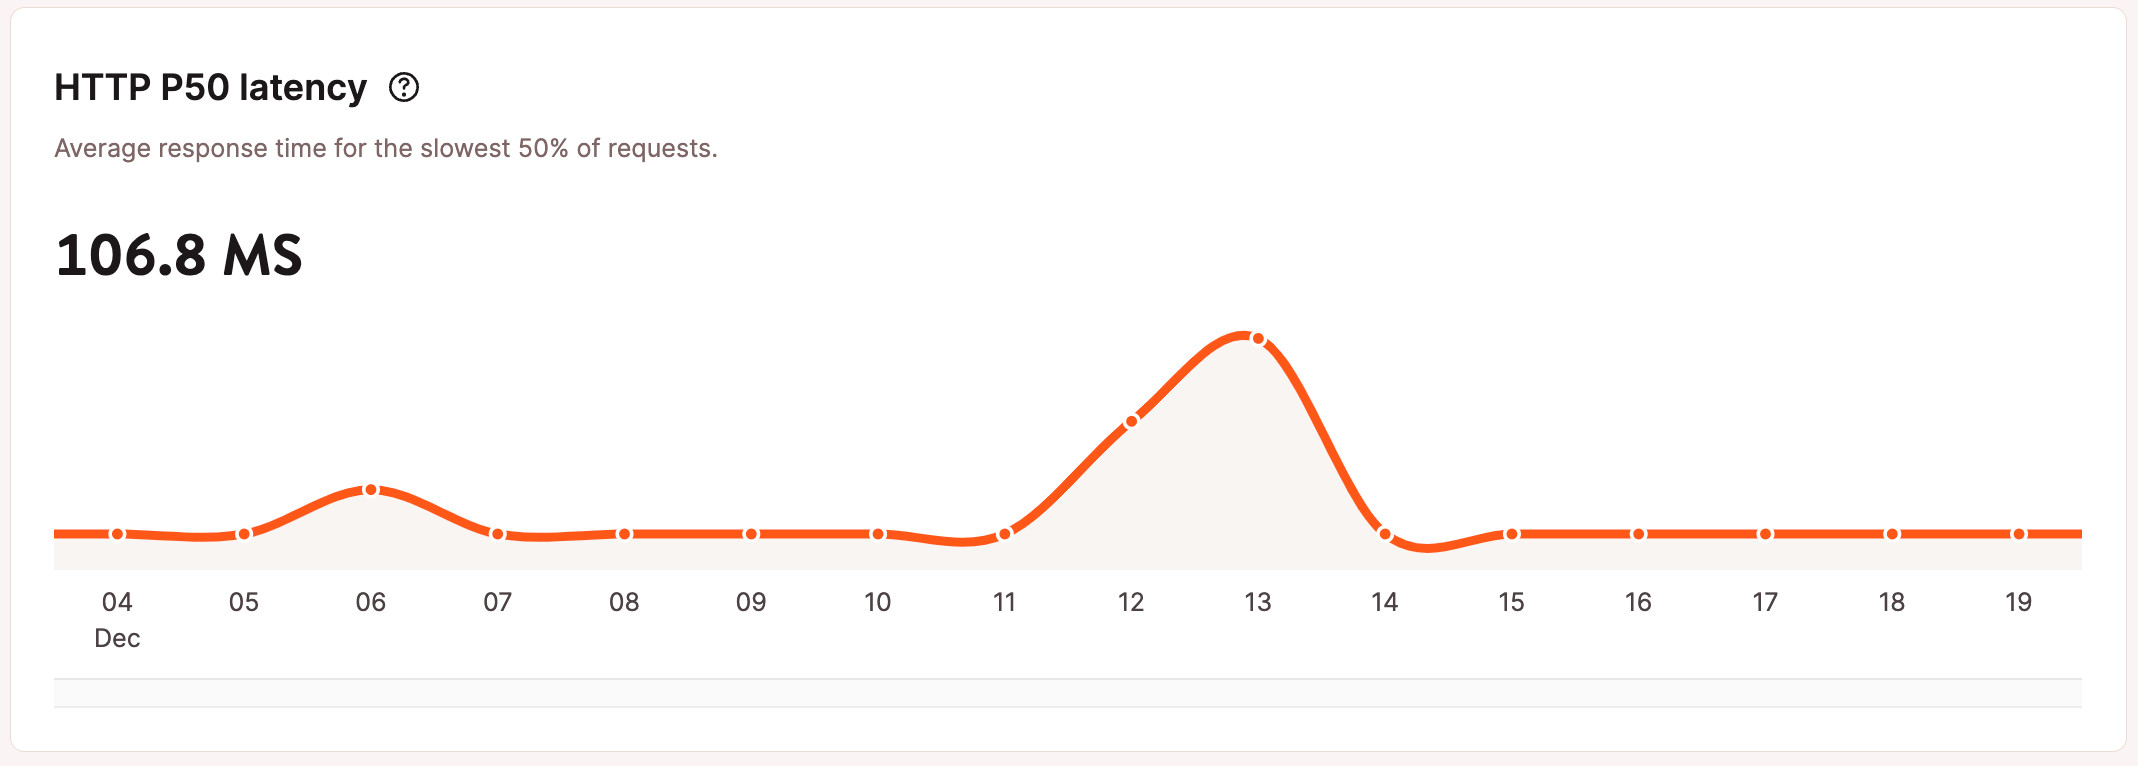
HTTP P50 latency
HTTP P50 latency is the value at which 50% of the requests are slower, and 50% are faster than the P50 latency threshold of all requests for the duration selected.
For example, if the 50th percentile threshold (response time) is 802.2 ms, half of the requests are 802.2 ms or faster, and the other half are slower than 802.2 ms.
The HTTP P50 latency chart shows the average P50 threshold for the duration selected. Each point on the chart shows the P50 threshold for that specific hour or day, depending on the duration selected.
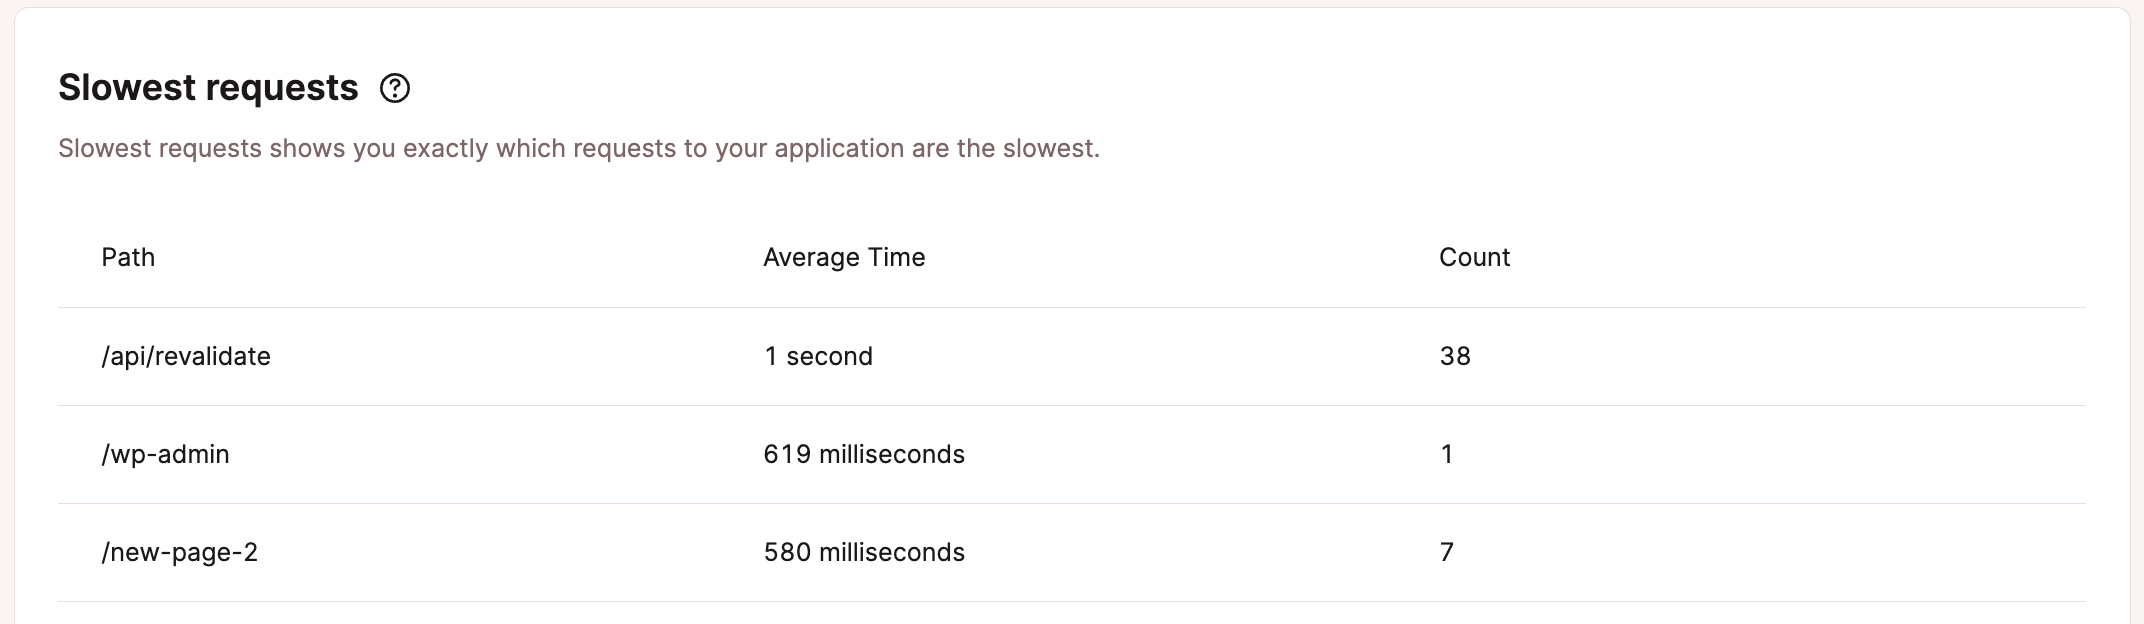
Slowest requests
The slowest requests table shows the 10 slowest requests to your application for the selected time period. The Time is the average response time the request took to complete, and the Count is the number of requests sent to the specified resource shown in the Path.
Company Level Analytics
Company-level analytics shows you the following the following data for all of your company’s applications:
- Data usage
- Build time
- Runtime
- HTTP Requests
To access these reports, go to your company’s Analytics page (Your name > Company settings > Analytics). Note: If you also have Database Hosting or WordPress Hosting, you’ll need to select the Applications subpage to view your company-level analytics.
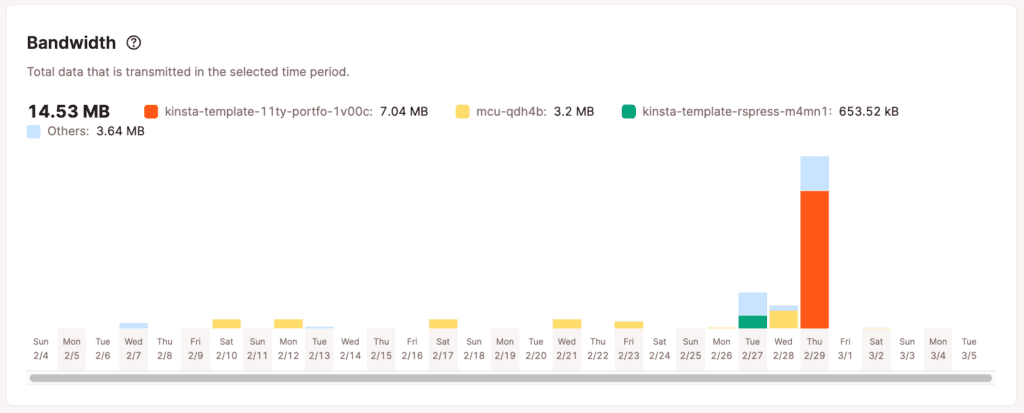
Bandwidth
The bandwidth chart shows the total egress data your applications have transmitted for the selected time period. Each color block represents an individual application or group of applications, so you can see which application uses the most or the least amount of bandwidth. If you have 4 or more applications, the applications that generated the lowest bandwidth are grouped as “Others.”
Build time
The build time chart shows you the total time spent building all of your applications for the selected time period.
Runtime
In the runtime report, you can see the total usage time of all your applications (after being built and deployed) for the selected time period. Each resource type and count is in a separate row.
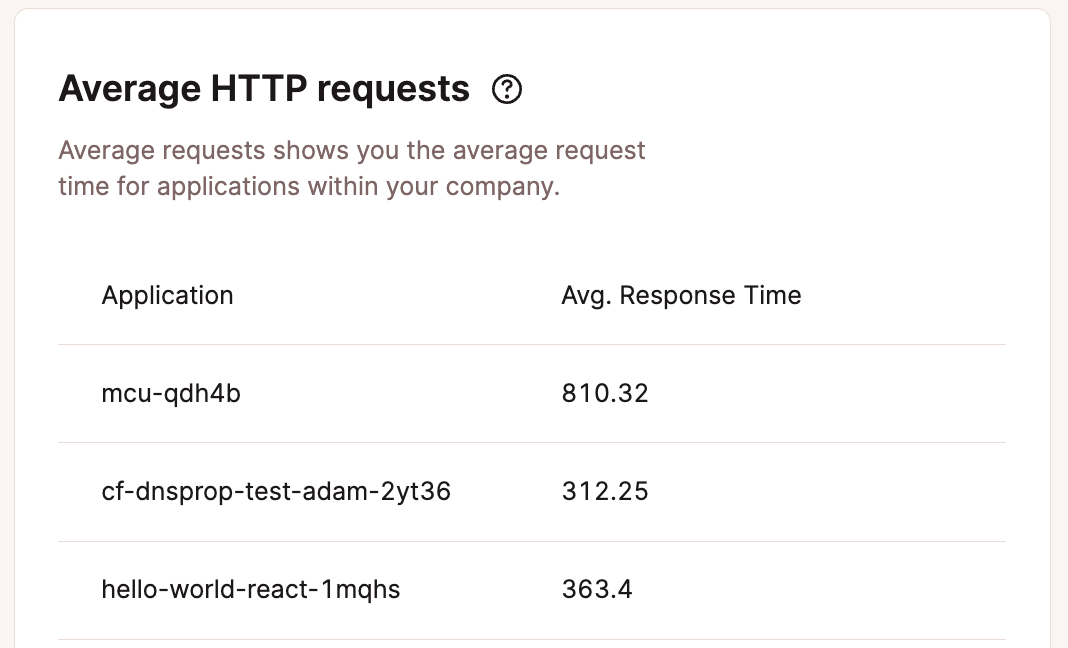
Average HTTP requests
The average HTTP requests table shows the average request time for all of your applications in the selected time period.
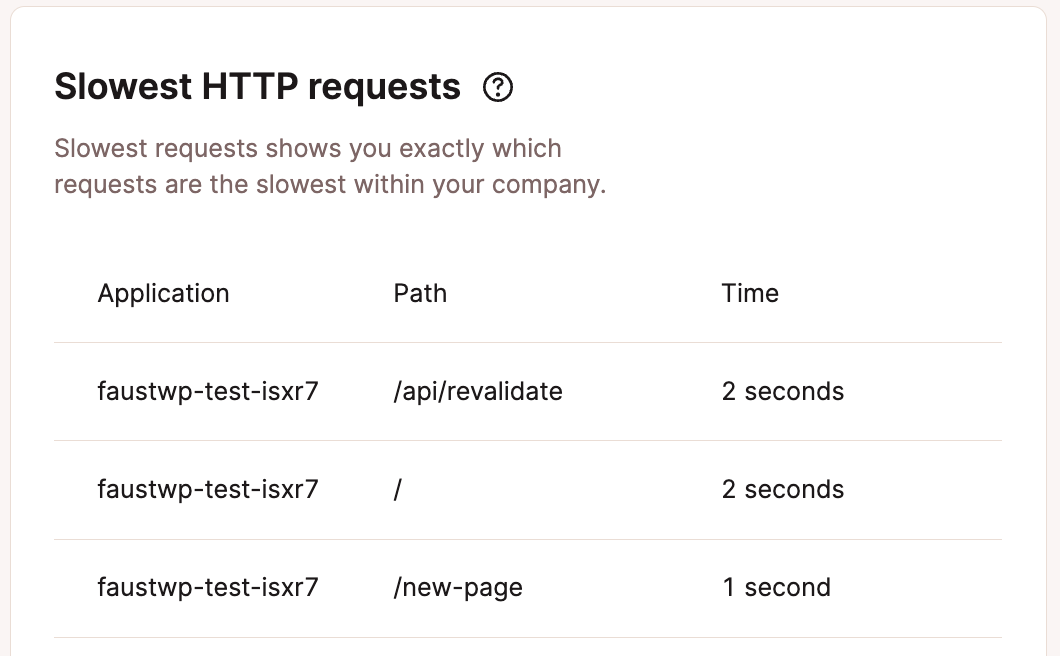
Slowest HTTP requests
The slowest HTTP requests table shows the 10 slowest requests for all of your applications in the selected time period.
Additional Notes
Analytics data is retained for 30 days. We suggest checking your Application Analytics frequently after first deploying to Kinsta and periodically after that. If you see any unexplained analytics data or inconsistency that concerns you, let our Support team know, and we can further investigate to help determine the cause.