Being data junkies ourselves, we want you to have access to as much data as possible. This makes it easier for you to troubleshoot performance and billing issues on your WordPress sites, without ever having to reach out to our support team.
Over the next couple weeks, we’ll be releasing some updates focused specifically around the Kinsta CDN. Today, we are excited to announce that you can now see your CDN usage in MyKinsta Analytics. 📊
CDN Usage
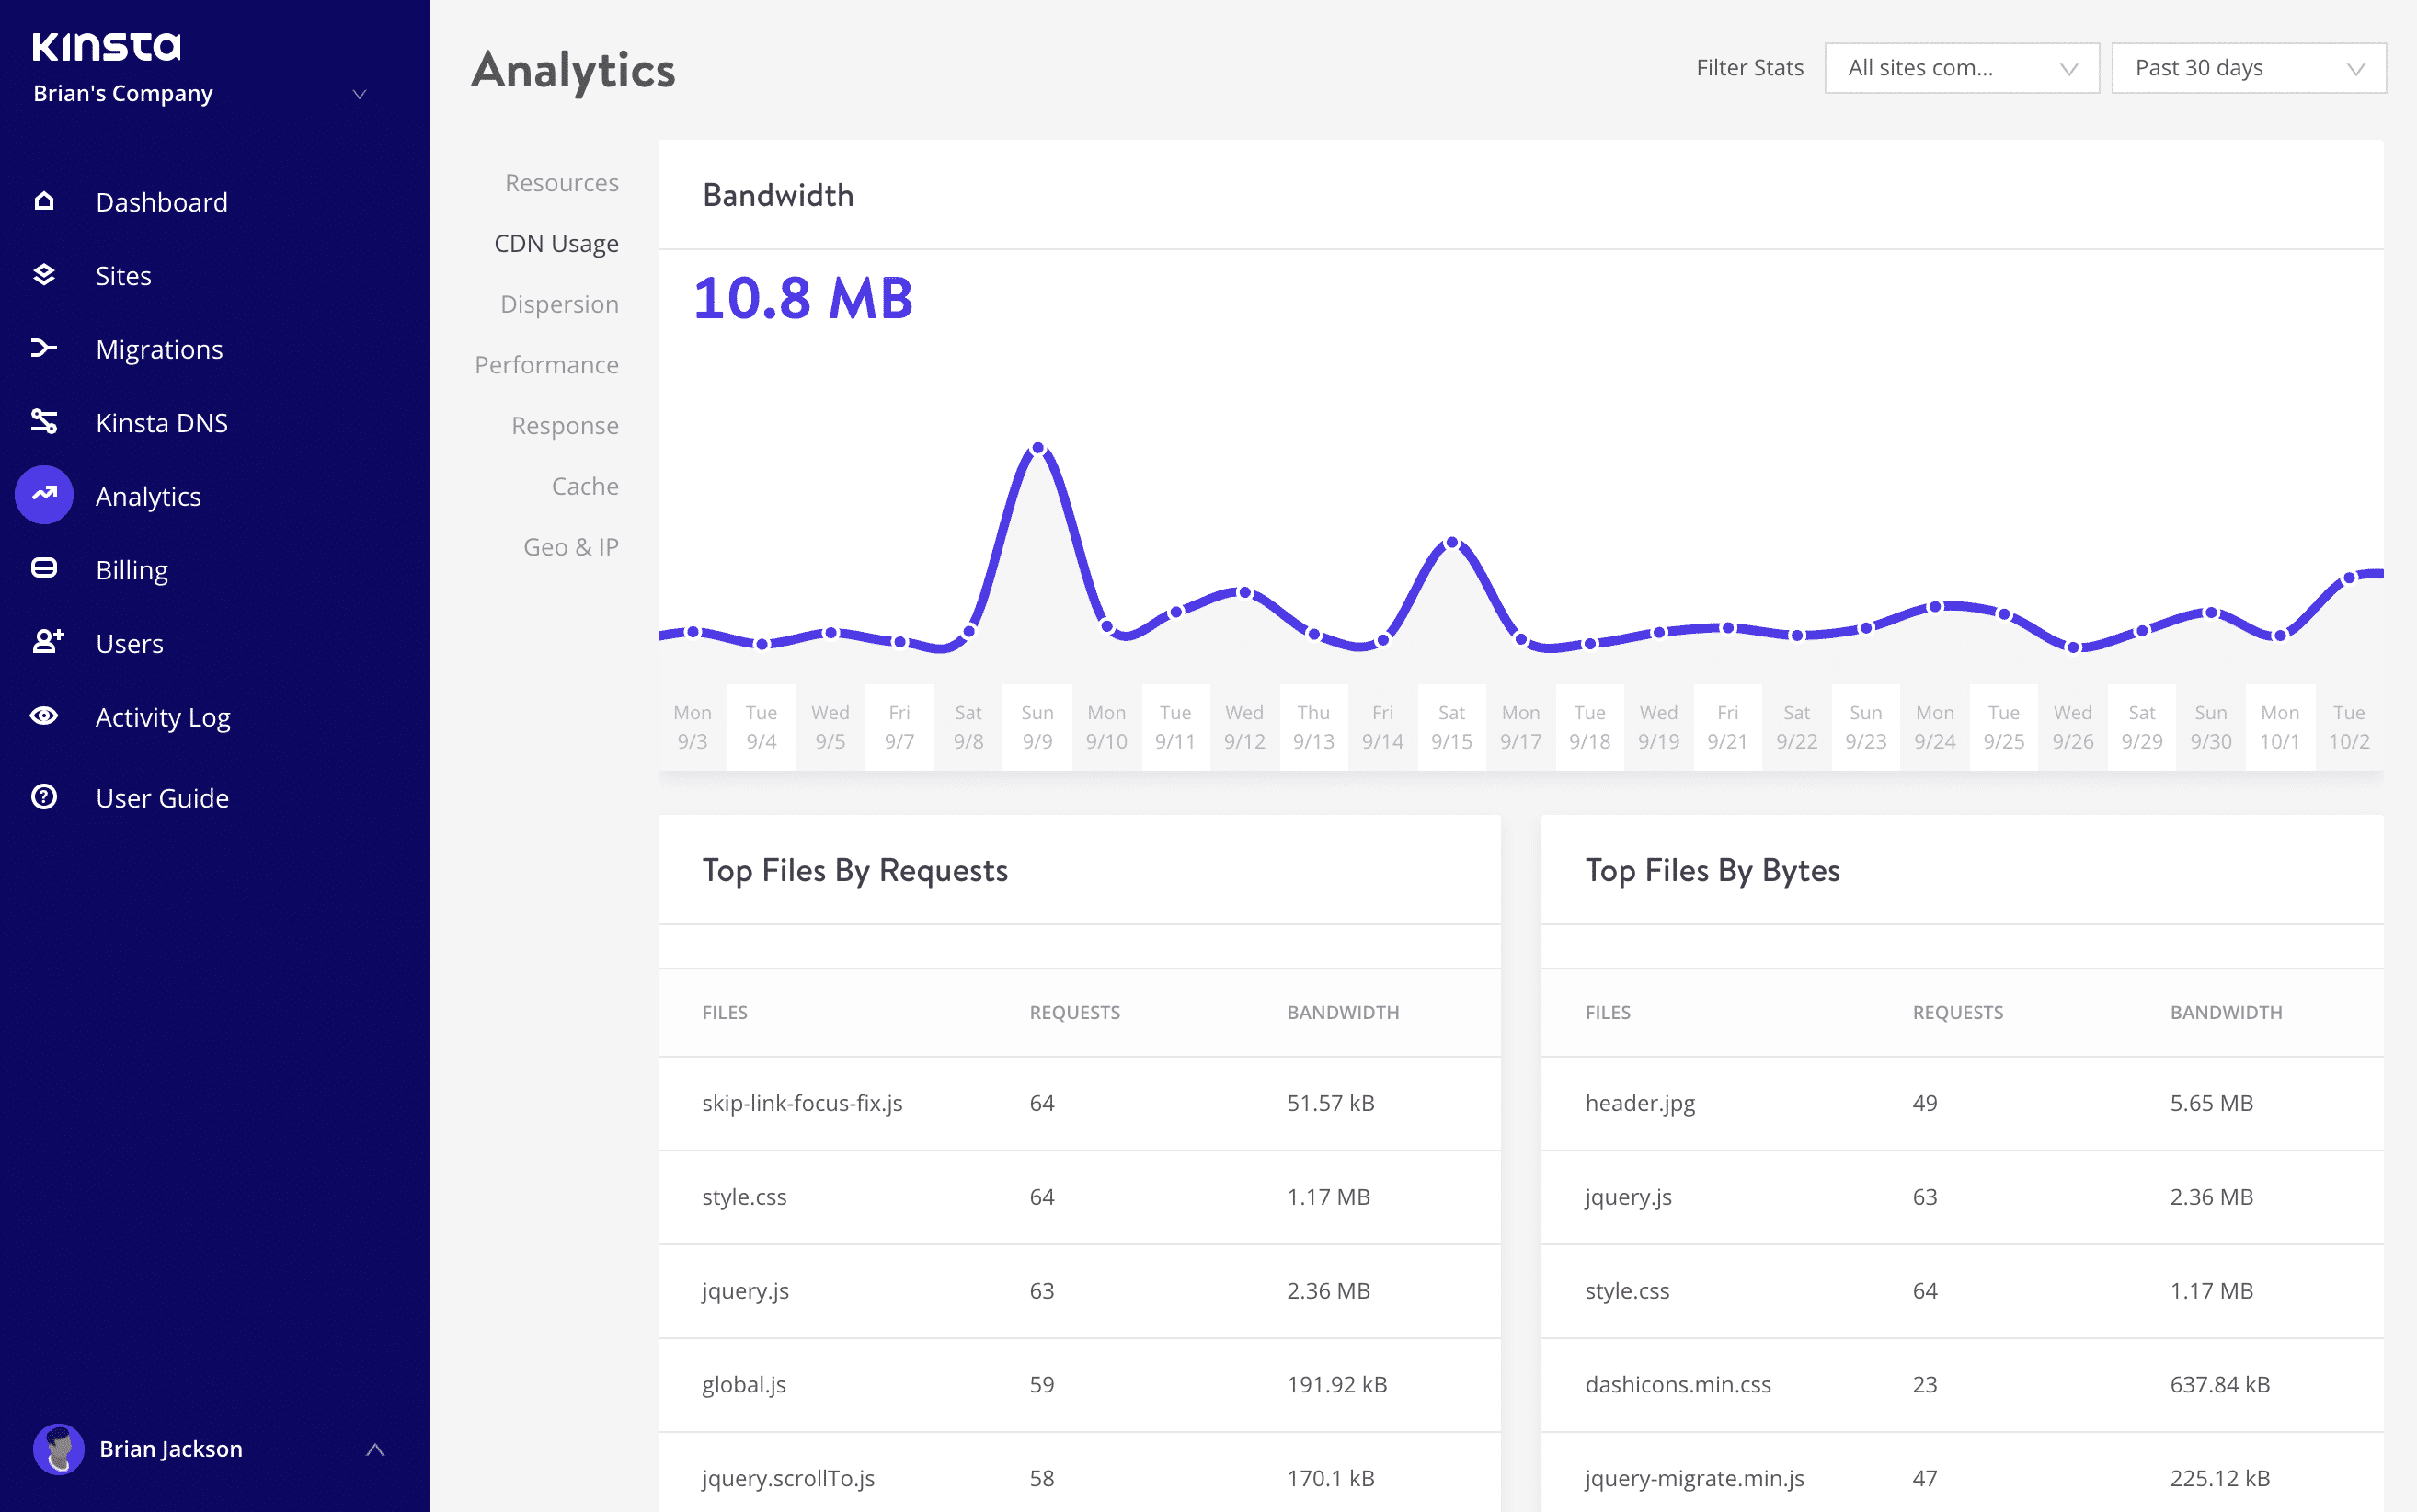
If you head over to your MyKinsta dashboard, there is a new sub-navigation menu called CDN Usage within Analytics. You can see an overview of usage across all of your sites, or filter it down individually. Data is available from the past 24 hours, 7 days, and 30 days.
The top section shows you bandwidth used by the Kinsta CDN. Below it, you can see the top files by requests and the top files by bytes. If a certain media file from your site is hogging all of your CDN bandwidth, you’ll be able to easily spot it within a few seconds.
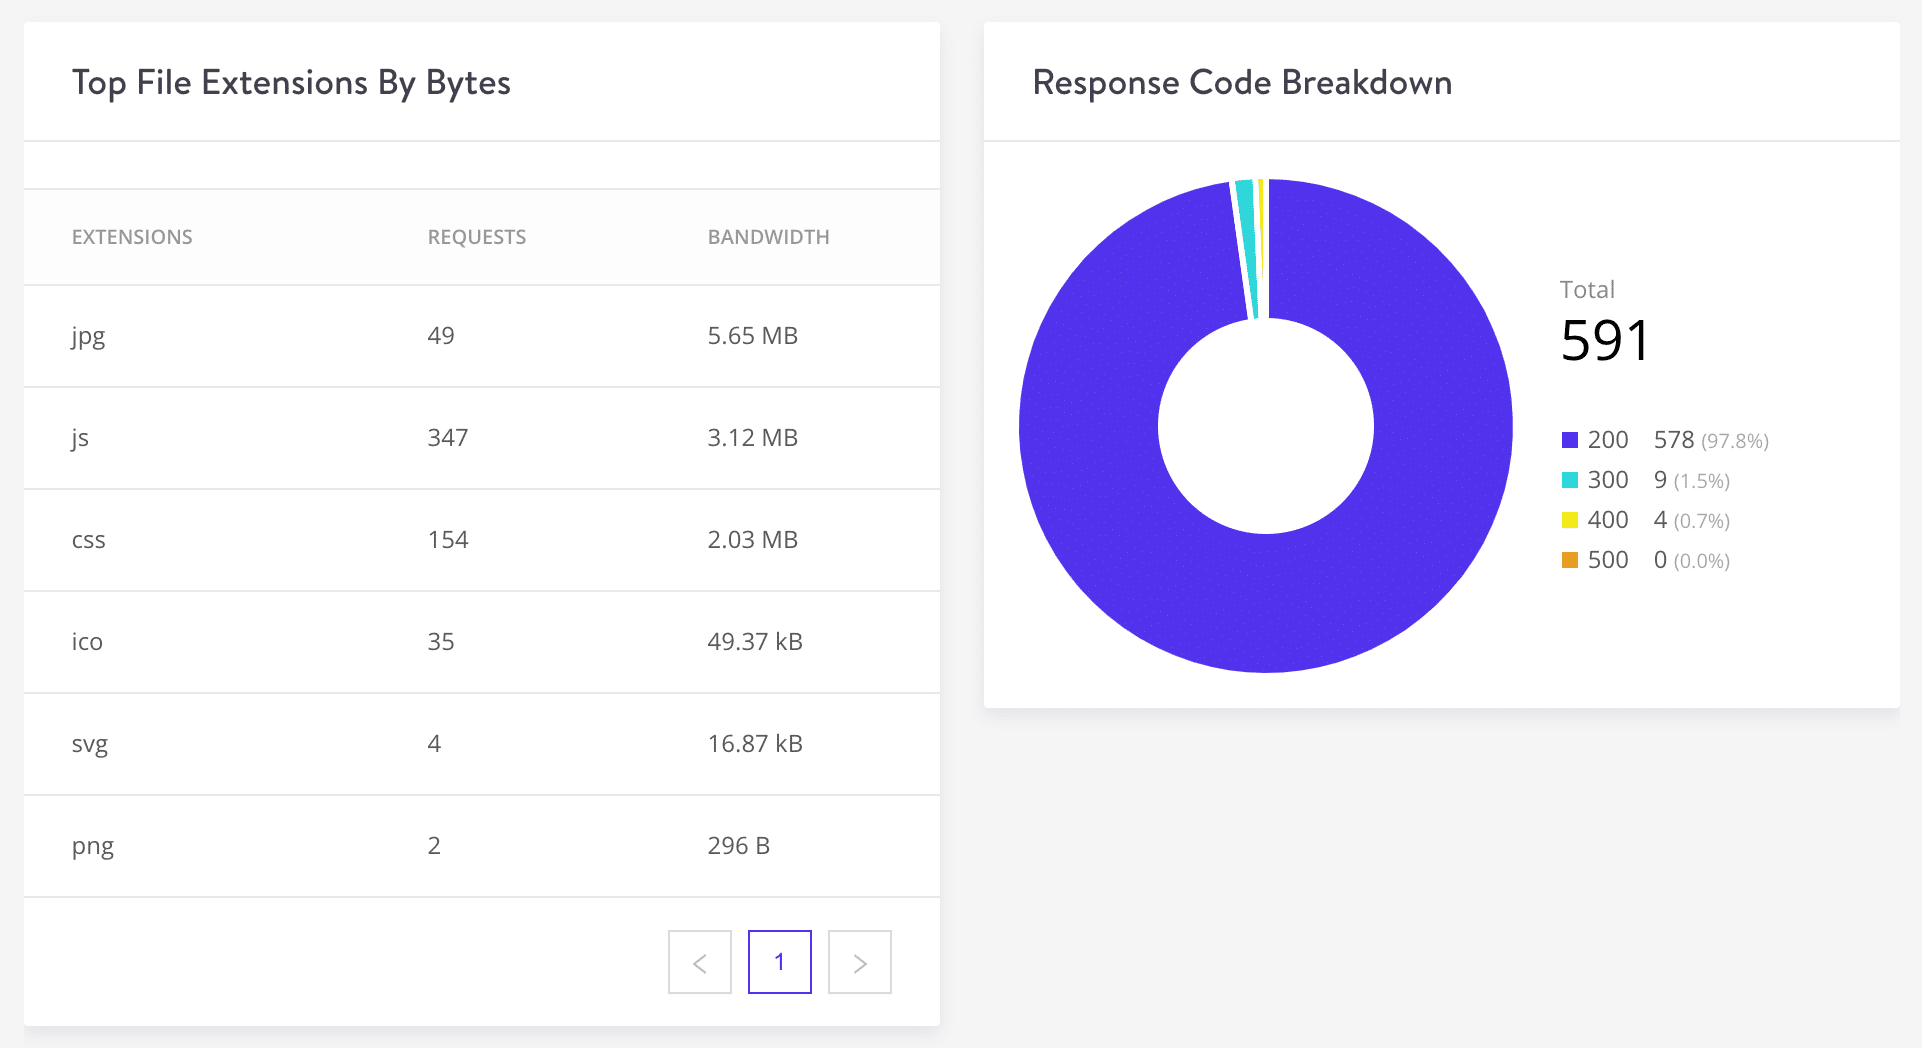
Below, you have two additional sections. Here you can see the top file extensions by bytes. This makes it easy to see what type of media on your site is responsible for the majority of your bandwidth usage.
You also have a response code breakdown. A 200 status code is typically what you want to see, this means that everything was delivered “OK.” Check out our post on HTTP status codes to learn more about 300, 400, and 500 status codes.