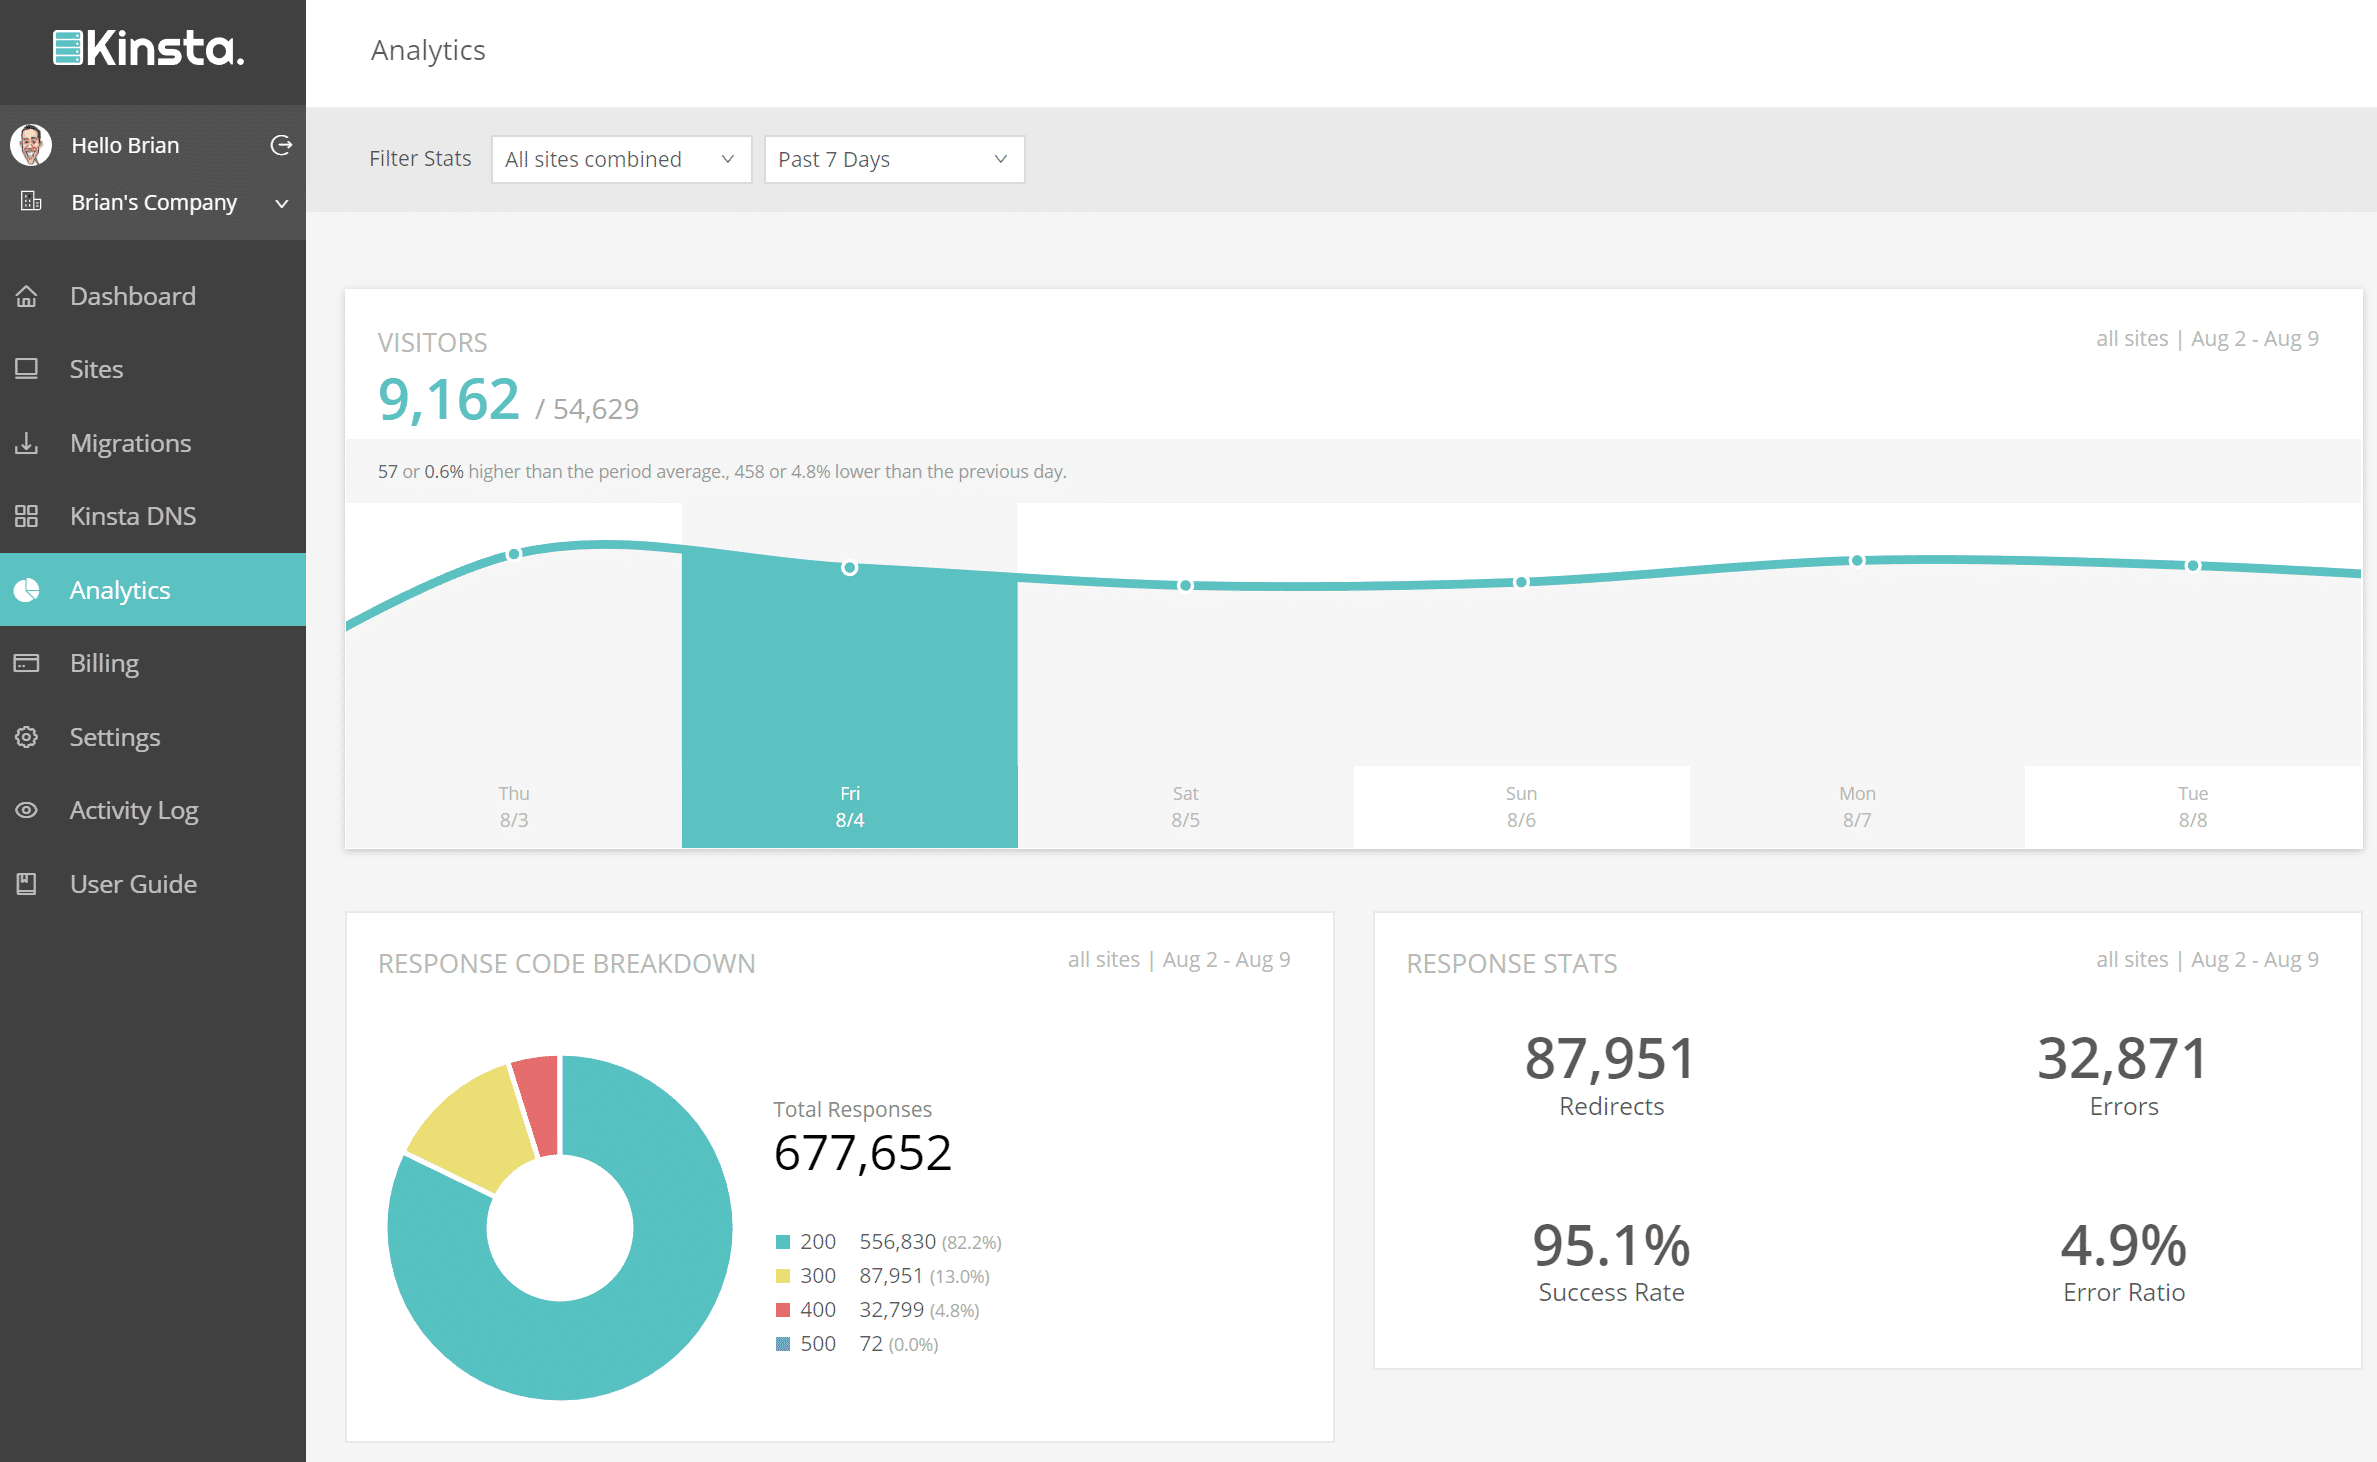
One thing we love here at Kinsta is data. That’s why we have completely revamped MyKinsta Analytics. You can now quickly gain insights into what is really happening on your WordPress site. The new reports include everything from resource usage, performance monitoring, and even security. These are separated into separate sections in the MyKinsta dashboard:
- Resource Usage: Visitors, bandwidth usage, top requests by bytes, top requests by visits
- Performance Monitoring: Average PHP & MySQL response time, PHP throughput, AJAX usage, upstream time
- Visitor Analysis: Unique requests, requests & bots, mobile vs desktop
- Response Analysis: Response code breakdown, response stats, 300, 400 & 500 error code breakdowns
- Cache Analysis: Cache component stack, top cache bypasses, component chart (HIT, BYPASS MISS, EXPIRE)
- Geo Analysis: Top countries, top cities, top regions
- Security Metrics: Top client IPs

This data can now be used to self-troubleshoot performance and security issues on your site, along with getting a better understanding of how Kinsta is actually delivering content to your visitors. And there’s more! Check out our in-depth knowledge base article on how to use the MyKinsta Analytics to further analyze your site.
