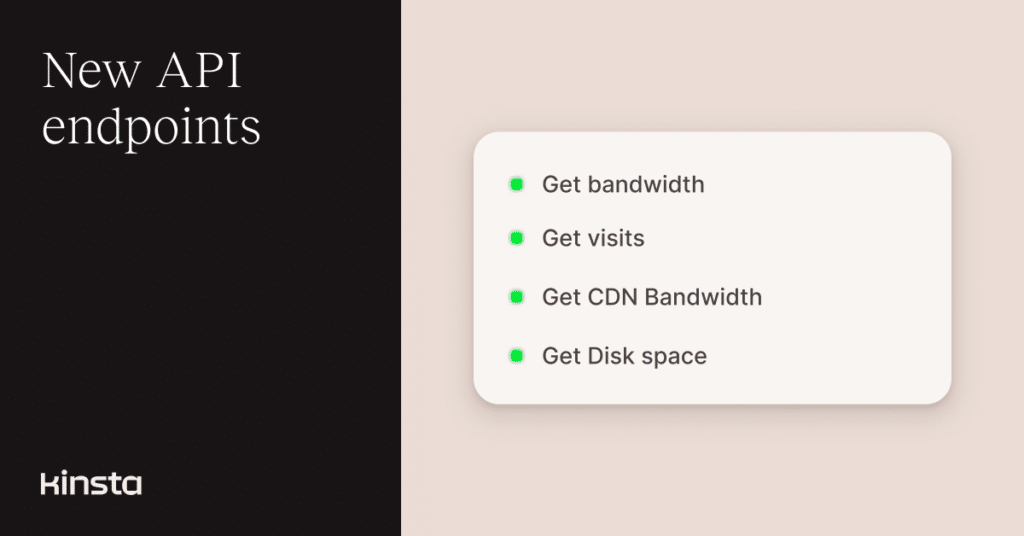
Analytics has always been one of the most-requested features for the Kinsta API, and it’s finally here.
The first release of analytics endpoints covers bandwidth, visits, CDN bandwidth, and disk space, enabling developers, agencies, and automation tools to monitor resource usage and generate reports programmatically.
Let’s examine these endpoints and how they work.
Get site bandwidth data
The new bandwidth endpoint lets you retrieve total bandwidth usage for a site or environment over a specific time range.
You can define the time span, such as 24_hours, 7_days, 30_days, 60_days, or specify exact dates for more granular reporting.
For example, here’s how to request data for the last seven days:
curl -i -X GET \
  'https://api.kinsta.com/v2/sites/environments/{env_id}/analytics/bandwidth?company_id={company_id}&time_span=7_days' \
  -H 'Authorization: Bearer <YOUR_TOKEN_HERE>'
Make sure to replace {env_id} and {company_id} with your actual environment and company IDs.
For a custom date range, include from and to parameters in YYYY-MM-DD format:
curl -i -X GET \
  'https://api.kinsta.com/v2/sites/environments/{env_id}/analytics/bandwidth?company_id={company_id}&from=2025-10-01&to=2025-10-15' \
  -H 'Authorization: Bearer <YOUR_TOKEN_HERE>'
The response includes total bandwidth and daily breakdowns over your chosen period, so you can easily visualize trends or integrate the data into dashboards.
{
  "analytics": {
    "analytics_response": {
      "key": "bandwidth",
      "data": [
        {
          "name": "bandwidth",
          "total": 1000,
          "dataset": [
            { "key": "2025-10-28T00:00:00", "value": "1000" }
          ]
        }
      ]
    }
  }
}
You can find full parameter options and sample queries in the API documentation for bandwidth analytics.
Get visits data
You can now fetch total and per-day visit counts for any environment, allowing you to track traffic and user activity programmatically. As with bandwidth, you can define time ranges or specific date intervals.
Example request:
curl -i -X GET \
  'https://api.kinsta.com/v2/sites/environments/{env_id}/analytics/visits?company_id={company_id}&time_span=30_days' \
  -H 'Authorization: Bearer <YOUR_TOKEN_HERE>'
Example response:
{
  "analytics": {
    "analytics_response": {
      "key": "uniqueip",
      "data": [
        {
          "name": "uniqueip",
          "total": 1000,
          "dataset": [
            { "key": "2025-10-28T00:00:00", "value": "1000" }
          ]
        }
      ]
    }
  }
}
Learn more about available fields and filters in the API documentation for visits analytics.
Get CDN bandwidth usage
If you’re using Kinsta CDN, you can now programmatically monitor total CDN bandwidth for each environment.
The endpoint supports flexible time spans and date filters, allowing you to measure CDN data transfer over time or within custom reporting windows.
Example request:
curl -i -X GET \
  'https://api.kinsta.com/v2/sites/environments/{env_id}/analytics/cdn-bandwidth?company_id={company_id}&time_span=30_days' \
  -H 'Authorization: Bearer <YOUR_TOKEN_HERE>'
Example response:
{
  "analytics": {
    "analytics_response": {
      "key": "cdn-bandwidth",
      "data": [
        {
          "name": "cdn-bandwidth",
          "total": 1000,
          "dataset": [
            { "key": "2025-10-28T00:00:00", "value": "1000" }
          ]
        }
      ]
    }
  }
}
You can find full query parameters and output examples in the API documentation for CDN bandwidth analytics.
Get disk space usage
This endpoint enables you to check the total disk space usage for a specific environment, including trends over time. It’s especially helpful for automating capacity checks, setting alerts for storage thresholds, or integrating data into monitoring dashboards.
Like others, you can query by company ID, time span, date range, and timezone to generate precise disk usage analytics.
Example request:
curl -i -X GET \
  'https://api.kinsta.com/v2/sites/environments/{env_id}/analytics/diskspace?company_id={company_id}&time_zone=02:00&time_span=30_days' \
  -H 'Authorization: Bearer <YOUR_TOKEN_HERE>'
Example response:
{
  "analytics": {
    "analytics_response": {
      "key": "diskSpaceUsage",
      "data": [
        {
          "name": "diskSpaceUsage",
          "total": 1000,
          "dataset": [
            { "key": "2025-10-28T00:00:00", "value": "1000" }
          ]
        }
      ]
    }
  }
}
See all available parameters and response formats in the API documentation for disk space analytics.
Build analytics into your own tools
These new analytics endpoints give developers more visibility into their Kinsta-hosted environments directly from their automation and reporting workflows.
Whether you’re tracking bandwidth, visits, or disk space, you can now integrate Kinsta data into your internal dashboards, third-party analytics platforms, or custom billing systems.
You can find all request examples and schema references in the Kinsta API documentation.
