We’ve updated website analytics reporting in MyKinsta to provide a better picture of cache performance, all the way from your site’s server to Kinsta’s Cloudflare-based CDN and edge cache.
Within analytics for a single site or the amalgamated data for what could be multiple sites at the company level, you will find this improved reporting in the new Cache Breakdown chart.
Getting a breakdown of cache performance
Navigate to the Cache Breakdown chart from a company Dashboard or the Site Information page for a particular WordPress environment by selecting Analytics in the left-hand menu and then clicking on the Cache tab at the top of the Analytics landing page:
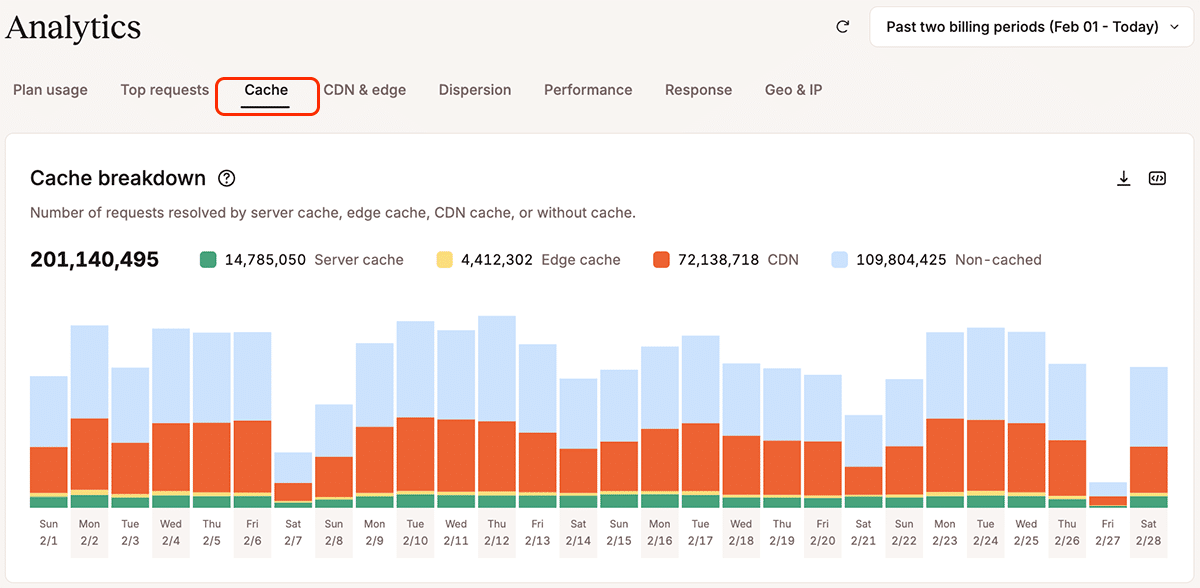
This chart tallies the number of requests resolved by:
- Server cache
- Edge cache
- The CDN
- Non-cached responses
Your server cache consists of complete website pages generated dynamically by WordPress and then stored for a period on your website’s own hard drive. WordPress can deliver these again to website browsers without having to generate them from content in its database.
The contents of server cache can also end up in edge cache if you have enabled that free service. Pages served from edge cache don’t require any resources from your site’s server.
The CDN works like an edge cache for static content like images, video, linked JavaScript and CSS files, and downloads in numerous other document formats.
The new Cache breakdown chart gives you a clear view of the relative performances of the caches available to a Kinsta-hosted WordPress site.
And don’t forget that you can now dig deeper into MyKinsta Analytics data for charts like this one and view up to 90 days of traffic history.
Not already a Kinsta customer? Let us introduce you to the MyKinsta dashboard.