
Logs can be very helpful when troubleshooting and debugging issues on your WordPress sites. Viewing your access and WordPress error logs is pretty simple. Just follow the instructions below.
How to View Access and WordPress Error Logs
There are a couple of different ways to view your access and WordPress error logs, one is via the MyKinsta dashboard, and the other is simply downloading the raw log files.
Option 1 – MyKinsta Dashboard
You can access your logs in the MyKinsta dashboard. This is a fast way to quickly debug something without having to spin up your FTP client or command line.
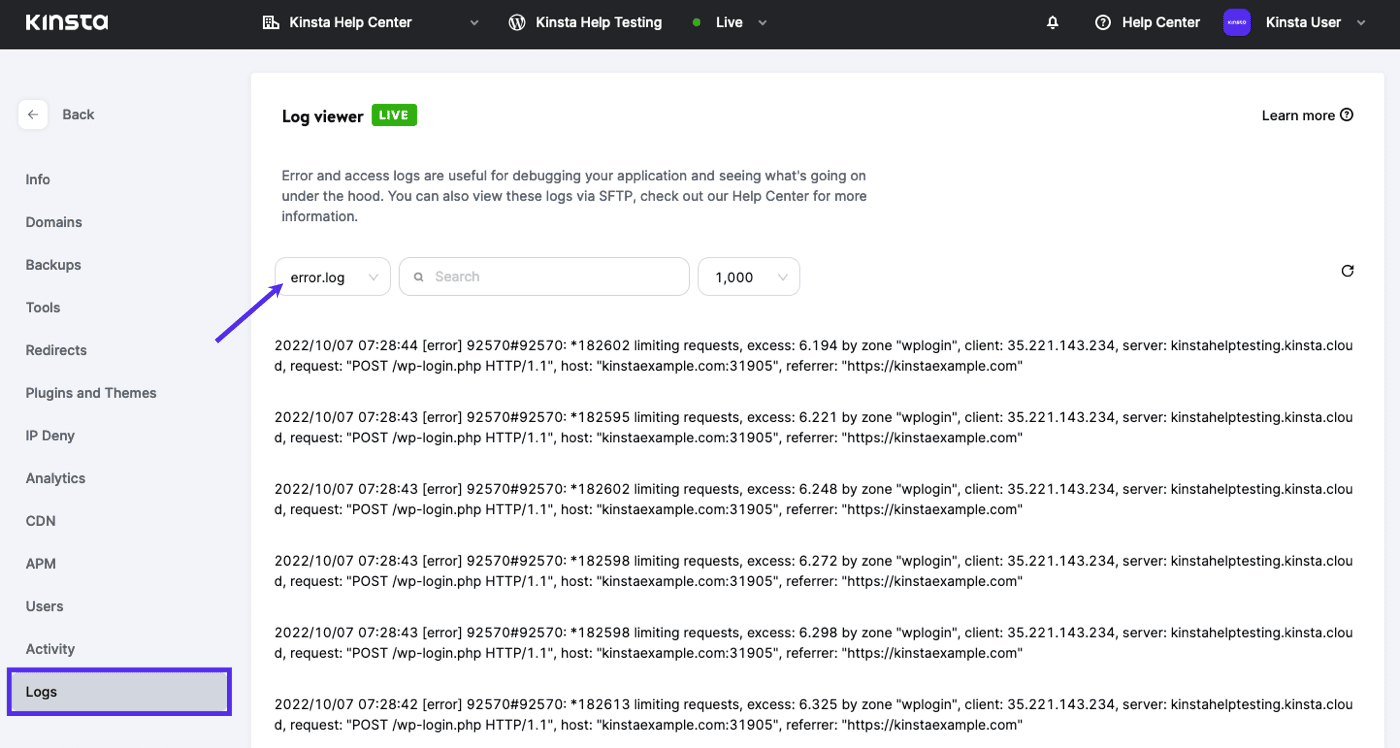
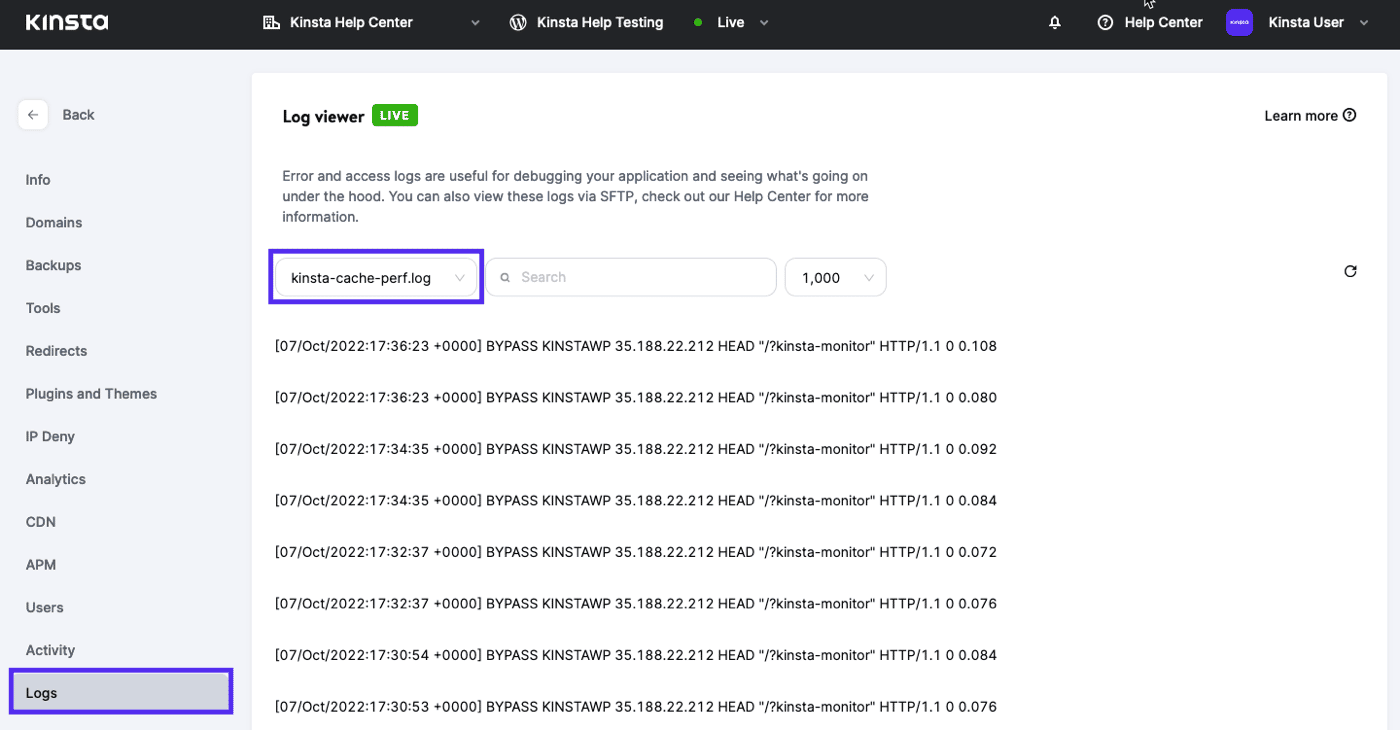
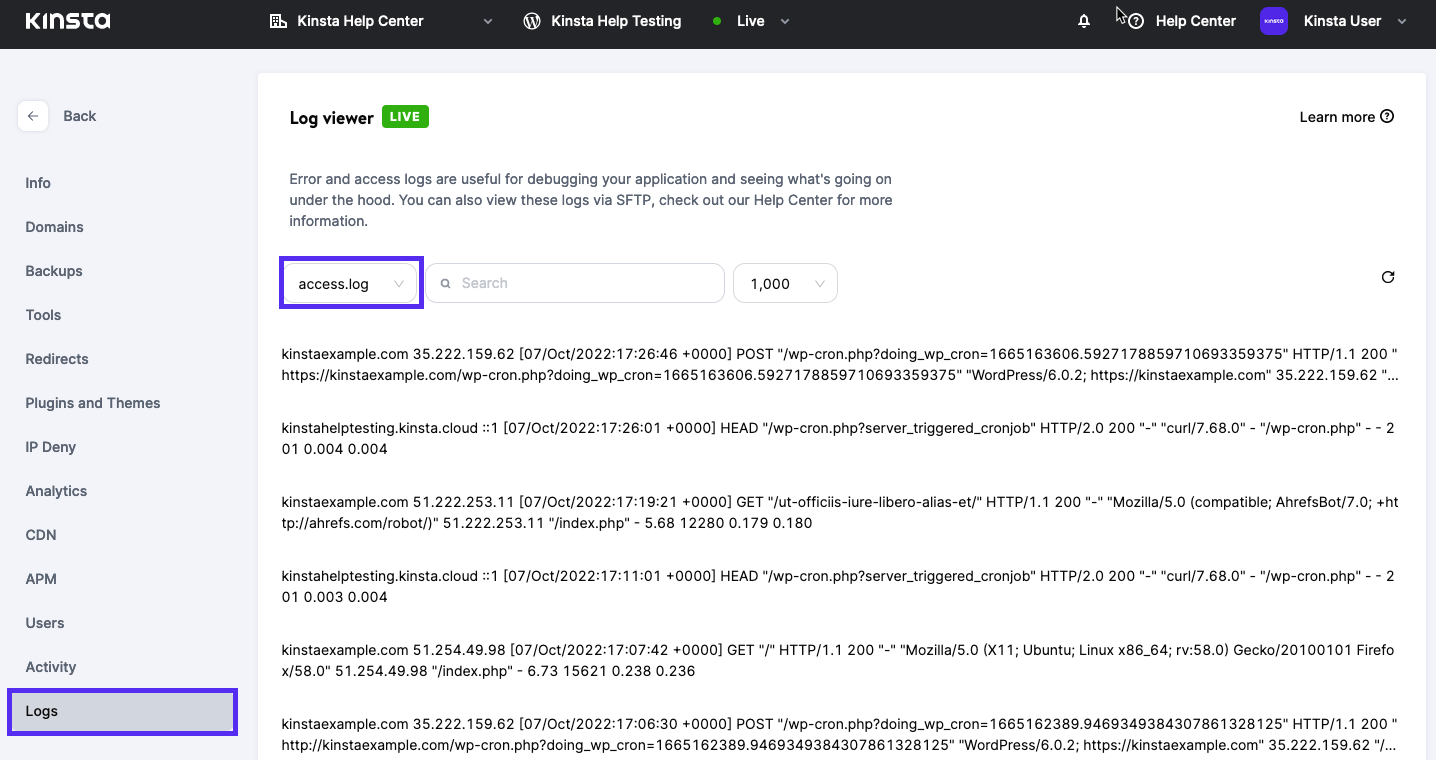
Simply click into one of your WordPress sites and, on the left-hand menu, click on Logs. You can view your error.log, kinsta-cache-perf.log, and access.log files by selecting your preference in the dropdown menu.
error.log file
kinsta-cache-perf.log file
access.log file
Option 2 – View Raw Access and WordPress Error Logs via FTP
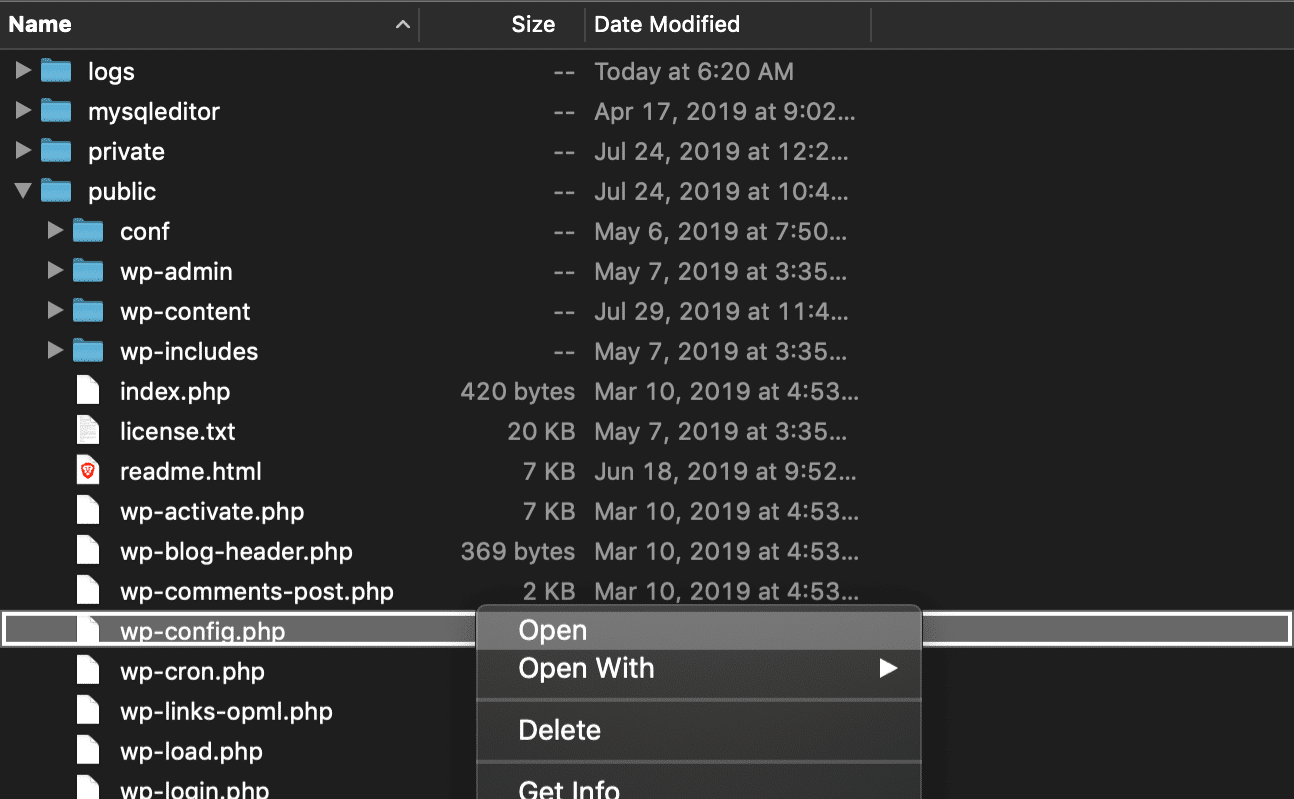
The second way to view your logs is simply downloading the raw log files. First, you will want to connect to your site via SFTP. Then in the root, you will see a folder called “logs”.
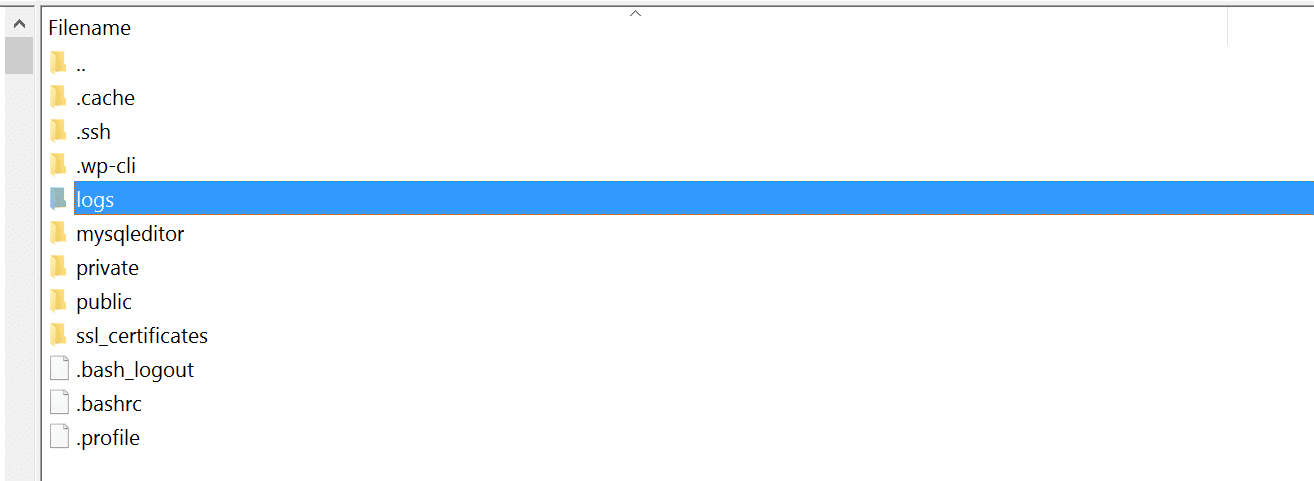
Within the folder are your access logs, WordPress error logs, and also your Kinsta cache logs.
- access.log
- error.log
- kinsta-cache-perf.log
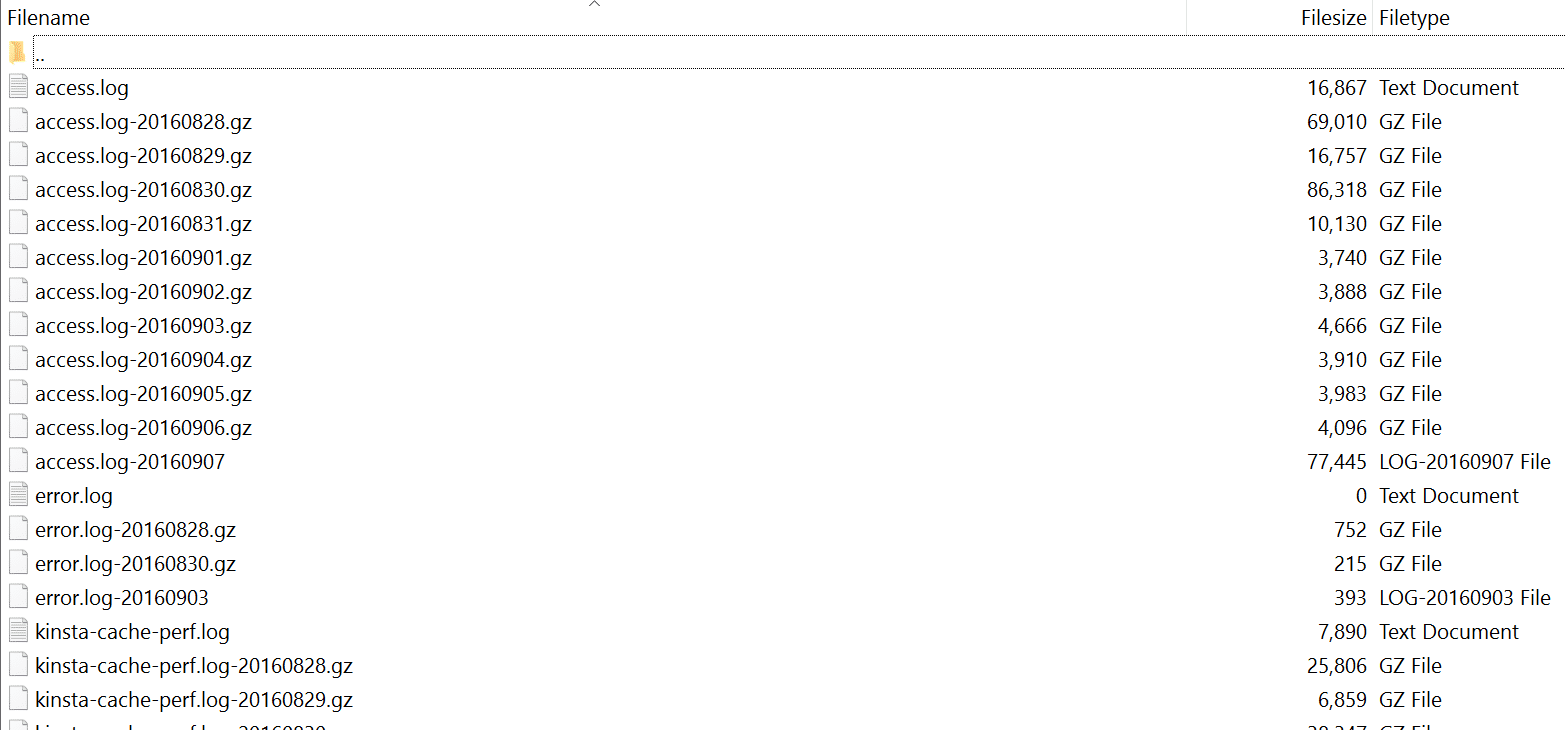
Gzip (.gz) backups are automatically created for older logs archives. You can see the codex for additional debugging information in WordPress.
Option 3 – Enable Debug Mode in MyKinsta
For Kinsta users, WordPress debug mode can be enabled right in the MyKinsta dashboard. Simply navigate to the Tools tab and click the Enable button under WordPress debugging.

Option 4 – Enable Error Logs in wp-config.php File
Your final option to view your WordPress error logs is to enable them in your wp-config.php file. First, you will want to connect to your site via SFTP. Then download your wp-config.php so you can edit it. Note: Always make a backup of this file first!
Find the line that says /* That's all, stop editing! Happy blogging. */ and just before it, add the following (as seen below):
define( 'WP_DEBUG', true );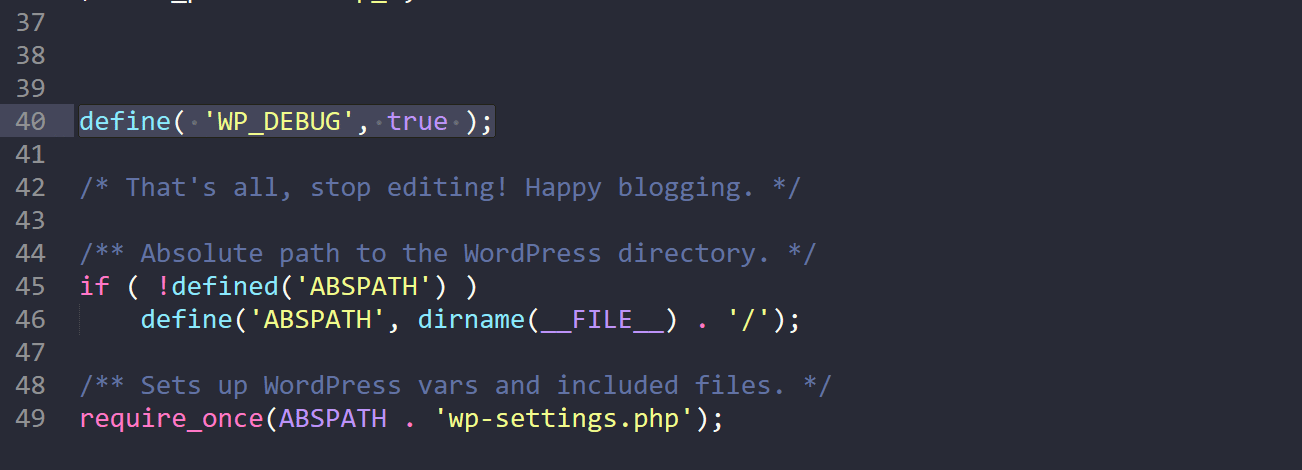
If the above code already exists in your wp-config.php file but is set to “false,” simply change it to “true.” This will enable debug mode. Note: You will also see warnings or error in your WordPress admin if they exist.
You can then enable the debug log to send all errors to a file by adding the following code just after the WP_DEBUG line (as seen below):
define( 'WP_DEBUG_LOG', true );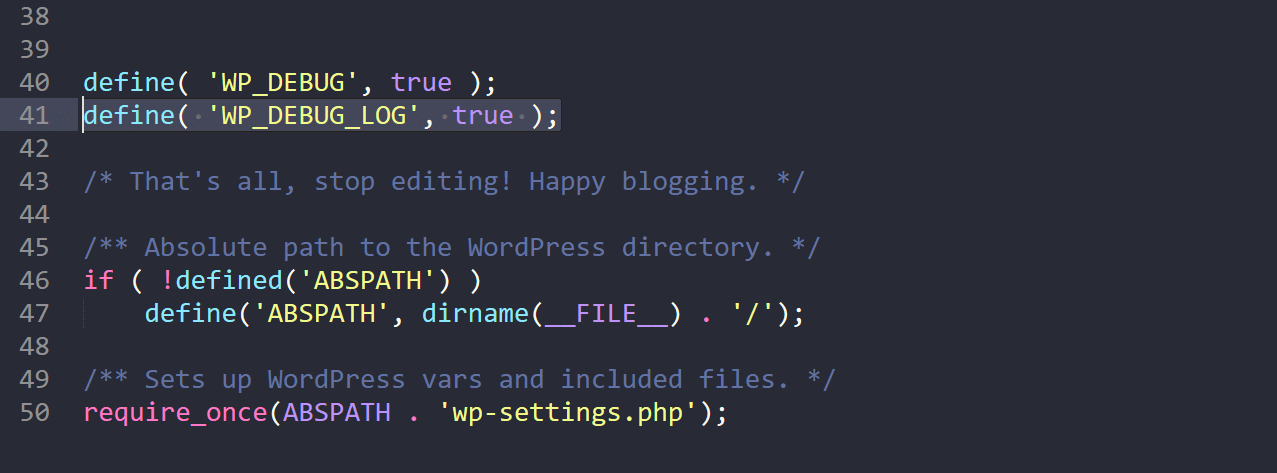
Save your changes and re-upload this to your server. The errors will then get logged to the debug.log file within your /wp-content/ folder. If for some reason you don’t see this file, you can always create one.
Important: If you have WP_DEBUG enabled in the Kinsta environment, all errors will be routed to the debug.log file and nothing would go to the error.log in the MyKinsta dashboard.
Option 5 – View Logs With Kinsta API
The Kinsta API is a powerful tool that allows you to interact with Kinsta services like hosted WordPress sites programmatically. The API also has an endpoint that you can use to fetch your site’s logs.
To use Kinsta’s API, you must have an account with at least one WordPress site in MyKinsta. You also need to generate an API key to authenticate and access your account.
Once you have your API key, to access your site’s logs with the API, you need to specify the site environment ID. You can obtain your site’s environment ID programmatically through the get site environment endpoint, which returns details about your site’s environment, including its ID:
{
  "site": {
    "environments": [
      {
        "id": "54fb80af-576c-4fdc-ba4f-b596c83f15a1",
        "name": "first-site",
        "display_name": "First site",
        "is_blocked": false,
        "id_edge_cache": "54fb80af-576c-4fdc-ba4f-b596c83f15a1",
        "cdn_cache_id": "54fb80af-576c-4fdc-ba4f-b596c83f15a1",
        "is_premium": false,
        "domains": [
          {
            "id": "54fb80af-576c-4fdc-ba4f-b596c83f15a1",
            "name": "example.com",
            "type": "live"
          }
        ],
        "primaryDomain": {
          "id": "54fb80af-576c-4fdc-ba4f-b596c83f15a1",
          "name": "example.com",
          "type": "live"
        },
        "ssh_connection": {
          "ssh_port": "808080",
          "ssh_ip": {
            "external_ip": "1xx.1xx.1xx.1xx"
          }
        },
        "container_info": {
          "id": "54fb80af-576c-4fdc-ba4f-b596c83f15a1",
          "php_engine_version": "php8.0"
        }
      }
    ]
  }
}
Once you have your site’s environment ID, you can then send a GET request to:
https://api.kinsta.com/v2/sites/environments/{env_id}/logs?file_name=error&lines=100This request includes the log file you wish to fetch (access, error, or kinsta-cache-perf) and the number of log lines to retrieve:
curl -i -X GET \
  'https://api.kinsta.com/v2/sites/environments/{env_id}/logs?file_name=access&lines=100' \
  -H 'Authorization: Bearer '
This will return a String with the specified number of log lines:
{
    "environment": {
        "container_info": {
            "logs": "mysite.kinsta.cloud ::1 [07/Dec/2023:00:02:01 +0000] HEAD \"/wp-cron.php?server_triggered_cronjob\" HTTP/2.0 200 \"-\" \"curl/7.68.0\" - \"/wp-cron.php\" - - 230 0.017 0.018\nmysite.kinsta.cloud ::1 [07/Dec/2023:00:17:01 +0000] HEAD \"/wp-cron.php?server_triggered_cronjob\" HTTP/2.0 200 \"-\" \"curl/7.68.0\" - \"/wp-cron.php\" - - 230 0.139 0.139\nmysite.kinsta.cloud ::1 [07/Dec/2023:00:32:01 +0000] HEAD \"/wp-cron.php?server_triggered_cronjob\" HTTP/2.0 200 \"-\" \"curl/7.68.0\" - \"/wp-cron.php\" - - 230 0.016 0.016\nmysite.kinsta.cloud ::1 [07/Dec/2023:00:47:01 +0000] HEAD \"/wp-cron.php?server_triggered_cronjob\" HTTP/2.0 200 \"-\" \"curl/7.68.0\" - \"/wp-cron.php\" - - 230 0.015 0.015\n"
        }
    }
}
You can then format the output to separate each line with the n line break. For example, with JavaScript, you can use the split() method:
const logsData = {
    "environment": {
        "container_info": {
            "logs": "string"
        }
    }
};

const logsString = logsData.environment.container_info.logs;

// Splitting the logs string into an array of log entries based on the newline character '\n'
const logEntries = logsString.split('\n');

console.log(logEntries);
Brian has a huge passion for WordPress, has been using it for over a decade, and even develops a couple of premium plugins. Brian enjoys blogging, movies, and hiking. Connect with Brian on Twitter.

