As any developer can attest, code is never ready for production after the first draft. One key part of the development process is debugging — removing or changing all parts of your code that don’t work.
The Xdebug extension for PHP is a popular way to root out and destroy all of the bugs in your code.
One of the great aspects of Xdebug is how flexible it is. Regardless of your preferred framework or development environment, you’ll be able to find a version of Xdebug that slots into your workflow. From there, getting a handle on the tool won’t take long.
This tutorial will look at Xdebug in depth, including the installation process, integrating it into your setup, and general usage.
First, let’s give you more context on what Xdebug is and what it does.
Introducing Xdebug
Xdebug is one of the most popular extensions to debug your PHP code. You’ll install it from within your chosen environment, and it acts as a “step debugger.”

In short, this enables you to work on your code line by line so you can step through and look at how the code acts and interacts within your program, as well as investigate its output. From there, you can make changes as you see fit.
Xdebug can do much more, though:
- You can analyze the performance of your code using a set of metrics and visualizations.
- When you run PHP unit tests, you can see which suites of code you run and execute.
- Xdebug includes “tracing” capabilities, which will write every function call to disk. This will include arguments, variable assignments, and return values.
- Xdebug also makes improvements to the standard PHP error reporting. We’ll cover more on this later.
Given the feature set, there are plenty of ways to use Xdebug (and any similar debugger) within your workflow. We’ll cover these in the next section.
Why You’d Want To Use Xdebug
Many developers won’t have a dedicated debugging workflow that uses third-party tools and extensions. This is because PHP includes its own rudimentary error logging. You’ll use commands such as error_log, var_dump, and print to see the results of variables and function calls.
For example, there are lots of snippets you can repurpose for WordPress development — Stack Overflow is rife with them:
function log_me($message) {
  if ( WP_DEBUG === true ) {
      if ( is_array($message) || is_object($message) ) {
          error_log( print_r($message, true) );
      } else {
           error_log( $message );
      }
  }
}
However, there are some important drawbacks to this approach:
- You first must ensure you enable error logs for the platform you are working with. In this case, you’ll want to enable
WP_DEBUG(more on this shortly). - This example of “dump” debugging offers less scope for investigation than step debugging. Here, you can only output whatever you define.
The latter point requires much manual effort, especially if your day job isn’t as a sysadmin. For example, if you want to debug a code block, you might add your snippet based on a variable you define. However, it might not be the source of the problem or even indicate what’s happening.
Instead, a tool such as Xdebug can work its magic to provide greater scope:
- You can “break” your code at various points during the execution to see what is happening in real-time.
- There are myriad metrics, visualizations, branches, and more to help you ascertain what your code is doing and how it responds.
- Sometimes, you can even change values on the fly during the debugging process. This offers immense value, even for suites of code that work well. You can essentially carry out manual unit tests at any point.
- Because you use breakpoints to mark up areas to debug, you don’t need to work with snippets within your code. This keeps your code cleaner and reduces the number of future issues.
Overall, using a tool such as Xdebug is a proactive decision rather than a reactive one. You can use step debugging as part of the core development process, much like implementing unit tests as part of test-driven development (TDD).
How To Turn On PHP Error Logging
While you could debug your code without a specific error, it’s often good to know if an issue occurs without having Xdebug open. This gives you a starting point for exploration. It’s not strictly necessary, but can be a helpful part of your chain.
To report every error that arises, you’ll need to add a line to the top of the relevant PHP file:
error_reporting(E_ALL);This is a catch-all command, and you can achieve the same using the ini_set function:
ini_set('error_reporting', E_ALL);This lets you change settings within your php.ini file on a project-by-project basis. While you could go into this file and make a manual change, it’s often a better idea to work with ini_set to change the specific parameter:
ini_set('display_errors', '1');Once you have active error reporting set to your liking, you can begin working with Xdebug.
How To Use Xdebug
Over the next few sections, we’ll show you how to use Xdebug, including the steps you’ll need to set things up. While we can’t cover every tool aspect, this quick-start guide will get you going fast.
First, though, you need to install Xdebug. Let’s find out how to do it.
1. Install Xdebug for Your Operating System (OS)
Because Xdebug is adaptable to any number of setups, the exact process for each one will be slightly different. At the OS level, there are a few differences:
- Windows: This is a somewhat complicated setup process that involves using an existing PHP file and an installation wizard, then downloading the right version for your system.
- Linux: The method here is arguably the most straightforward: You can use a package manager to install Xdebug, or the PHP Extension Community Library (PECL).
- Mac: This method is also simple: Once you install PECL, you can run
pecl install xdebugfrom a Terminal instance. You’ll also need to have XCode command line tools and PHP installed on your system.
However, most users won’t want to stick with a system-level instance of Xdebug. Instead, you’ll want to integrate it into your own development environment.
2. Integrate Xdebug Into Your Development Environment
Once you install Xdebug for your OS, you should connect it to your environment.
There are so many supported systems and tools here that we can’t go into all of them. Later on, we’ll offer you instructions for both DevKinsta and PhpStorm. Even so, there are lots of other popular environments to choose from. Below are some of our top recommendations.
Varying Vagrant Vagrants (VVV)
VVV is one of the named environments on the Make WordPress website:
The good news is that VVV already includes a version of Xdebug, but you need to activate it. You can do this using Secure Shell (SSH) within a Terminal window:
vagrant ssh -c "switch_php_debugmod xdebug"There’s a little bit of a performance hit, though, and you’ll need to turn this option back on if you provision your sites.
Laravel Valet
For some users, Laravel’s Valet represents a near-perfect web development environment. Even better, you can integrate Xdebug with it.
To do this, you’ll need to create a configuration file for the debugger. You can find your own path using php --ini at the command line, which will return a few different file paths:
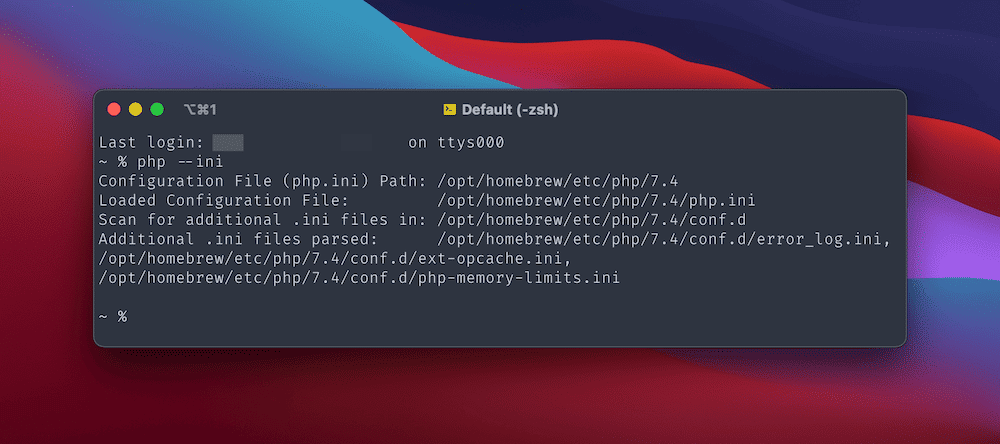
Next, create a new xdebug.ini file at the path for additional .ini files. In our example, it’s at /opt/homebrew/etc/php/7.4/conf.d.
Once you open this new file, also open the path to the Loaded Configuration File (your main php.ini file). With both open, add the following to the bottom:
- php.ini:
zend_extension="xdebug.so" - xdebug.ini:
xdebug.mode=debug
Once you’ve saved your changes, run valet restart from the Terminal, then add phpinfo(); exit; to one of your site’s files. You’ll want to check whether this works through a quick page load within the browser.
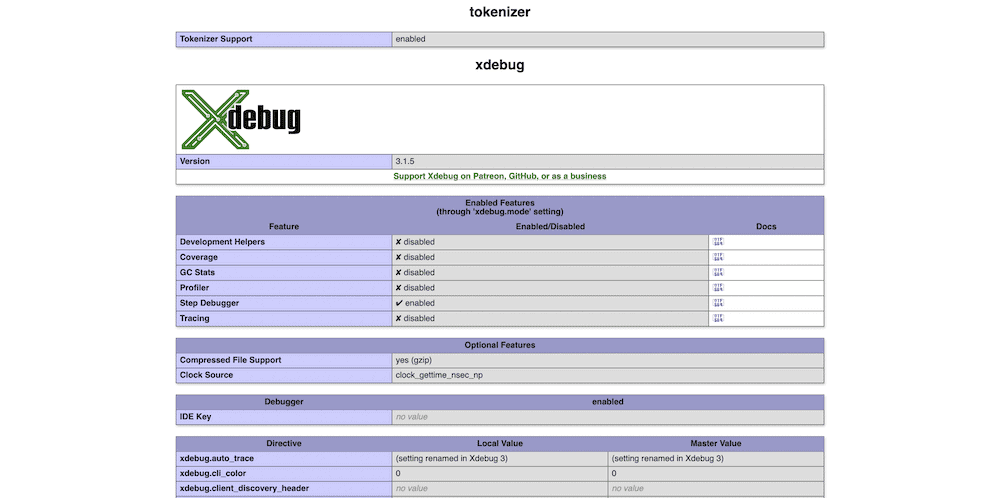
Note that you may need to restart PHP using sudo brew services restart php as well as check that your system installation of Xdebug is correct using php --info | grep xdebug. You’ll notice the Xdebug-specific lines within the output:
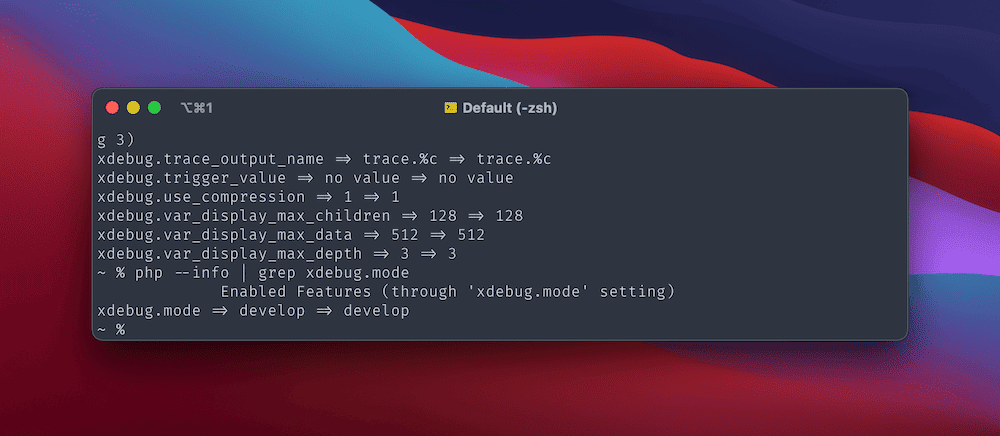
From here, you can look to incorporate Xdebug into your coding editor of choice.
XAMPP
Much like Valet, there are a few parts to the process for XAMPP. However, Windows and macOS versions have two different processes.
Begin by installing XAMPP, then run a quick check to see if the php_xdebug.dll file (Windows) or xdebug.so file (macOS) exists on your system:
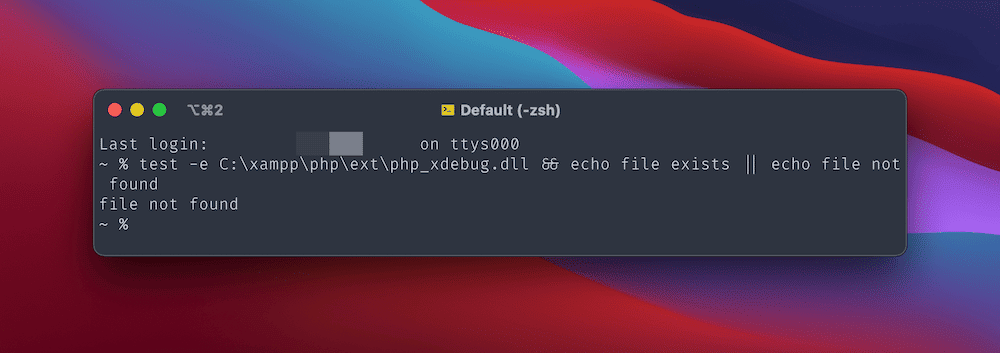
If the file exists, you can move on to the configuration. Otherwise, you’ll first need to download either the right binary for Windows — a 64-bit file for your preferred PHP version — or install a few more dependencies if you’re on a Mac.
For Windows, rename the DLL file php_xdebug.dll, then move it to the \xampp\php\ext file path. Next, open the \xampp\php\php.ini file in your preferred code editor and add the following:
output_buffering = OffAt the [XDebug] section, add the next three lines:
zend_extension=xdebug
xdebug.mode=debug
xdebug.start_with_request=trigger
Once you save your changes, restart Apache and test for Xdebug.
For Mac, you’ll want to ensure you install the Xcode command line tools using xcode-select --install at a Terminal instance. After that, there are three packages you’ll want to install using Homebrew:
brew install autoconf automake libtoolIn some cases, you’ll also need to reinstall XAMPP to get both the core program and the “Developer Files.” You should be able to re-install only these files, but you’ll want to carry out a backup of your existing setup first.
Next, navigate to the download for the Xdebug source folder on your system and unpack the TGZ file. Within a Terminal window, navigate to that directory and run the following:
phpize
pecl install xdebug
Note that you may need to use sudo here too. From here, you can edit the XAMPP php.ini file. For most macOS installations, you’ll find it at /Applications/XAMPP/xamppfiles/etc/php.ini. Within this directory, you’ll also find the path to your xdebug.so file — note this down and use it in place of the file path placeholder for this snippet:
[xdebug]
zend_extension=/path/to/xdebug.so
xdebug.mode=develop,degug
xdebug.start_with_request=yes
To test whether this works, create a new xdebug_info.php file within the main htdocs XAMPP directory. Inside, add the following:
<?php
xdebug_info();
…then refresh Apache and test Xdebug in the browser.
Using PhpStorm With Xdebug
Once you install Xdebug through the OS and your development environment, you’ll also need to view the debugger itself. You’ll do this through your chosen code editor or integrated development environment (IDE). As with your environment, there are so many to choose from, and each one might have a different approach.
That said, many developers opt to use JetBrains’ PhpStorm. In fact, PhpStorm offers “WordPress-aware assistance” — and it’s a popular choice for many other reasons, too.
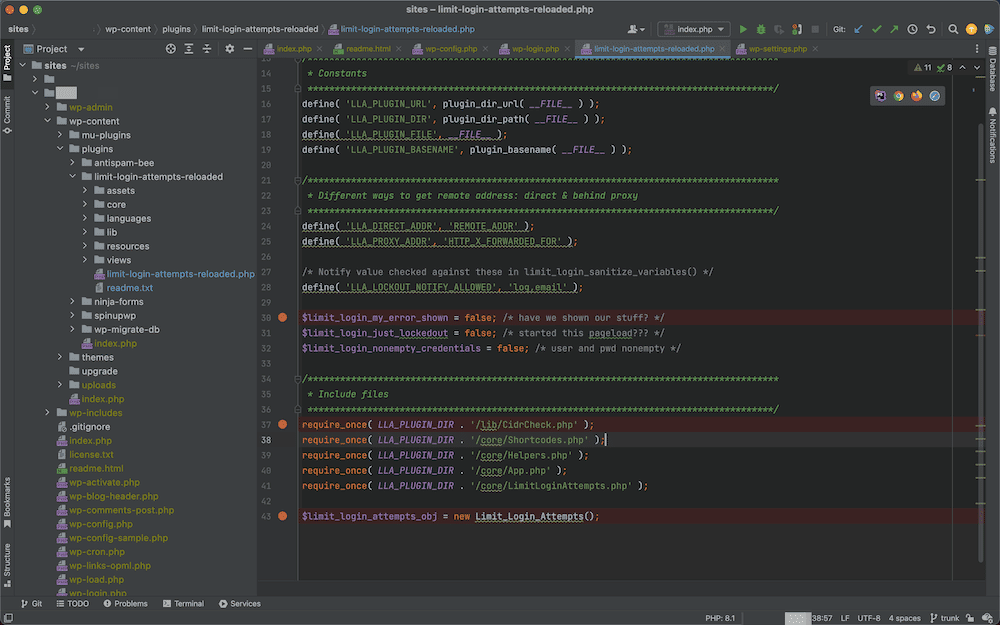
The JetBrains website includes full instructions on connecting Xdebug and PhpStorm, but we’ll review them here.
First, navigate to the Languages & Frameworks > PHP page within the Preferences pane. Here, open up the More Items kebab menu next to the CLI Interpreter dropdown field:

This will show some further details about your PHP version and interpreter. If you click the More items ellipsis next to the Configuration file option, you’ll see full paths for your php.ini file:

You’ll be working with this PHP file next to continue the setup process.
Working Within the php.ini File
The first task here is to edit out any lines that impact how Xdebug will work with PhpStorm.
Within the php.ini file, look for the following lines and either remove them or comment them out:
zend_extension=<path_to_zend_debugger>
zend_extension=<path_to_zend_optimizer>
These lines won’t be present in all cases, so don’t be alarmed if you aren’t seeing them.
Next, add the following to the file:
[xdebug]
zend_extension="xdebug.so"
xdebug.mode=debug
xdebug.client_host=127.0.0.1
xdebug.client_port="<the port (9003 by default) to which Xdebug connects>"
There are a few things to note about this suite of code:
- You may already have an
[xdebug]section, in which case you can omit the first designation. - The
zend_extensionentry may need you to add the full path of xdebug.so to connect. - While it might look like a placeholder, the
xdebug.client_portparameter is how you’ll set it within your code.
Once you add these, save and close the file, then test the PHP version from the command line (using php --version):
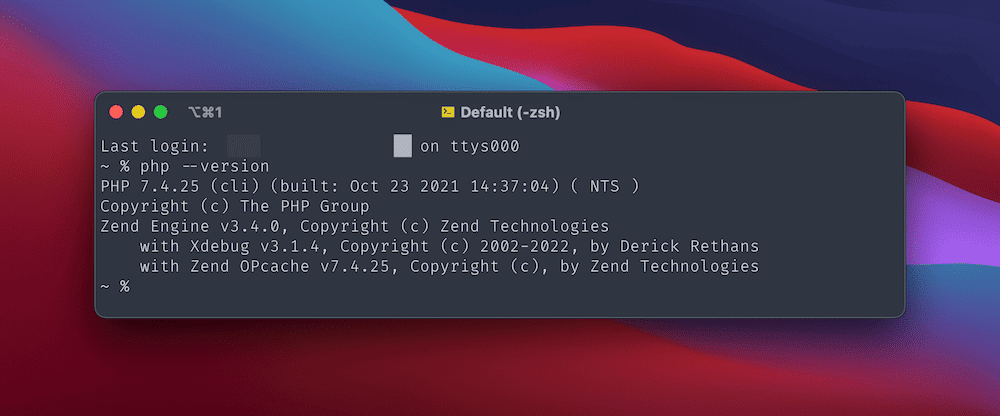
If you have a working version of Xdebug, it will show as one of the PHP extensions. You can also add phpinfo(); to a new file and test this in the browser.
This is just about all you need to do to have Xdebug work as your default debugger with PhpStorm. The final step before using it is installing a browser helper extension.
Installing a Browser Helper Extension
The final key connection you’ll need to make is between your browser and PhpStorm, accomplished by activating step debugging on the server. While you could do this from the command line using special GET or POST values, it’s more straightforward to use an extension.
We recommend utilizing the dedicated Xdebug Helper extension. You can install it on your browser of choice:
If you want to explore other extensions, the JetBrains website offers a few additional options for the most popular browsers.
Once you’ve installed your chosen browser extension, you shouldn’t have to adjust any further configuration settings. From here, you can begin to use Xdebug with PhpStorm.
Using Xdebug
While we’ll use PhpStorm here, you’ll see a similar layout and interface between different IDEs — though there will also be some obvious differences.
There are a few concepts that combine to form the whole debugging experience:
- Breakpoints: These are the points where Xdebug will stop to let you inspect the output. You’re able to set as many of these as you’d like.
- Listening for connections: You can toggle this on and off, though most developers will always leave it on.
- The debugging screen: The majority of your time will be spent within the debugging interface — it’s where you’ll work with the various lines of code, variables, and parameters.
The first step is to activate listening — you won’t be able to debug anything without it. To do this, click on the Run > Start Listening for PHP Debug Connections option in the toolbar:
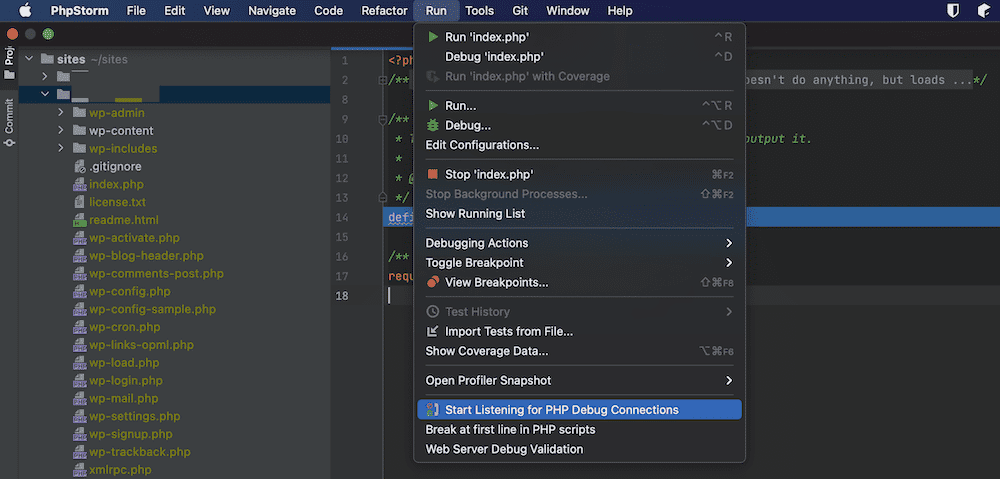
As an alternative, you can click on the “telephone” icon within PhpStorm’s toolbar:

Either of these options will start the listening for connections.
From here, you can begin to set breakpoints within the code editor’s gutters. A red dot indicates a breakpoint, which you can click to activate:
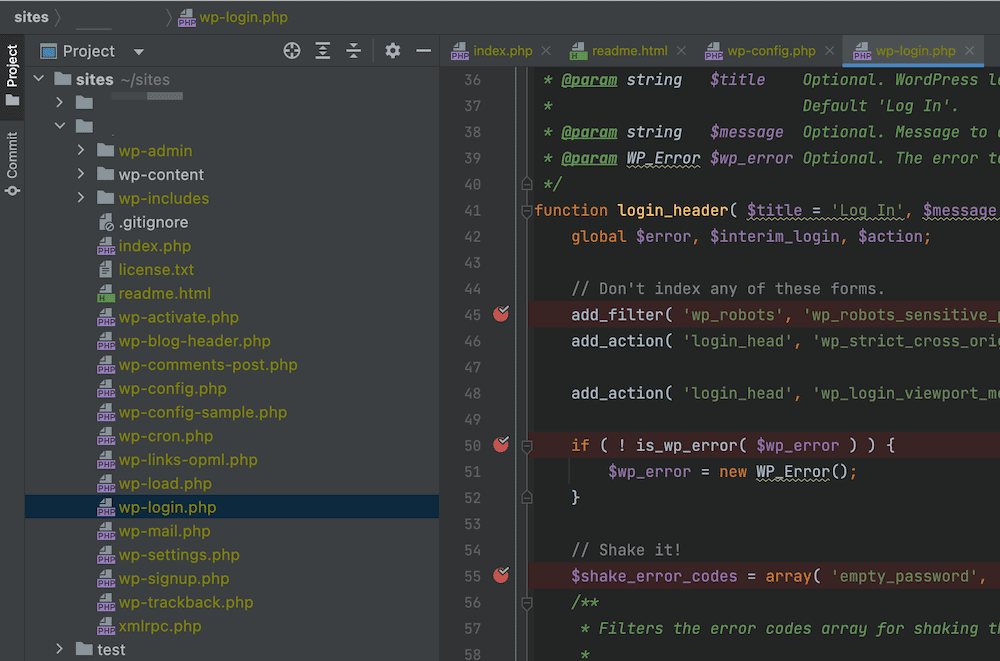
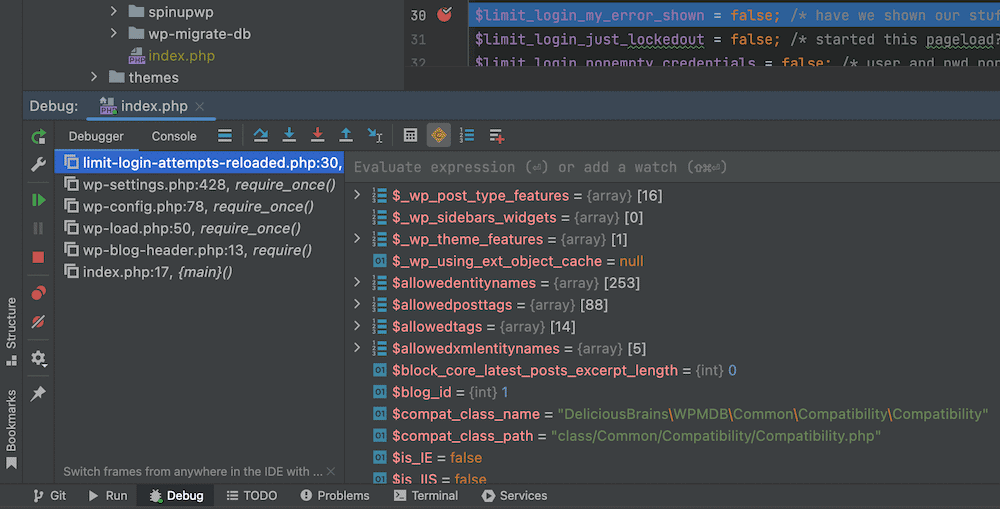
When you want to debug your code, the most straightforward way is to begin listening, set breakpoints, then head to the specific page in your browser. Locate the icon for your extension within the browser, then click on it and select the “Debug” option:

This will open the debugger in PhpStorm and deliver either the good or bad news:
If you right-click on the various values, attributes, parameters, and variables, you’ll be able to access a further context menu. This gives you plenty of extra scope to test and debug your code:
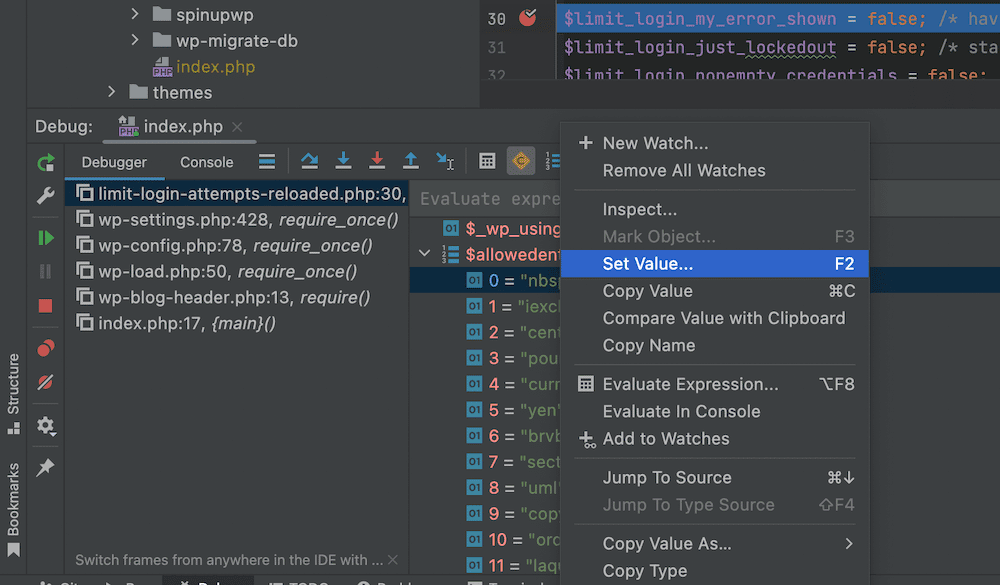
For example, you could set different values for variables along the path. This might be a deliberate attempt to break your code and see what happens, or it could be a way to test out code that already needs a fix. Either way, this gives you a fantastic method for debugging your code without having to alter it first.
How Kinsta Helps You to Debug Your WordPress Website
WordPress comes with its own set of debugging options through WP_DEBUG and other tools, such as Query Monitor. These enable a mode in which you’ll start to see previously hidden error messages all over your site and dashboard. From there, you can begin to figure out what the problem is.
You can also save those error messages using WP_DEBUG_LOG, which gives you a way to document the issues with your site. We cover how to set this up in another article on the blog. This is a breeze to set up through your MyKinsta dashboard (and the Sites > Tools screen):

If you pair this with the free DevKinsta local environment tool, you’ll also have a one-click way to enable and disable WP_DEBUG for each site you spin up:
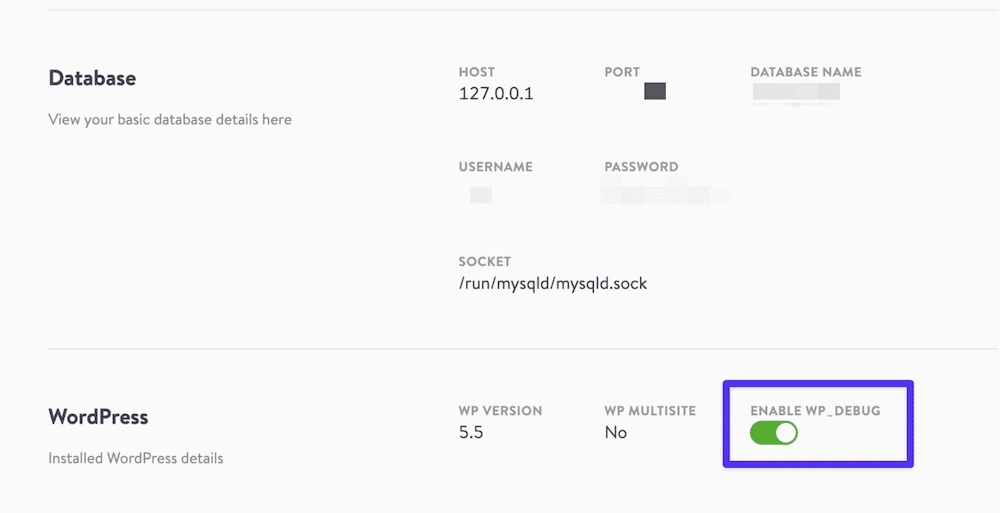
This means you can catch errors on your site during development, and make sure they don’t make it through to your live site. These modes are also easy to turn off — vital for both site and user security.
All Kinsta plans also come with the built-in Kinsta APM tool, which is our custom-designed performance monitoring tool for WordPress sites.
Command Cheat Sheet
Before we wrap up this post, we should mention shortcuts.
Like many other software pieces, there are various ways to navigate around Xdebug (and PhpStorm) using the keyboard alone. In fact, you could even use the command line to debug PHP scripts.
Once Xdebug is up and running, you can use the following commands to get around:
| Command | Shortcut |
|---|---|
Specific the port to listen on (such as [9003]) |
-p [value] |
| Sets a breakpoint on the specified line for the file path given. | breakpoint_set -t line file:///<path> -n <line> |
| Runs your script until the end, or the next breakpoint | run |
| Steps into the next executable line | step_into |
| Lists variables and values in the current scope | context_get |
| Displays the value of the specified property | property_get -n <property> |
While your specific code editor will have its own dedicated shortcuts, the focus here is on PhpStorm. Take a look at this table of keyboard shortcuts for using Xdebug with PhpStorm:
| Command | Windows | macOS |
|---|---|---|
| Find Action | Ctrl + Shift + A | Shift + Cmd + A |
| Open the Debugger | Shift + F9 | Ctrl + D |
| Toggle Breakpoint | Control + F8 | Cmd + F8 |
| Step Into | F7 | F7 |
| Step Over | F8 | F8 |
| View Breakpoints | Ctrl + Shift + F8 | Shift + Cmd + F8 |
| Resume the Program | F9 | F9 |
| Evaluate the Current Expression | Alt + F8 | Option + F8 |
Thankfully, there isn’t a lot to memorize here. You must open the debugger, set breakpoints per line, listen for connections, and run your scripts.
However, if you need a shortcut for a particular task, you can use the PhpStorm Find Action command:
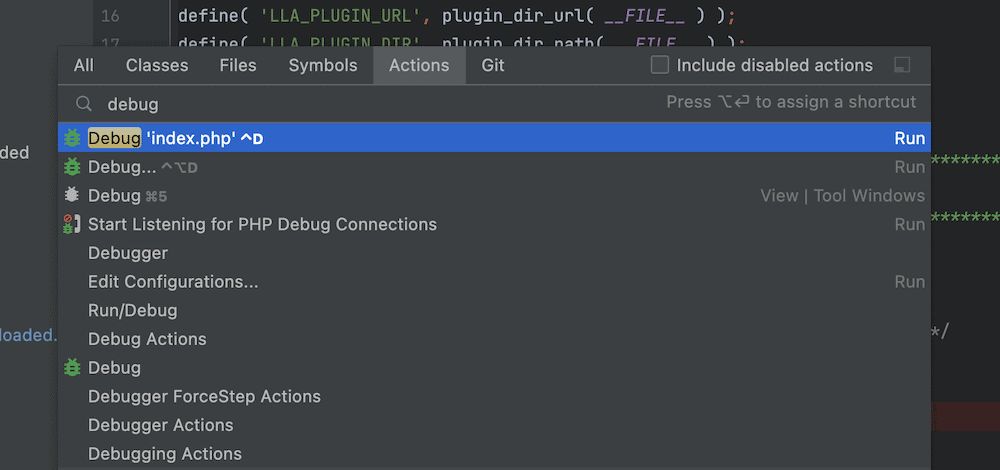
Once you begin to type in this space, you’ll be shown a dynamic list of commands and related shortcuts. You can also find a PDF version of all keyboard shortcuts through the Help > Keyboard Shortcuts PDF menu.
If you want more of a real-time look at shortcuts as you work with the mouse, JetBrains provides the Key Promoter X plugin:
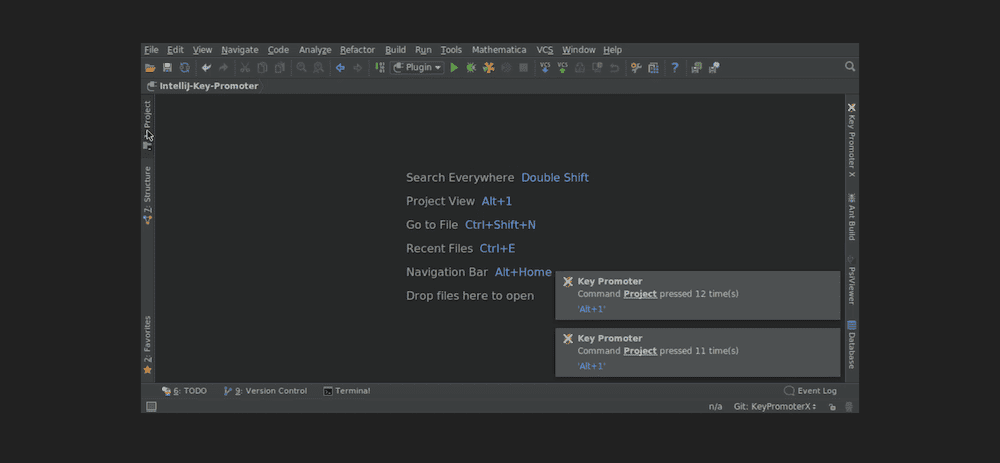
This handy tool will display notifications of your latest performed action, along with its related keyboard shortcut. Once you learn and use the shortcuts, you can phase this plugin out and restore that valuable real estate to your screen.
Summary
The practice of debugging has come a long way from its humble beginnings; it now encompasses a much wider scope than its progenitors could have possibly imagined. To carry out a thorough job when it comes to fixing your PHP code, you’ll need to use a competent tool. There are many superb extensions and tools to choose from, but Xdebug is an arguable frontrunner.
As we’ve seen, Xdebug can adapt to even the most eclectic of tastes in code editors, and it’s especially great when paired with PhpStorm. However, regardless of your setup, there will often be a version of Xdebug to suit your needs. On the whole, it’s a powerful, flexible, and intuitive tool to use.
Do you think Xdebug deserves its high praise, or is there another debugging tool that you prefer? Let us know in the comments section below!

