When working on a WordPress development project with dozens or more plugins installed, it’s common to encounter performance issues. However, finding what’s causing the performance issue is not always easy.
You’ve eliminated the usual suspects: hosting is adequate, there are no apparent JavaScript or PHP errors, and nothing else is amiss. You suspect that one or more of the plugins you’ve installed are to blame, but how do you figure out which plugin is causing the problem?
The usual method of identifying a troublesome plugin is to deactivate plugins until you find the performance bottleneck.
However, there’s a quicker and more efficient way. This is the scenario that the free Query Monitor plugin was made to resolve. It can help you debug performance issues, develop sites more efficiently, and get a better handle on your WordPress site.
In this guide, you’ll learn everything you need to know about Query Monitor — what it is, what it does, and how to use it.
What Is Query Monitor?

Query Monitor is a 100% free plugin that helps you debug your WordPress site’s performance and development.
You can think of it like Chrome Developer Tools, but specifically for WordPress. You can dig into database queries, scripts, timing, and more. And you can also view tons of helpful information, such as general environment information and details for specific pages.
Query Monitor then presents all of this information in an easily accessible manner that you can access from anywhere on your site.
Query Monitor is maintained by John Blackbourn, a principal web engineer at Human Made. He also has several other useful plugins, including WP Crontrol (great for wp-cron debugging) and User Switching (great for debugging the experiences of different user roles).
John is very responsive and constantly working on maintaining and improving Query Monitor. Automattic and other sponsors support his work.
If you find value in the plugin by the time you finish this post, you can support Query Monitor by sponsoring the project on GitHub for as little as $1 per month.
What Does Query Monitor Do?
Query Monitor can help you debug more than queries to the WordPress database despite the name.
Don’t get us wrong – debugging database queries is something that Query Monitor does well and one of the most significant benefits of the plugin.
However, it also digs into many other areas, including performance-focused debugging and just general development debugging.
Here’s a sampling of the many details that Query Monitor can help you analyze and debug:
- Database queries, including showing you queries from specific plugins
- PHP errors
- Memory usage
- HTTP API calls
- Enqueued scripts and styles, including dependencies
- Hooks and actions
- Theme template files
- Languages and translations
- Rewrite rules
- Block editor blocks
- General environment information
- WordPress admin screens
One notable limitation of Query Monitor is that it’s primarily for “in the moment” debugging. When it shows you the database queries, timing, and so on, it’s only doing it for the current page load.
It generally does not track or display historical information/trends, though John says this feature is planned for future versions.
How To Use Query Monitor to Debug WordPress and Improve Performance
Now that you know what Query Monitor is and what it does, let’s get into how you can use Query Monitor to debug your site’s performance and some of the other tools for general development debugging.
We’ll give you a general introduction to the Query Monitor interface and how it works. Then, we’ll dig into each area in the interface.
There are 12+ different high-level interface areas, so there’s plenty to cover. However, the exact number of interface menus you see will depend on the page you’re analyzing.
Let’s dig in.
An Introduction to the Query Monitor Interface
Query Monitor doesn’t have its own separate interface area. Instead, it displays new information inside the WordPress admin bar on both the frontend and backend.
Query Monitor initially displays a quick summary with four pieces of information:
- Page generation time – 0.05 s in the screenshot.
- Peak memory usage – 7.7 MB in the screenshot.
- Total time taken by SQL queries (in seconds) – 0.00 s in the screenshot.
- Total number of SQL queries – 54 in the screenshot.
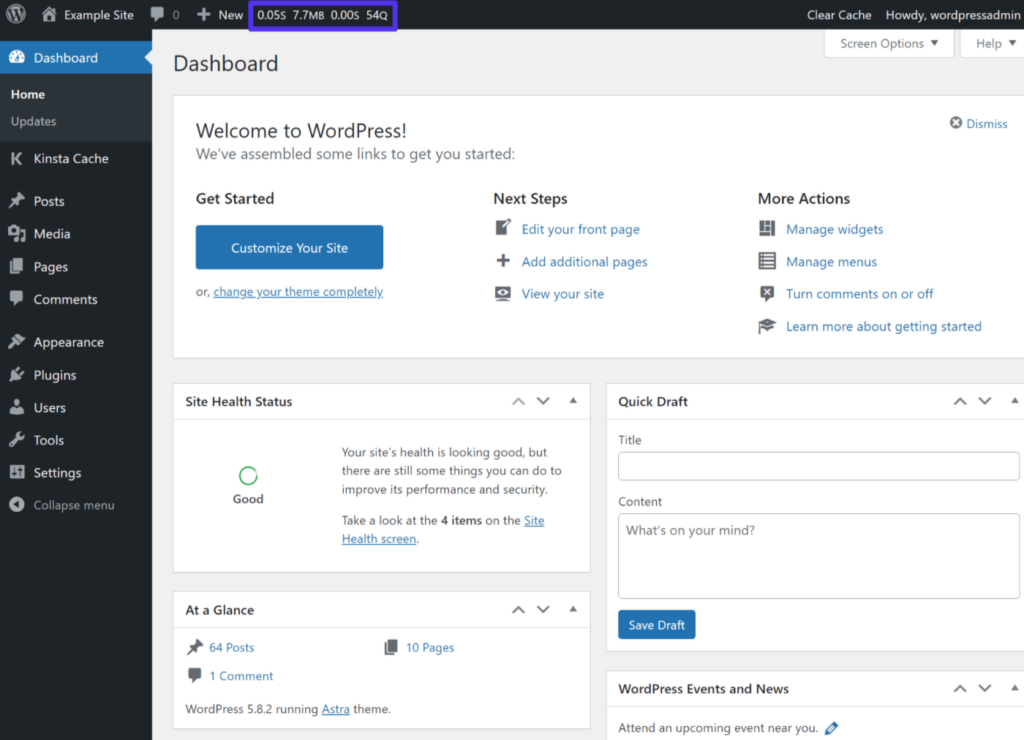
If you click on this summary, you’ll open the whole Query Monitor interface, which displays as a window overlay on the frontend or backend page that you’re currently viewing.

All of the features and information that Query Monitor offers are contained in this overlay window.
If you’d prefer to change the layout of the overlay window, you can click the button in the top-right corner to switch it to a sidebar interface. You can also use drag-and-drop to change the size of the window.
The Query Monitor interface and its information are only visible to Administrators (or Super Administrators on WordPress multisite).
There’s also an option to set an authentication cookie to still view the Query Monitor output, even when you’re not logged in (or you’re logged in as a user with a lower user role). We’ll share how to do this a little later in the guide.
Let’s go through each tab in the interface and explain how you can use it to debug your WordPress site.
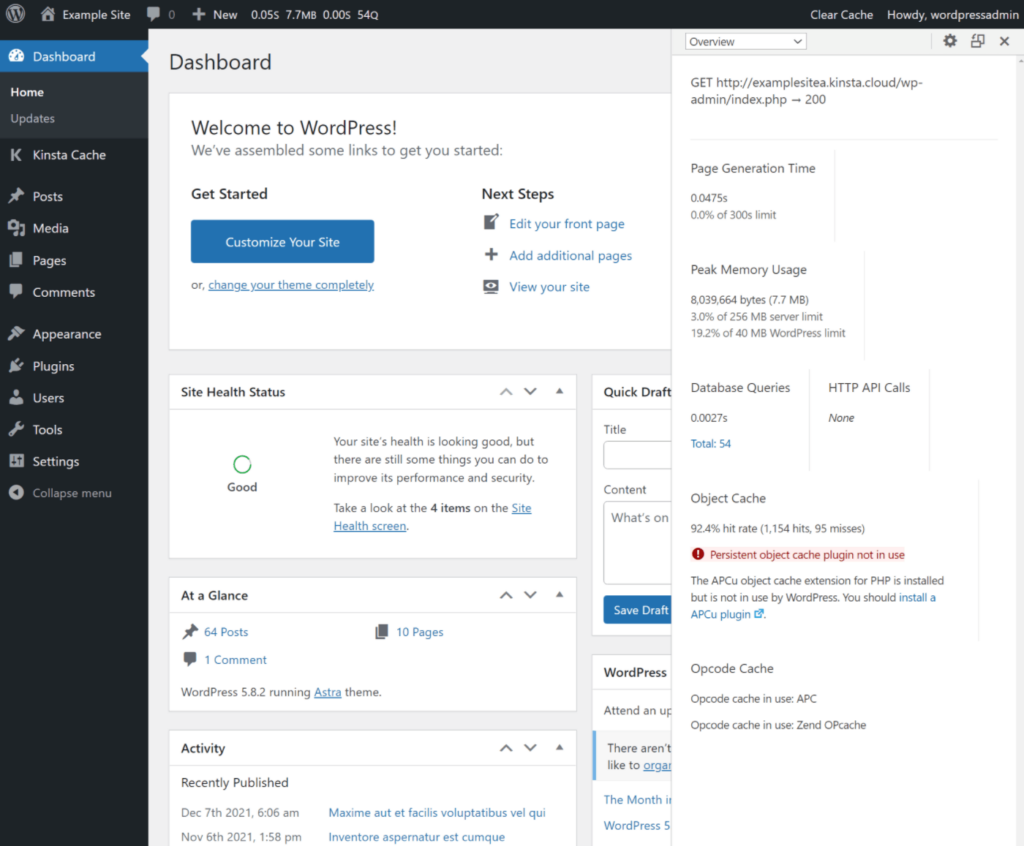
Overview
The Overview tab displays more details from the admin bar summary and some general environment information.
For example, instead of just seeing the peak memory usage, the Overview tab goes one step further to see how that peak usage compares to your server and WordPress memory limits.
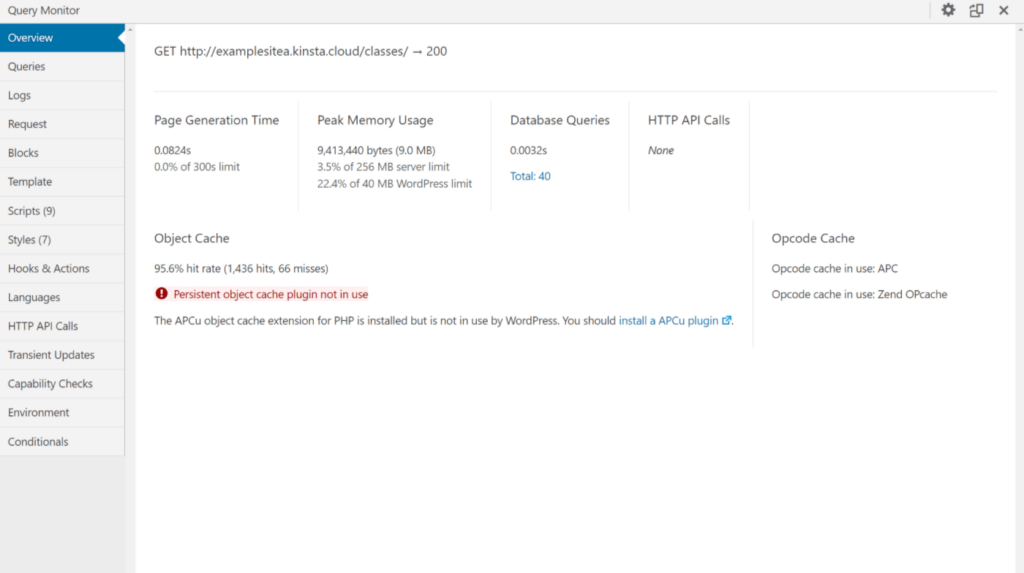
There’s nothing too detailed here – it’s just an overview (hence the name).
Queries
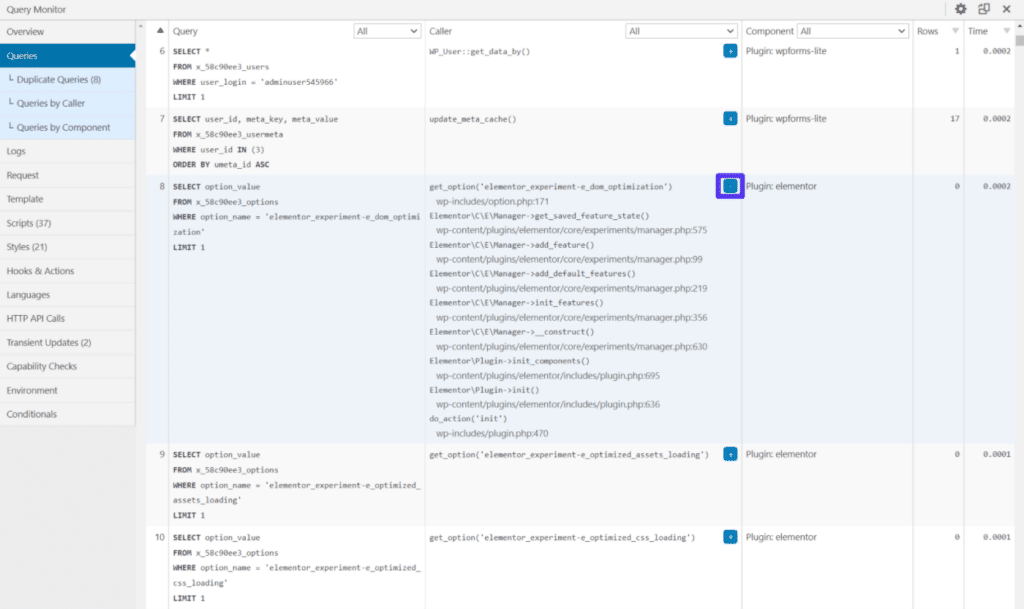
The Queries tab lets you dig into each database query for the page you’re looking at. It’s one of the most information-rich areas in Query Monitor, which makes sense when you consider the plugin’s name.
For each query, you can see the following information:
- The full query
- Query caller
- Query component (e.g. whether it comes from the core, a theme, or a plugin)
- Number of rows
- The time that the query took
Among general debugging, you can use this to find slow-loading queries that are bottle-necking your site’s performance.
Query Monitor will break out queries by your theme and individual plugins so that you can see the impact of each extension.
Suppose a specific plugin is causing lots of slow-loading queries. In that case, you’ll need to find a way to fix that – either by optimizing something in the plugin’s settings or your server’s configuration (e.g. using database or object caching) or by switching to a different plugin that’s more efficient.
In the main tab, you can see all the high-level information for each query.
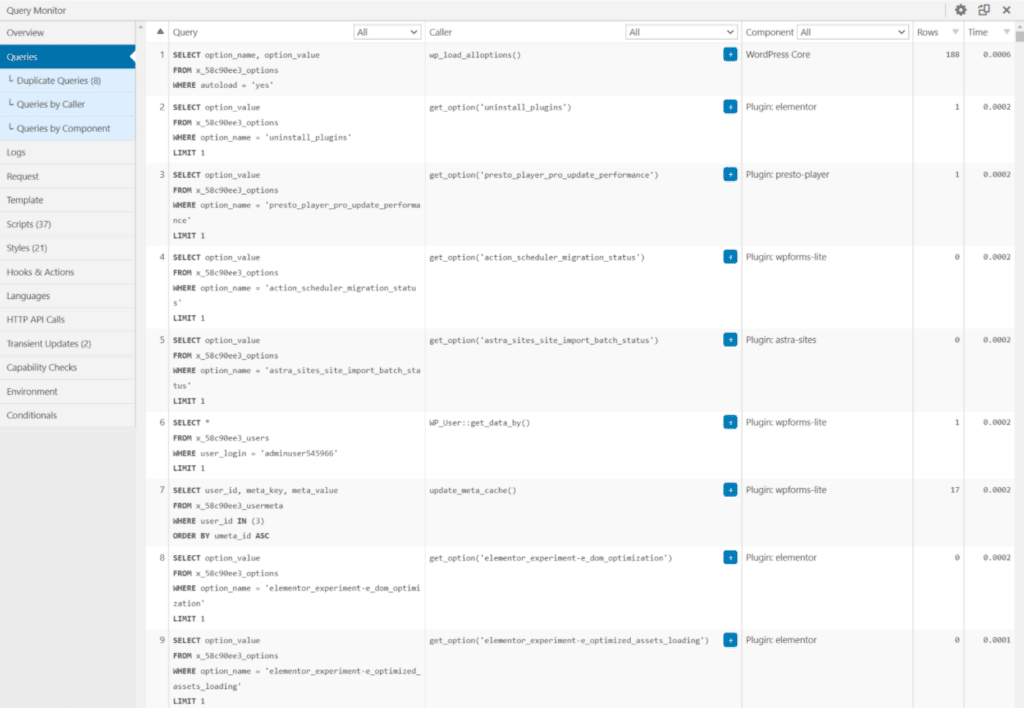
If you want to learn more about a specific query, click the plus icon to expand more detailed information.
If you’re seeing abnormally low numbers here, it could be because of some type of caching – e.g. page caching or a plugin caching its database queries. For that reason, it can be helpful to disable caching while you’re debugging things.
There are also a few sub-menus in this area that help you find specific types of queries:
- Duplicate Queries
- Queries by Caller
- Queries by Component
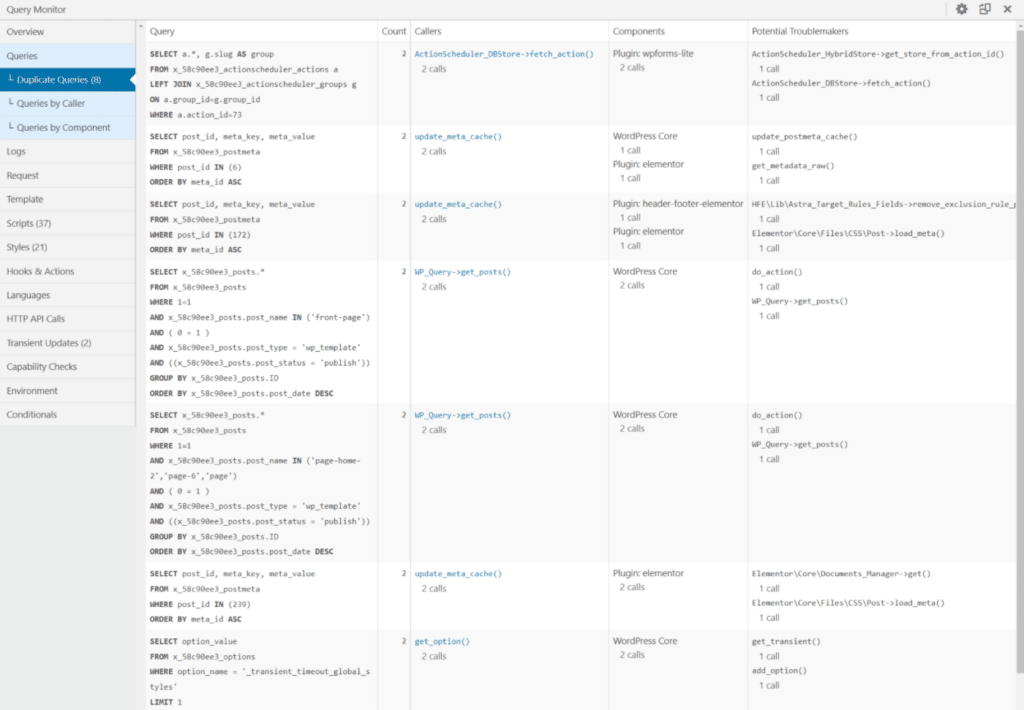
Duplicate Queries
The Duplicate Queries area highlights duplicate queries and list the “potential troublemakers” to help you debug them and streamline things.
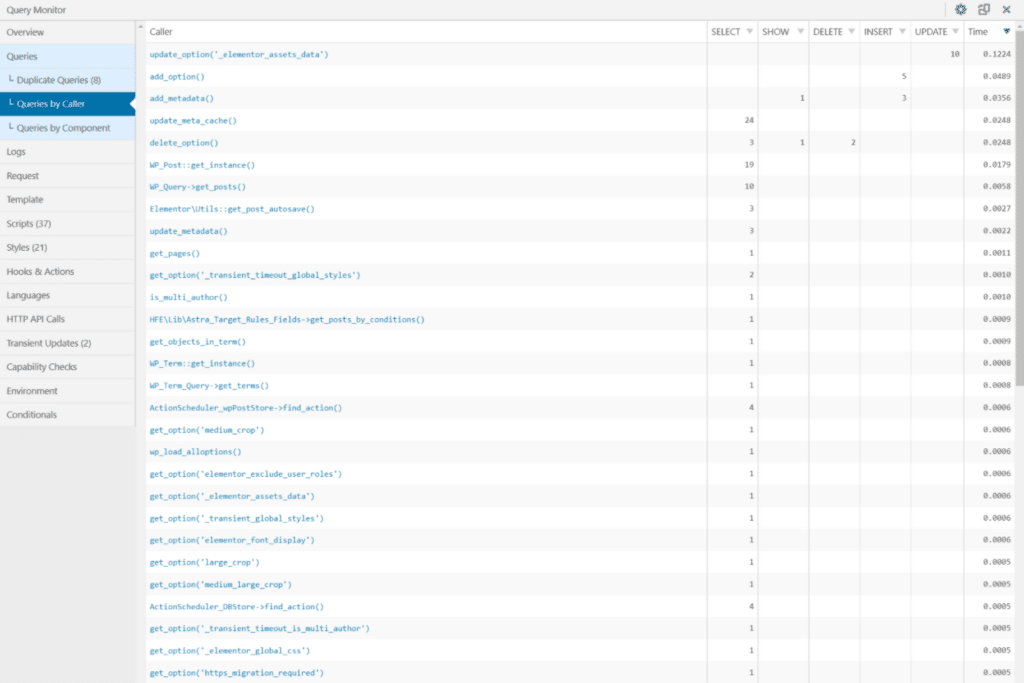
Queries by Caller
The Queries by Caller area lets you view all callers on this page. If you click on one, you can see a list of queries for that caller.
Queries by Component
The Queries by Component area shows a list of all components that made queries, including the WordPress core, your theme, and individual plugins.
You can click on a specific component to view all of its queries.
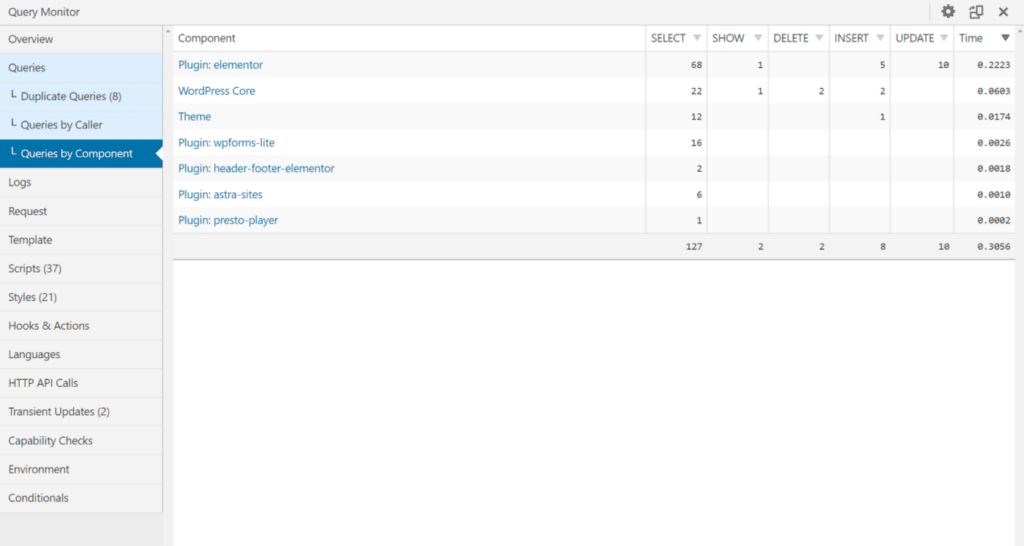
Again, this is one of the most valuable reports because it lets you find specific plugins that degrade your site’s performance with slow queries.
Read This If You Don’t See Queries by Component
If you don’t see the component information in Query Monitor, it’s likely because Query Monitor cannot symlink its db.php file. You’ll see an error message like the one below in these situations.

There are two likely causes here:
- The file permissions of your site’s wp-content folder.
- The wp-content/db.php file already exists (maybe because of a caching plugin like W3 Total Cache).
You can see some fixes and workarounds in this GitHub article. If you feel comfortable connecting to your server via SSH, you can fix the problem with a WP-CLI command (though there are other methods).
Most of Query Monitor’s functionality will still work with this issue, but you won’t be able to see any of the component information until you fix this.
Logs
The Logs tab is an advanced tab that lets you set up your messages and variables to log. This can help you debug technical issues or keep an eye on your site to catch problems.
When you first install Query Monitor, this tab won’t display anything because you won’t have set up any logging variables.
However, if you do want to set up custom logging variables, you can do so using a simple syntax like so:
do_action( 'qm/debug', 'This happened!' );
Query Monitor supports the following actions, which let you log issues at different levels:
- qm/emergency
- qm/alert
- qm/critical
- qm/error
- qm/warning
- qm/notice
- qm/info
- qm/debug
If you’d like to learn more and see some examples, check out the Query Monitor Logging Variables page.
Request
The main Request tab shows the query vars for the current request.
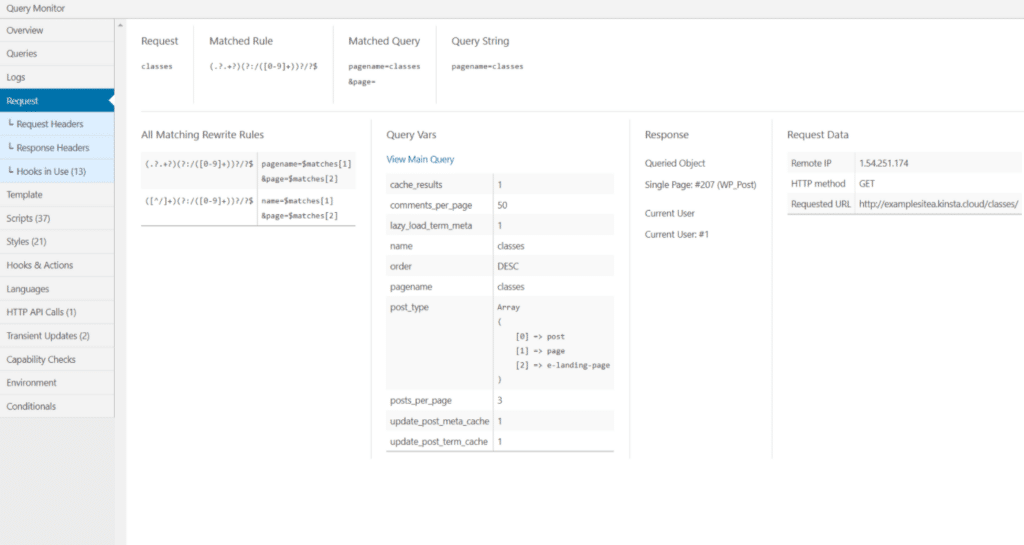
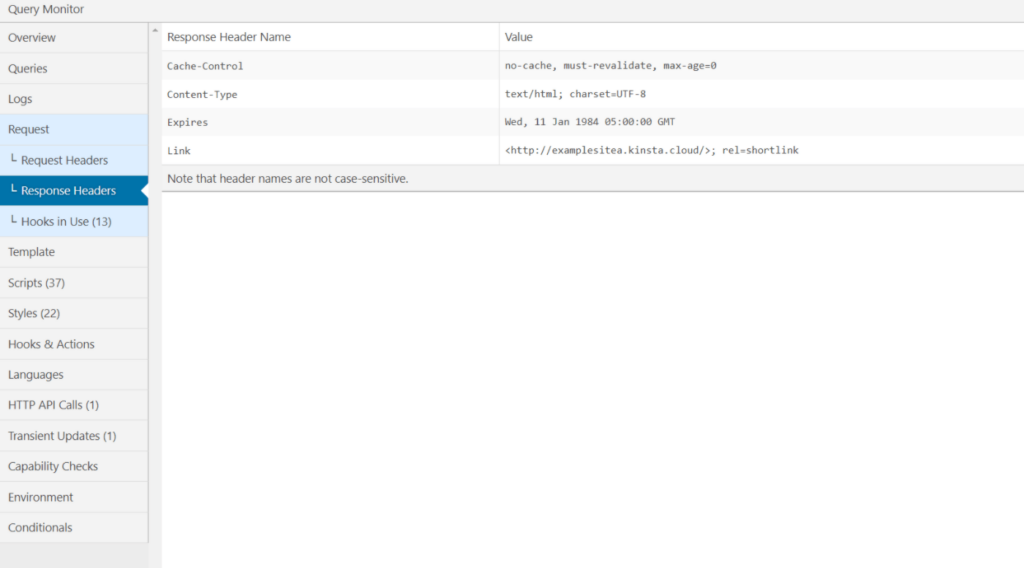
There are also sub-menus to see the Request Headers and Response Headers, which are probably more helpful for performance debugging.
For example, maybe you want to debug caching behavior or CDN behavior. In the Response Headers sub-menu, you can see Cache-Control behavior, letting you debug browser caching on your site.
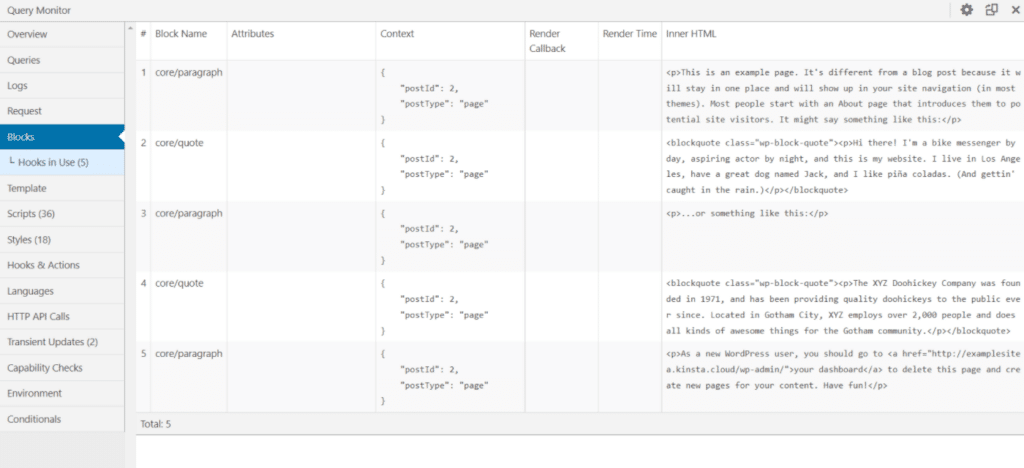
Blocks
The Blocks tab is only visible if you look at a page built with the native WordPress block editor (AKA Gutenberg).
In those situations, this page will list each individual block on the page, along with detailed information about that block.
One smart thing here is that it will tell you if the block came from the WordPress core or a different plugin.
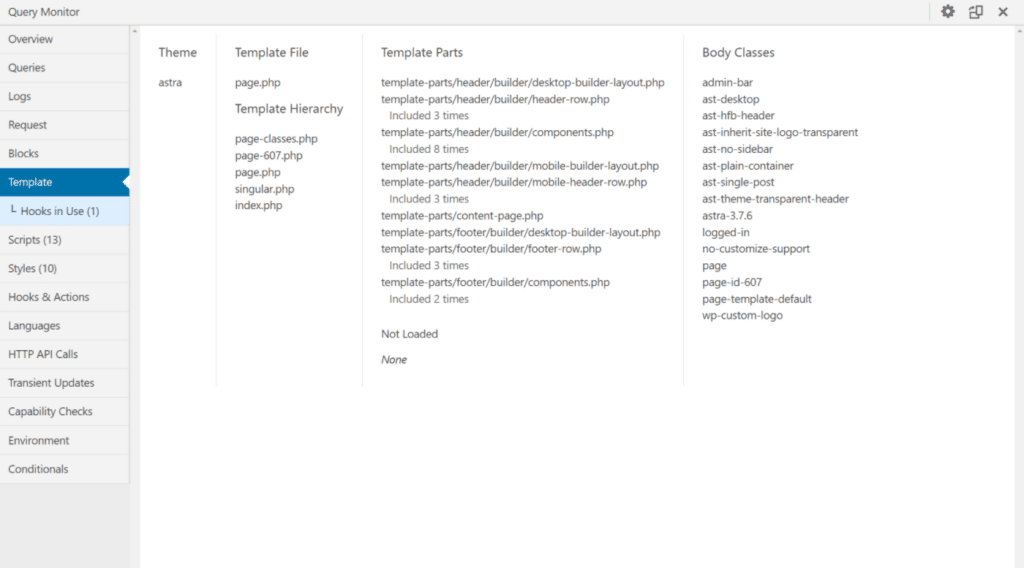
Template
The Template tab will only be visible if you’re using Query Monitor on the frontend of your site. It helps you view and debug the template hierarchy for the page you’re looking at.
You can see the specific template file for that page and the various template parts and body classes.
This doesn’t have anything to do with performance, but it can be beneficial for custom theme development.
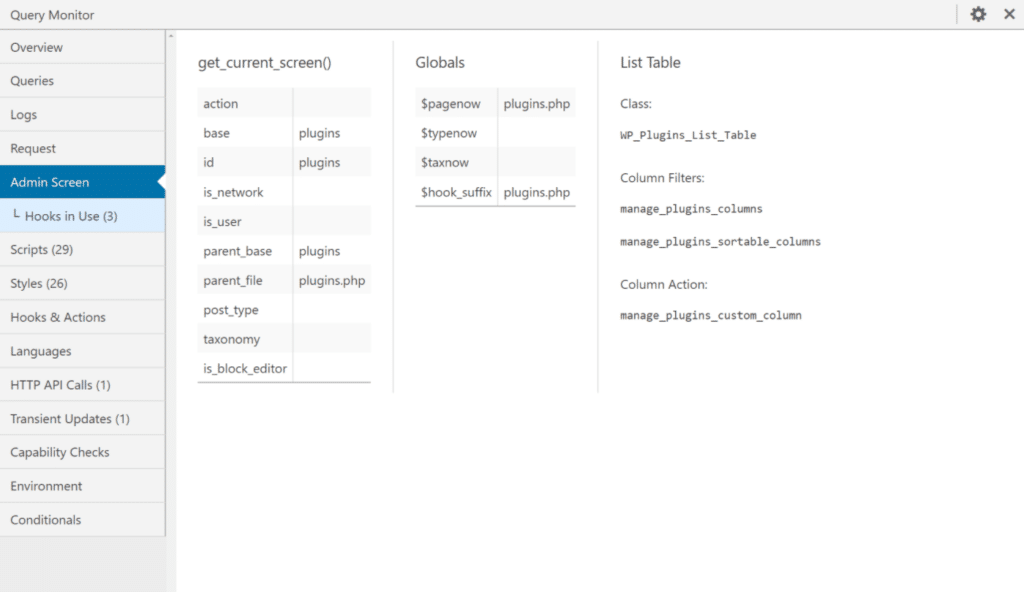
Admin Screen
The Admin Screen tab will only be visible if you use Query Monitor in the WordPress admin dashboard. You probably won’t use it that often, but it can be helpful if you need to debug behavior in a custom admin screen.
If you look at an admin screen with a listing table, it will show you the custom column filters and actions. It will also show you the state of get_current_screen.
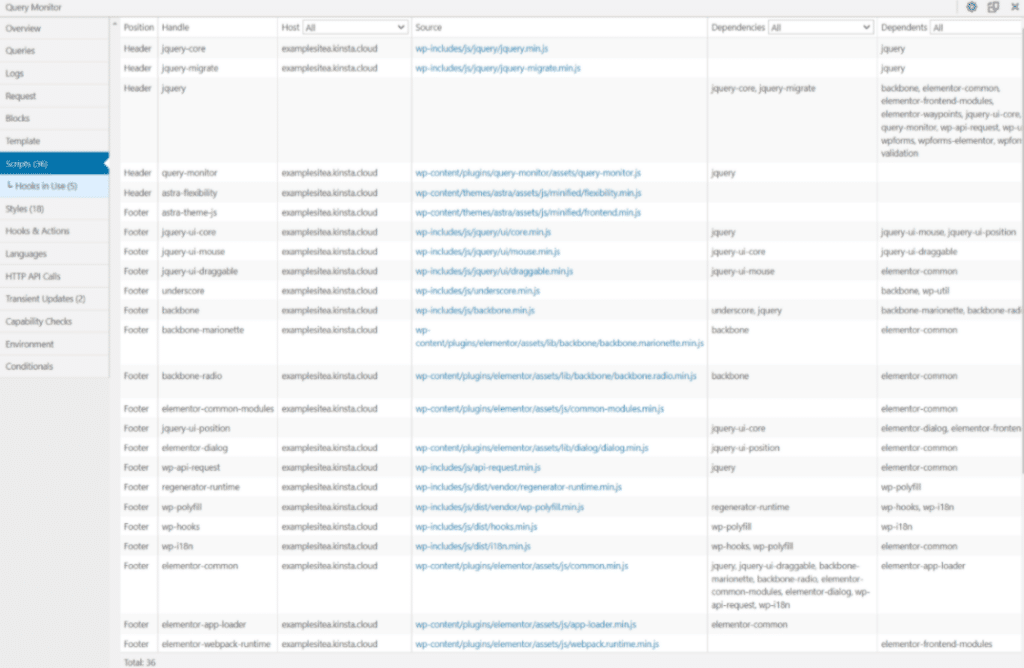
Scripts
After the Queries tab, the Scripts tab is probably the next most helpful performance debugging area in Query Monitor.
This tab displays every enqueued JavaScript script on the page and its dependencies and dependents. You also get filters to quickly find scripts from a specific host or with explicit dependencies/dependents.
As a rough rule, more scripts equal a slower website because they increase the page size and add HTTP requests.
You can use this area to discover the impact of different extensions and find ways to reduce the number of enqueued scripts that load on each page.
Query Monitor doesn’t show you the timing of how all these scripts load, though. If you want to see that, you’ll need to use a speed test tool and dig into the waterfall analysis – Pingdom and GTmetrix are both excellent options.
If you need help using these details to optimize your site’s scripts, we have a lot of valuable guides for optimizing JavaScript on WordPress:
- How to defer JavaScript parsing
- How to eliminate render-blocking JavaScript
- How to make fewer HTTP requests
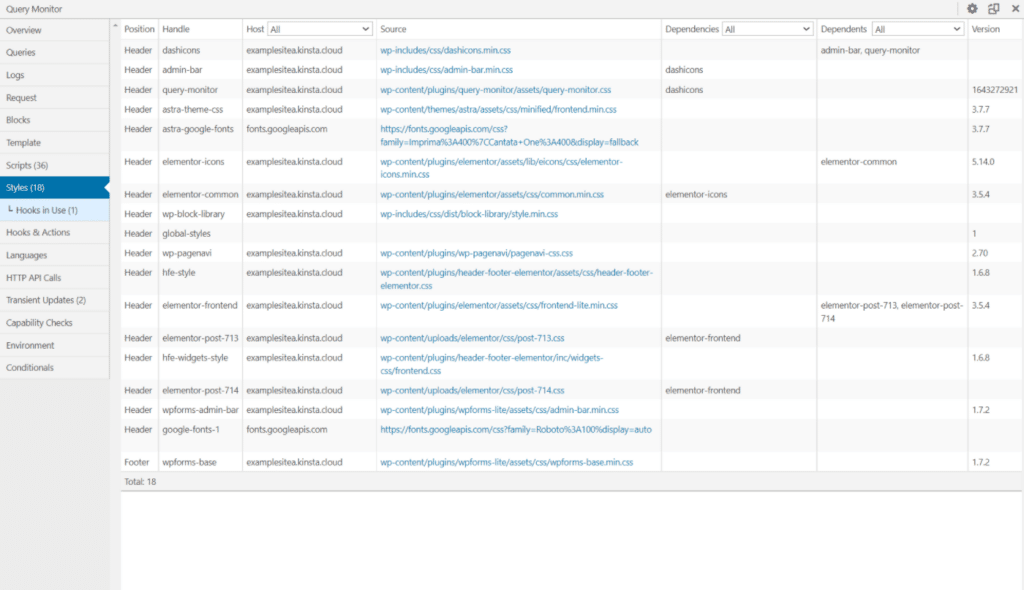
Styles
The Styles tab is like the Scripts tab, but it shows enqueued CSS instead of JavaScript. It’s another handy tab for debugging performance on your site.
Just as with scripts, loading more stylesheets on a page leads to a slower-loading site as a rough rule.
In this area, you can discover the impact of different extensions on your site. You can use this information to reduce the number of stylesheets that need to load on the page, which will reduce the file size and HTTP requests required to load the page.
As with scripts, Query Monitor will not give you an in-depth analysis of how your CSS loads and whether it’s blocking critical parts of your site from loading. For that, you’ll need to use the waterfall analysis again.
We have some helpful posts to help you optimize your site’s CSS:
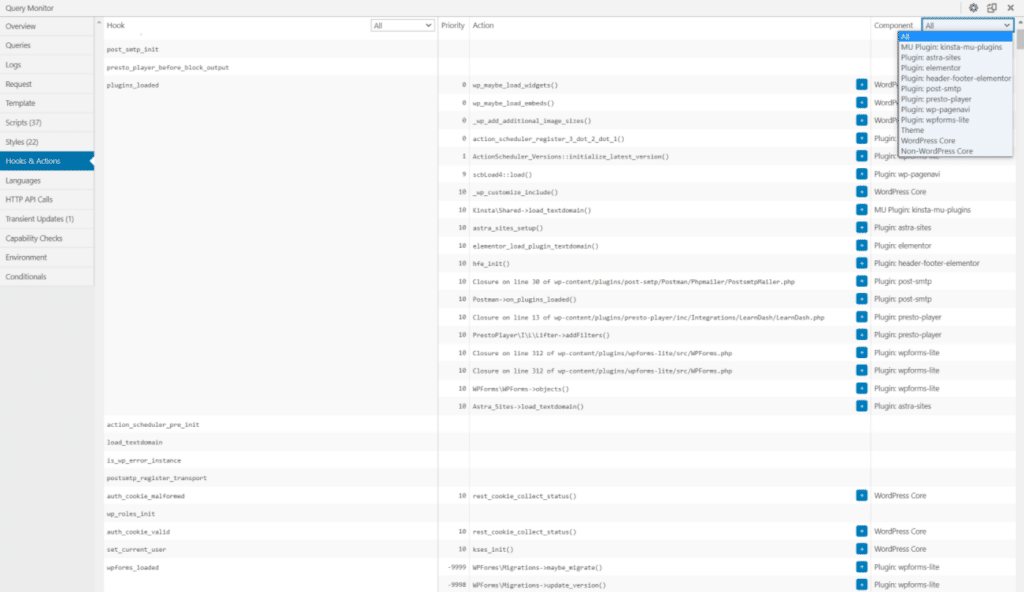
Hooks & Actions
The Hooks & Actions tab lists all of the hooks and actions from the current page, along with their priority.
For actions, you can expand an individual action to see the actual file and line of code associated with that action. You can also filter actions by component to find actions from the WordPress core, plugins, and themes.
This area isn’t really focused on performance, but it is convenient for custom development.
Languages
The Languages tab shows you the language and text domains on your site and the language file used for each extension.
This isn’t very useful if you have a single-language site in English. However, this tab can be helpful if you have a multilingual site and/or your site is in a language that might not have full translation pack coverage.
HTTP API Calls
The HTTP API Calls tab shows you all of the server-side HTTP requests that occurred during the page load, including the request details, timing, and HTTP status code.
If a plugin or theme is making slow HTTP API calls, that can often be a “hidden” cause of poor performance, and you’ll want to find a way to fix this, either by changing something in the extension’s settings or switching to a different extension.
For many pages, you should see “No HTTP API calls,” which is a good sign as it means nothing is getting in the way of your site’s performance.
Capability Checks
The Capability Checks area lets you see which user capabilities can access the current content that you’re looking at. This can be handy to see if different users can access certain frontend or backend content.
This feature is disabled by default for performance reasons, though. If you want to enable it, you’ll need to edit your site’s wp-config.php file and add the following code snippet:
define( 'QM_ENABLE_CAPS_PANEL', true );
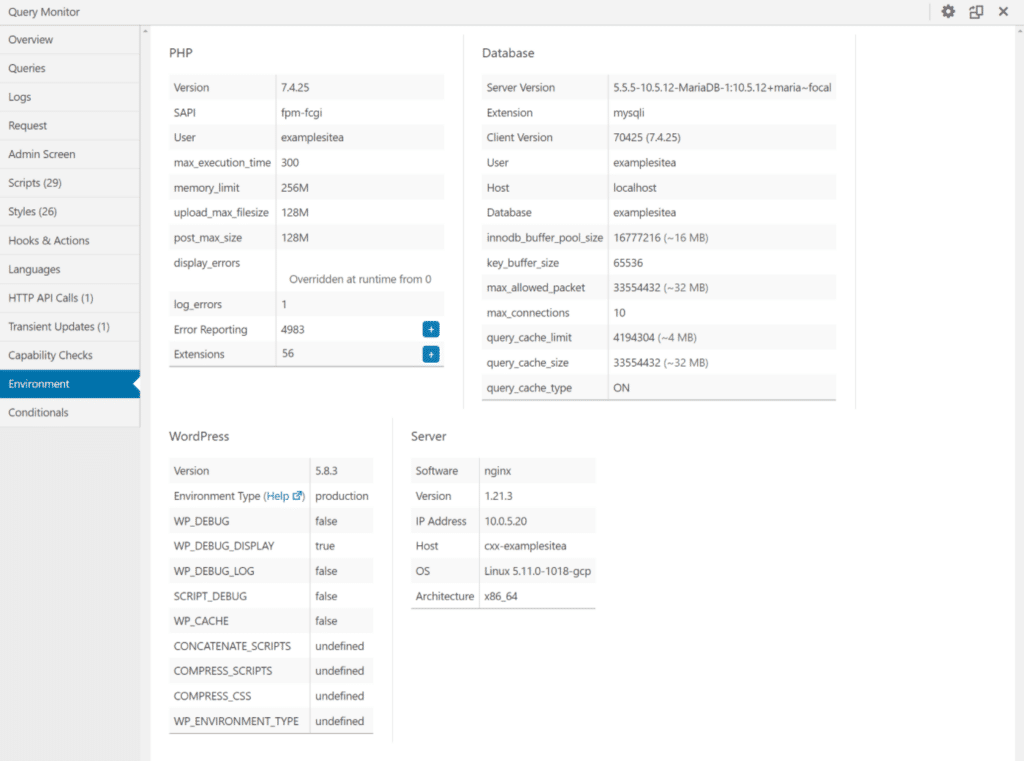
Environment
The Environment tab provides a detailed summary of your site’s environments, including:
- PHP
- Database
- WordPress
- Server
You can see important details, limits, version numbers, configuration settings, etc.
This can also inform important decisions about performance.
For example, if you see that your site’s memory limit is limited, you might want to increase the memory limit to avoid memory limit-related errors.
Similarly, if you see that you’re using an older version of PHP, you might want to upgrade to the latest version for improved performance.
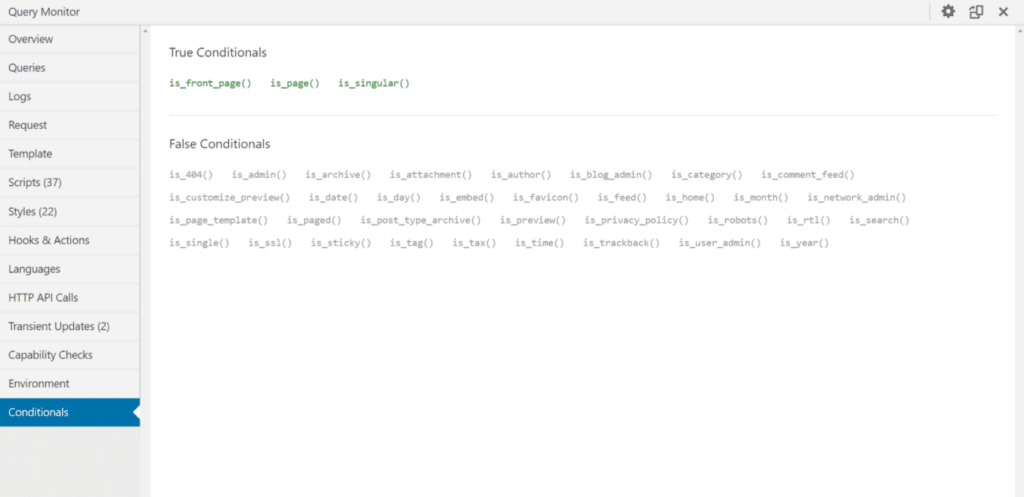
Conditionals
The Conditionals tab helps you see which condition statements apply to the page you’re looking at, which can be helpful in custom development.
You can see both “True” conditionals and “False” conditionals.
How to View Query Monitor Information As a Non-Admin User
You might want to view the Query Monitor information as a different user role or as a logged-out user in some situations. This can be very useful for WooCommerce stores, membership sites, and similar sites.
You need to set an authentication cookie in your browser to accomplish this. Once you’ve set that cookie, you’ll be able to view Query Monitor information whenever you visit the site, even if you’re logged out.
To set the authentication cookie, click on the gear icon in the top-right corner of the Query Monitor panel. Then, click the Set authentication cookie button.
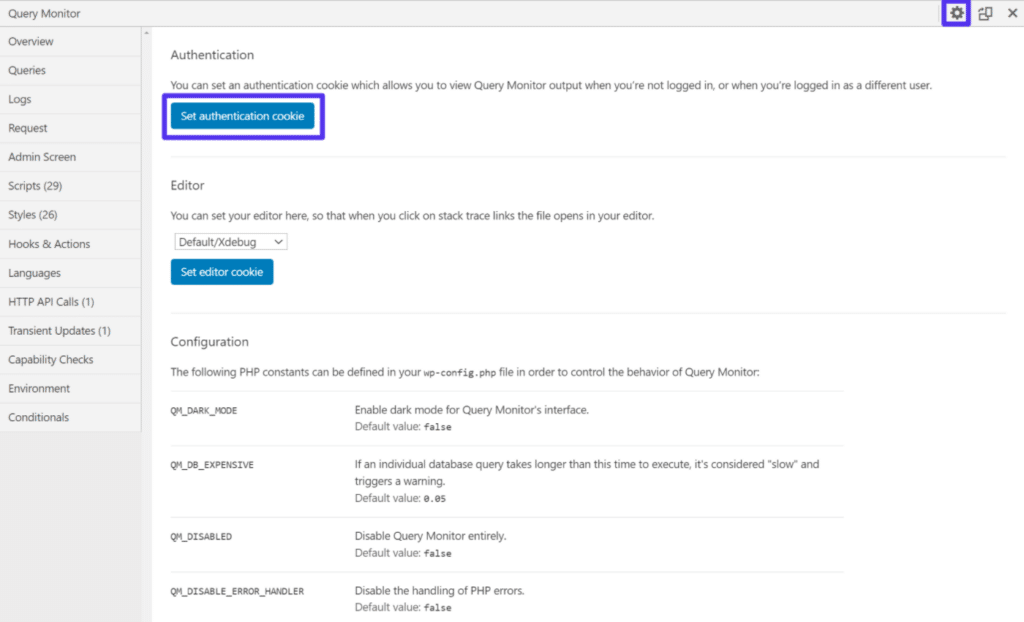
If you ever want to disable this functionality, you can come back to this interface and click the Clear authentication cookie button to remove the cookie.
If you combine this with User Switching, another helpful plugin from the same developer, you can quickly switch between different user roles on your site.
How To Extend Query Monitor With Add-Ons
So far, we’ve focused exclusively on the features and analysis options in the core Query Monitor plugin. However, several third-party add-ons can extend Query Monitor further.
These can add support for specific performance technologies, such as Memcached and Redis, as well as specific WordPress plugins, such as WooCommerce.
Query Monitor also supports all add-ons for the Debug Bar plugin, which adds integrations for ElasticPress, Elementor, Cache Lookup, and lots more.
You can see a complete list of Query Monitor add-ons on this GitHub page.
Other Useful Tools To Debug and Improve WordPress Performance
While Query Monitor is a handy free tool to debug WordPress performance, it doesn’t cover everything. There are some other useful tools you should consider to analyze different areas of WordPress performance.
Kinsta APM (Application Performance Monitoring)
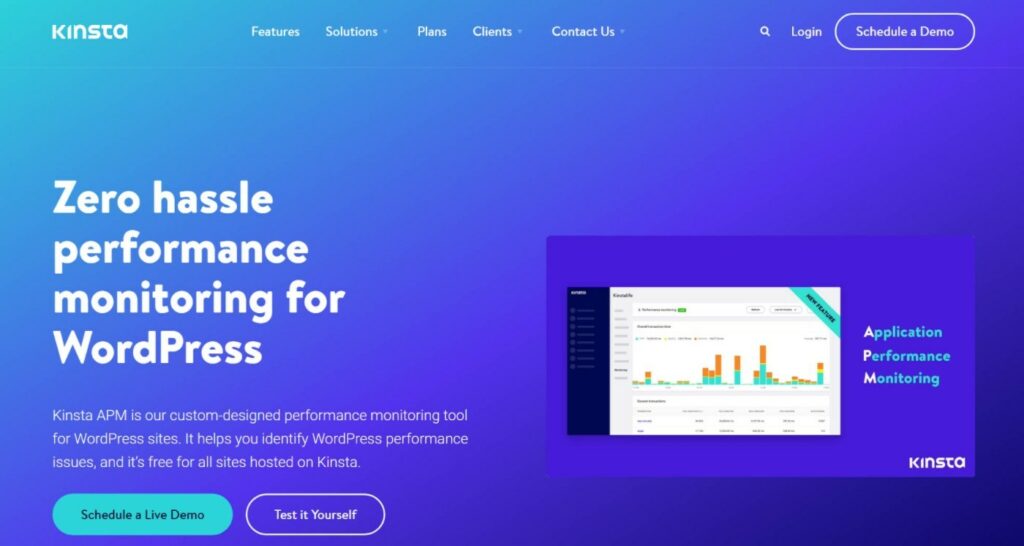
If you host your site at Kinsta, you get free access to Kinsta Application Performance Monitoring (APM).
An APM tool like Kinsta APM goes even deeper than Query Monitor with the following types of analyses:
- Slow PHP processes
- Slow database queries
- Long API calls
- Long external URL requests
- Full-stack traces into problematic areas
You can also view how this information changes over time, which is something Query Monitor can’t do. Plus, you can analyze your entire site rather than go page-by-page.
For a general tutorial, you can follow our Kinsta APM guide.
We also have specific guides on using APM to optimize resource-intensive WordPress sites:
New Relic
New Relic is another helpful performance monitoring tool similar to Kinsta APM.
If you’re not hosting at Kinsta, it can be a great way to access similar types of analyses. Even if you are hosting at Kinsta, you can still enable New Relic tracking if needed, though you need to have your own license.
To learn how to use New Relic, you can follow our New Relic performance tutorial.
A Quality Speed Test Tool
We mentioned this earlier when talking about the waterfall analysis, but a good speed test tool can be invaluable for debugging what your site loads and how your site loads.
To help you use whichever tool you choose, we have a dedicated guide on the proper way to run a speed test. We also have posts focused on some of the most popular tools:
WordPress Debug Mode
WordPress includes its own built-in debug mode to see all PHP errors, notices, and warnings. You also have the option to save these issues to a log file.
For more details, check out our complete guide to WordPress debug mode.
Web Browser Developer Tools
Chrome includes very detailed developer tools that can help you debug your site’s performance, as do some other browsers.
For example, the Network tab lets you view timings for every HTTP request on your site, as well as waterfall analysis. The Performance tab gives you a very detailed performance analysis.
You can also run Lighthouse audits from the Lighthouse tab. It’s the same performance test algorithm that PageSpeed Insights uses.
If you want to learn how to use Chrome Developer Tools to debug performance, this help center hub is a great place to start.
Summary
If you want to debug performance and development issues on your WordPress site, the Query Monitor plugin is one of the best free tools.
To analyze your site’s performance, you’ll probably want to focus the most on these areas of the interface:
- Overview
- Queries
- Logs (for more advanced users)
- Scripts
- Styles
- HTTP API Calls
- Environment
However, the other areas can also be convenient if you develop WordPress sites.
Give Query Monitor a try today and see how it helps. If you don’t want to install it on your live site, you can always create a staging site and install it there to see what’s happening underneath the hood of your site.