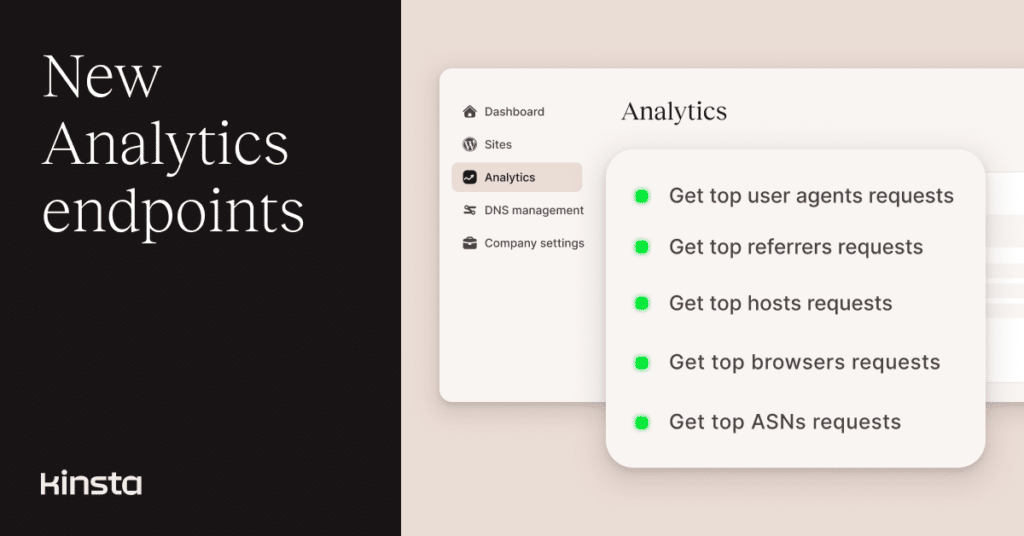
The Kinsta API can now tell you more about the traffic reaching your WordPress environments, including which user agents and browsers are making requests, where those requests were referred from, which hosts they reached, and the networks behind them.
Five new analytics endpoints provide this data programmatically, adding to the countries, cities, client IPs, visits dispersion, and response code data already available through the API.
All five endpoints support the same time controls used by our other analytics endpoints. You can request data for 24_hours, 7_days, 30_days, or 60_days, or use from and to for a custom date range.
See which user agents and browsers are making requests
Two new endpoints provide different views of the software making requests to an environment.
The top user agents endpoint returns the user-agent strings associated with the most requests. This reveals the raw identifier sent by a browser, crawler, command-line tool, or other client.
For example, the following request retrieves the top user agents from the last 30 days:
curl -i -X GET \
  'https://api.kinsta.com/v2/sites/environments/{env_id}/analytics/top-uas?company_id={company_id}&time_span=30_days' \
  -H 'Authorization: Bearer <YOUR_TOKEN_HERE>'
A response looks like this:
{
  "analytics": {
    "analytics_response": {
      "key": "user_agents",
      "data": [
        {
          "name": "Mozilla/5.0",
          "views": "1000"
        }
      ]
    }
  }
}
If you want the browser, rather than the full user-agent string, use the top browsers endpoint instead. Its response groups requests by browsers such as Chrome:
{
  "analytics": {
    "analytics_response": {
      "key": "browsers",
      "data": [
        {
          "name": "Chrome",
          "views": "1000"
        }
      ]
    }
  }
}
You can find the full request and response details in the API documentation.
Find the top referrers sending traffic to your site
The new top referrers endpoint shows which referrers are associated with requests to an environment.
This offers another way to inspect where traffic is coming from without manually pulling the data from MyKinsta or your own logs. For example, you can use it in an internal report that tracks how much referred traffic is coming from a particular domain.
curl -i -X GET \
  'https://api.kinsta.com/v2/sites/environments/{env_id}/analytics/top-referrers?company_id={company_id}&time_span=30_days' \
  -H 'Authorization: Bearer <YOUR_TOKEN_HERE>'
The response includes each referrer and its request count:
{
  "analytics": {
    "analytics_response": {
      "key": "referrers",
      "data": [
        {
          "name": "google.com",
          "views": "1000"
        }
      ]
    }
  }
}
See the top referrers API documentation for all supported parameters.
Check which hosts are receiving requests
For environments that receive traffic through different domains or hostnames, the top hosts endpoint lets you see which hosts account for the most requests.
Here’s an example for the last 30 days:
curl -i -X GET \
  'https://api.kinsta.com/v2/sites/environments/{env_id}/analytics/top-hosts?company_id={company_id}&time_span=30_days' \
  -H 'Authorization: Bearer <YOUR_TOKEN_HERE>'
The response lists each host and the number of requests associated with it:
{
  "analytics": {
    "analytics_response": {
      "key": "hosts",
      "data": [
        {
          "name": "example.com",
          "views": "1000"
        }
      ]
    }
  }
}
You can find more details in the top hosts API documentation.
See which networks requests are coming from
The new top ASNs endpoint groups requests by Autonomous System Number (ASN). An ASN identifies the network responsible for routing a block of IP addresses, so this data can help when you’re investigating where a large amount of traffic originates.
For example:
curl -i -X GET \
  'https://api.kinsta.com/v2/sites/environments/{env_id}/analytics/top-asns?company_id={company_id}&time_span=30_days' \
  -H 'Authorization: Bearer <YOUR_TOKEN_HERE>'
The response lists ASNs alongside their request counts:
{
  "analytics": {
    "analytics_response": {
      "key": "asns",
      "data": [
        {
          "name": "AS12345",
          "views": "1000"
        }
      ]
    }
  }
}
See the top ASNs API documentation for the complete request and response format.
More visitor data through the Kinsta API
These five endpoints expand the visitor data you can retrieve through the Kinsta API, alongside existing analytics for countries, cities, client IPs, and visits dispersion.
Together, they provide more detail about the requests reaching your WordPress environments, including the browsers and user agents behind them, where traffic is referred from, which hosts receive requests, and the networks those requests originate from.
You can use this data in your own dashboards, reports, monitoring tools, or automated workflows. Explore all available endpoints in the Kinsta API documentation.