The Kinsta team is continuing to improve Analytics within the MyKinsta dashboard, including new capabilities to access deeper historical data on your website traffic.
MyKinsta Analytics provides a view of resource usage from the server side (including the servers behind Cloudflare’s CDN and edge caching), unlike the browser-side perspective of analytics tools like Google’s. Because billing for your websites at Kinsta is tied to server-side measurements, we are also working to make that relationship easier to understand and track.
Access 90 days of usage data
We began in November of 2025 to retain the data behind MyKinsta Analytics for a longer period. So, we’ve been counting the days (literally) until we could offer you a full three months of historical numbers for MyKinsta’s reports on website activity.
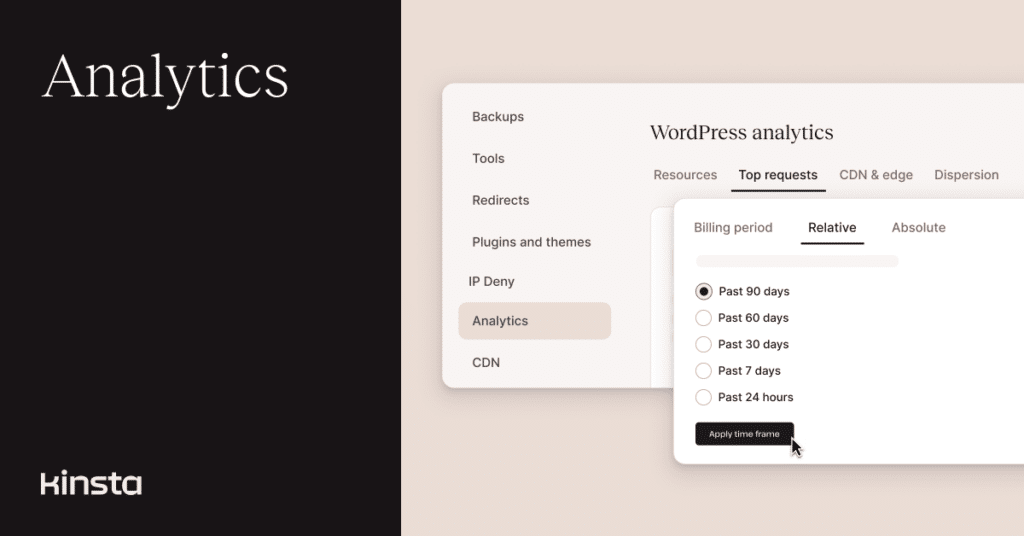
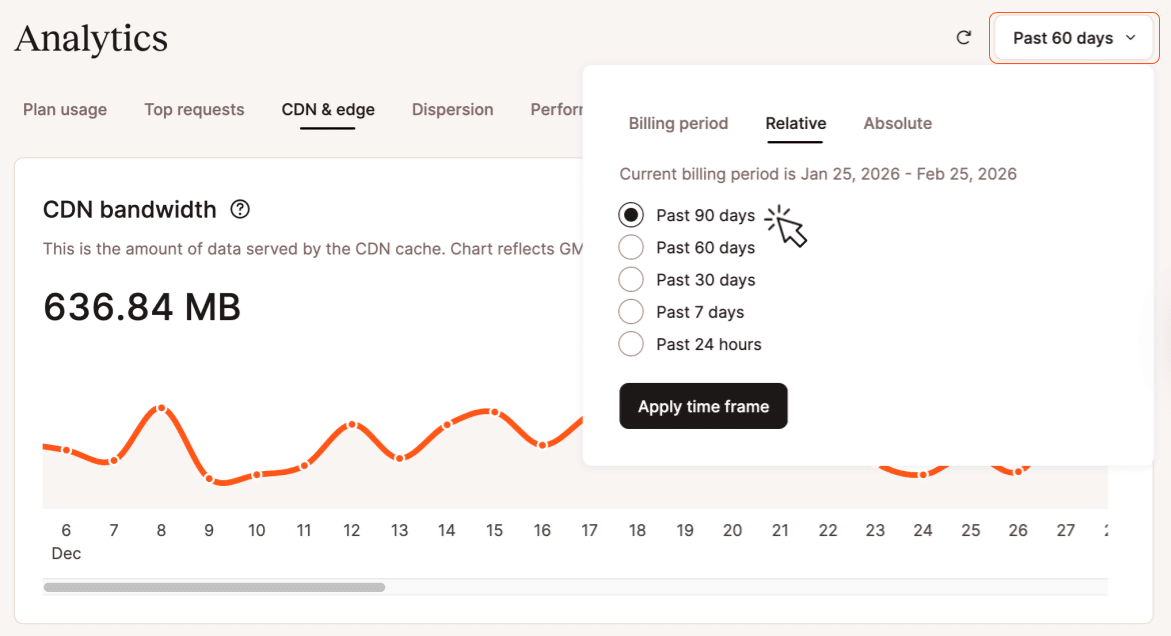
Now, when you navigate to Analytics from a company overview or from a specific WordPress site, you can click on the pop-up date selector in the upper-right and choose Past 90 days from the options under the Relative tab. Likewise, you can navigate back up to 90 days using the calendar-based date-picker under the pop-up’s Absolute tab:
MyKinsta Analytics and billing
You may have noticed that we renamed the Resources tab within Analytics to Plan usage. This highlights the direct impact the data recorded there has on the billable components of your hosting plan.
Whether you have chosen visit-based or bandwidth-based billing, we don’t charge for requests from well-known bot user agents, requests to staging environments, or requests that return certain error codes. Requests served by the CDN or edge cache count under visit-based billing, but not as bandwidth. The data views under the Plan usage allow you to distinguish these components that might be reflected in your plan’s resource limits.
Under the Plan usage tab, the Plan usage overview report shows only the current billing period. Other views under the tab can display data beginning as far back as 90 days:
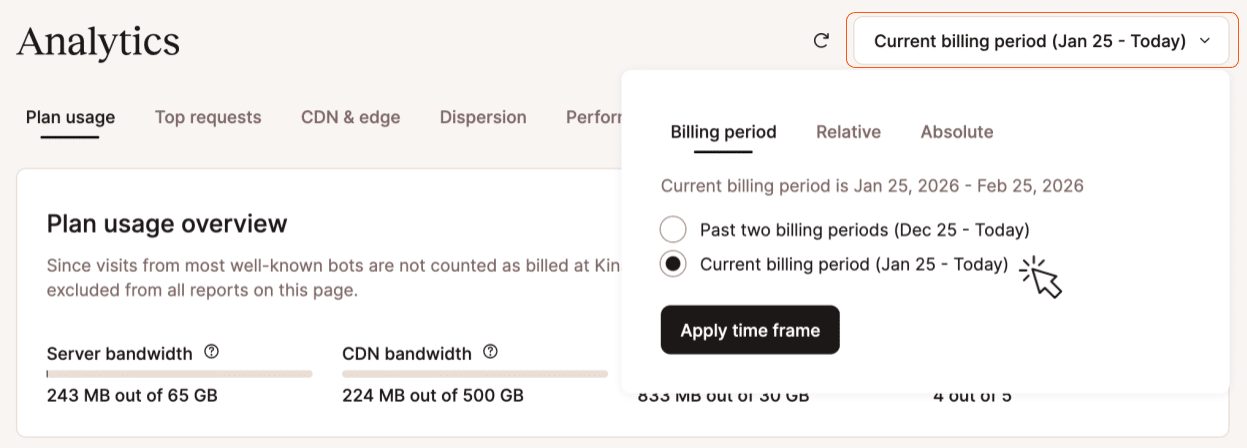
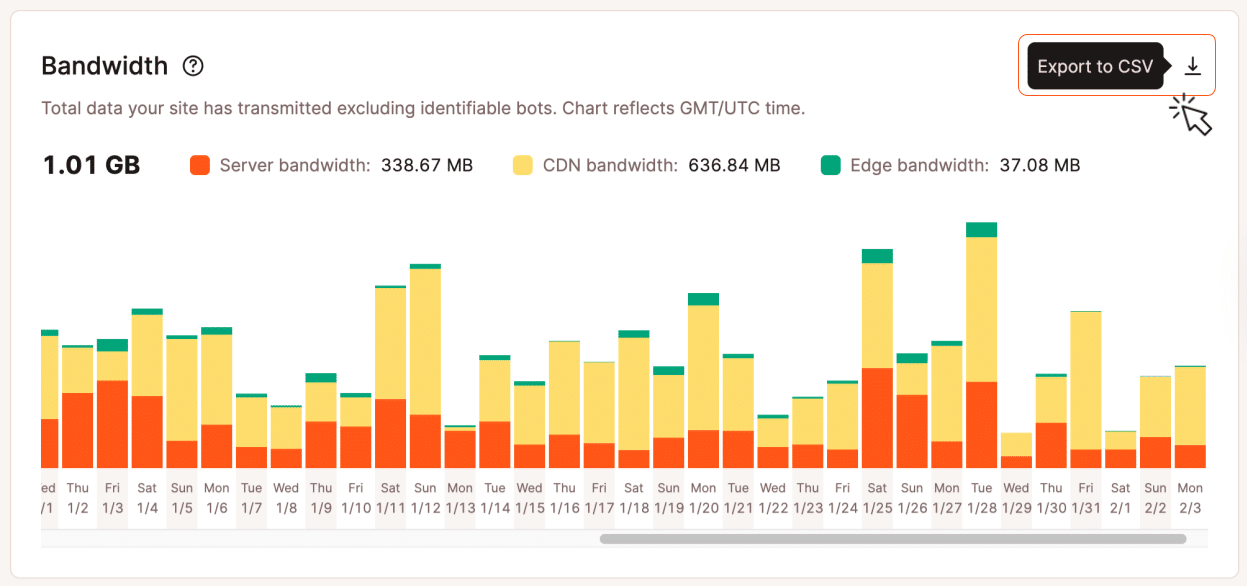
The other views under the Plan usage tab include Visits, Bandwidth, and Disk space. When accessing Analytics from the company-wide overview, the numbers behind those views are a total of all sites included under the plan, and a Plan usage distribution view provides a breakdown showing how each site contributes to those tallies.
Identifying key assets behind resource usage
Updated views under the Top requests tab help you identify the activity doing the most to consume resources on your WordPress sites. These views include traffic from well-known bots that is filtered out of the billing-relevant data under the Plan usage tab.
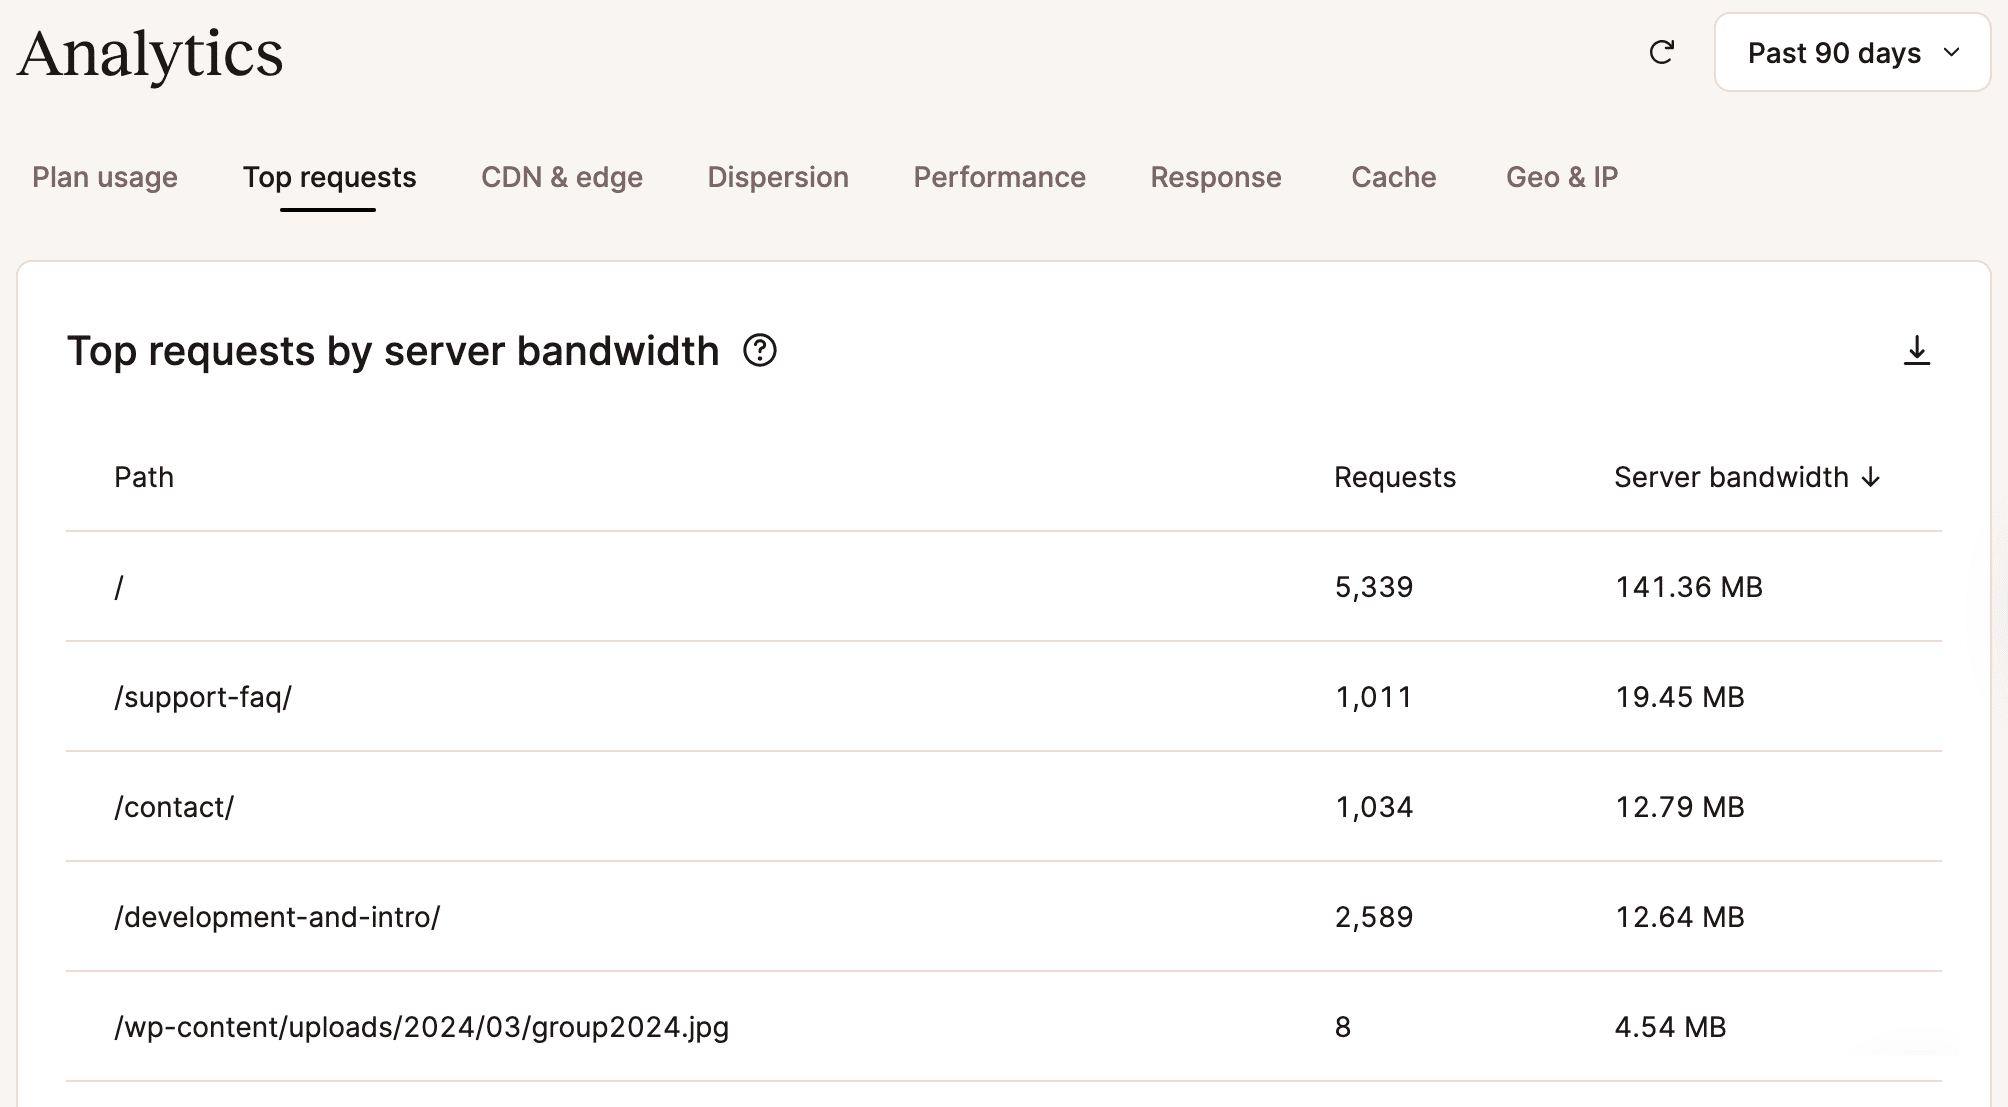
Here, the Top requests by server bandwidth table reports on requests that reach your website and are not served by the Cloudflare CDN or edge cache. The Top requests by total bandwidth table and Top requests by views table offer alternate views of combined activity across Cloudflare and your own servers.
Again, when viewed from a company overview, these tables will aggregate data across all sites in your plan, with individual sites identified. When viewed from the perspective of a single site, a table will look something like this:
Keeping your analytics data even longer
And if 90 days is not long enough for your own analysis of activity on your WordPress sites at Kinsta, you can always download the numbers in CSV format for use in tools like spreadsheets.
Each download will capture the data behind the current view:
Learn more about MyKinsta Analytics
We offer extensive help on MyKinsta Analytics in Kinsta Docs. If you have any other questions, our Support team is just a click away.