For AI traffic, the average website doesn’t exist
New infrastructure data from more than 5,000 WordPress sites shows how differently AI traffic hits each site, and what request volume alone leaves out.
Sample
5,000+ WordPress sites
Window
30 days of request data
source
Kinsta infrastructure
Executive summary
AI traffic is often reduced to a single percentage of web traffic. Our data shows that number can look very different from one website to the next. Across more than 5,000 WordPress sites, AI-crawler activity was low or nonexistent, while a much smaller share saw activity far above the aggregate.
The difference was not only in how much traffic arrived, but also in what it asked the site to serve. AI crawlers were far more likely than human visitors to request dynamic, uncacheable content, making request behavior just as important as volume when assessing the infrastructure impact.
AI is also changing discovery. In a recent Kinsta consumer survey, 44.7% of respondents said they always or most of the time visit a company’s website after receiving an AI recommendation, while 61.1% associate the quality of a company’s website with the quality of its products or services.
As AI takes a larger role in discovery, the website is where people go to check whether the recommendation holds up.
Key findings
01. Bandwidth
1.57%
of bandwidth at the median site went to AI bots, compared with 17.8% at the 90th percentile and 90.3% at the 99th.
02. volume
33-67
AI-bot requests reached the median site per day, while the mean was 14–25 times higher.
03. behavior
77–91%
of AI-bot requests went to dynamic or otherwise uncacheable content, compared with roughly 18-19% of human requests.
04. Consumers
44.7%
of consumers say they always or most of the time visit a company’s website after receiving an AI recommendation.
05. perception
61.1%
of consumers associate the quality of a company’s website with the quality of its products or services.
01. Why a network-scale number breaks down at the level of a single site.
The average is telling the wrong story
It’s no longer news that bots account for more than half of web traffic. Cloudflare’s global data currently puts the split at 57% bots and 43% humans for web page requests. Numbers like this make any site owner wonder how much of their own traffic is still human.
The number is real at the scale Cloudflare measures, and our own data landed close to it. Across the WordPress sites in our sample, a typical day had roughly 54% automated traffic and 46% human traffic.
One typical day on the Kinsta fleet
Share of all requests on a typical day, across Kinsta’s hosted sites

Those numbers work at the network scale but become misleading when applied to a single site. When bots are responsible for more than half of requests across the internet, it’s easy to assume your own site would fall somewhere near the same split.
We made the same calculation across our infrastructure. Then we stopped averaging sites and found that the median site devoted just 1.57% of its bandwidth to AI bots, with more than 1,000 sites reporting none at all.
This finding raised a new question.
A fleet-wide percentage can tell us what’s happening across a network, but can’t tell a site owner what is happening on their site. And even once that site-level number is known, traffic volume still leaves another question unanswered: What are those requests asking the application to do?
Chasing that answer is where our report suddenly changed direction.
02. The aggregate was accurate. The distribution underneath it was not even close to even.
One web, radically different AI-traffic realities
The average becomes harder to defend once you start looking at individual sites.
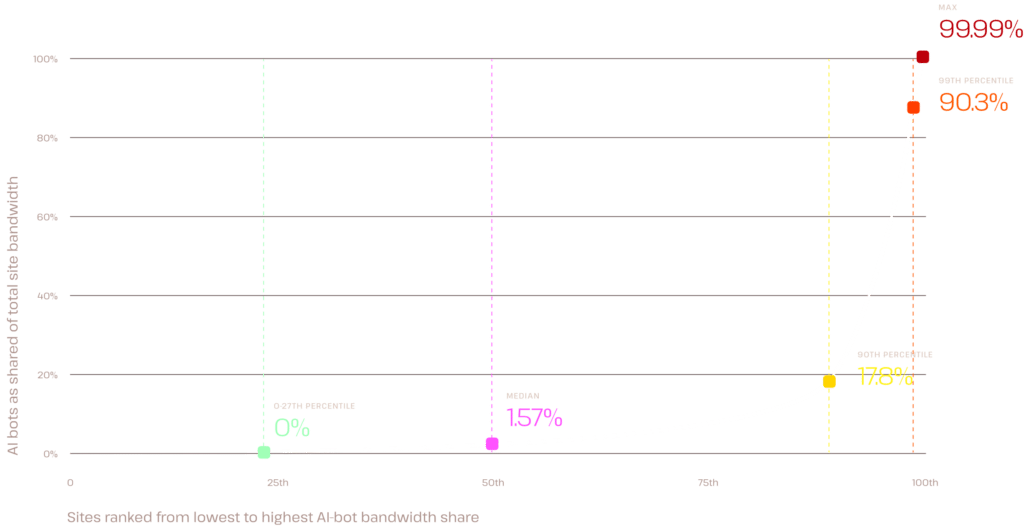
Across the sites in our analysis, AI bots accounted for 6.13% of total bandwidth. The median site saw just 1.57%, while more than 1,000 of the 5,000+ sites measured recorded none. At the other end of the distribution, AI bots accounted for 17.8% of bandwidth at the 90th percentile and 90.3% at the 99th.
Rank the sites from least to most AI traffic and the fleet becomes a staircase. Each step is as wide as the share of sites it covers, and its ceiling is a measured percentile. The vertical scale is logarithmic — on a linear one, half the fleet would be a hairline.
Share of total bandwidth attributable to AI bots across 5,168 WordPress sites, ranked from lowest to highest
6.13%
Fleet aggregate — the one number an average produces
1.57%
Median site — four times lower than the aggregate
57×
How much more bandwidth the 99th-percentile site gave to AI bots than the median
Request counts showed the same lopsided pattern: across four site-level measurements, the mean ranged from 667 to 928 AI-bot requests per site per day, while the median ranged from 33 to 67. Depending on the measurement, roughly 20% to 27% of sites received no AI-bot requests.
This is why “AI bots account for 6% of traffic” tells a site owner almost nothing about their own site. A site receiving almost no AI traffic and one where AI-crawler traffic accounts for most of the activity can both contribute to the same aggregate percentage. Infrastructure decisions therefore need to start with the site itself.
The same applies to the identities behind the traffic. Bot composition changed during the measurement period, with Meta and Amazon responsible for large shares of AI-crawler activity on quieter days, while other crawlers gained share at other times. The mix reaching any particular site or fleet should be measured, not assumed.
First question
How much AI-crawler traffic is actually reaching this site?
Second question
What happens when it gets there?
03. A traffic report counts every request the same way. Servers don’t.
What AI traffic asks the site to do
It’s no longer news that bots account for more than half of web traffic. Cloudflare’s global data currently puts the split at 57% bots and 43% humans for web page requests. Numbers like this make any site owner wonder how much of their own traffic is still human. A traffic report counts every request the same way, even though some are far more work for the server to handle than others.
A request that can be answered from cache and one that requires a fresh, dynamic response both appear as “one request” in a traffic report. So volume tells you how much AI-crawler activity reaches a site, but not what happens when those requests are served.
We first tested whether AI crawlers were transferring more data per request. Across five measurements, they accounted for an average of 6.33% of requests and 6.42% of bandwidth, with the two measures never more than about one percentage point apart.
The larger difference appeared in how those requests were served. When averaged across three measurements, 76.3% of human requests were served from cache, compared with 10.4% of AI-crawler requests. Ordinary cache misses were much closer, at about 3.8% for humans and 4.3% for AI crawlers.
Dynamic traffic accounted for most of the gap. An average of 84.1% of AI-crawler requests went to dynamic content, compared with 18.6% of human requests. The pattern held across all three measurements, with AI-crawler dynamic traffic ranging from 76.9% to 90.5% while human traffic remained between 18.3% and 18.9%. Chasing that answer is where our report suddenly changed direction. The number is real at the scale Cloudflare measures, and our own data landed close to it. Across the WordPress sites in our sample, a typical day had roughly 54% automated traffic and 46% human traffic.
What every 100 requests asked the server to do
Same unit of work, opposite composition. Read the two bars against each other: the shape of human traffic is almost exactly inverted.
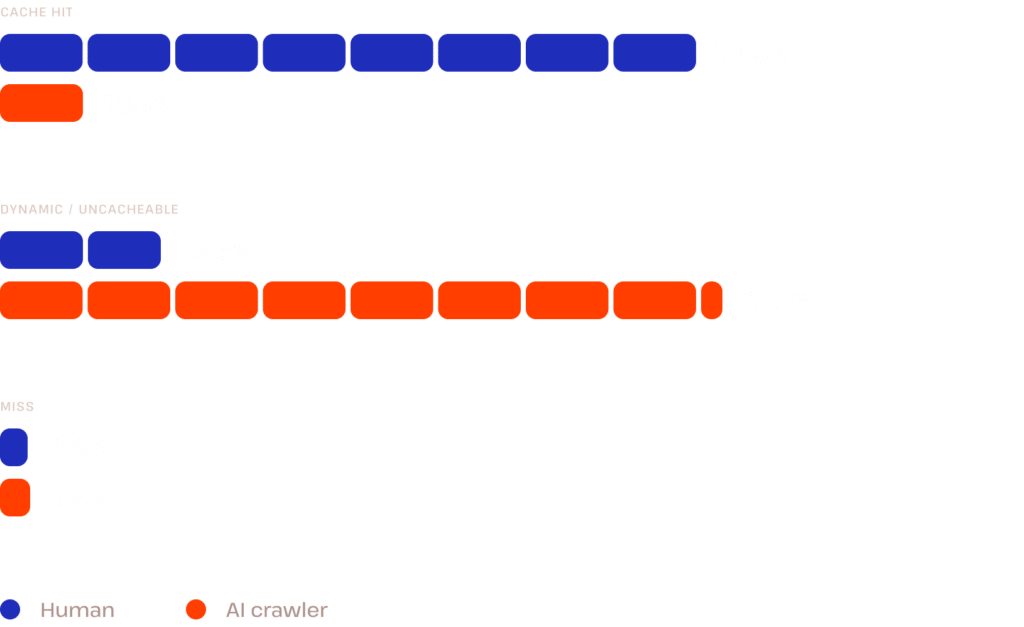
Values are averages across three measured days.
“A request count only tells you how much traffic arrived. What matters for infrastructure is where those requests go and what the site has to do to serve them.”
Daniel Pataki
CTO at Kinsta

For WordPress sites, dynamic content can include search results, filtered listings, query-string variations, shopping actions, and other responses that cannot simply be returned from an existing cached copy. In our earlier AI bot traffic report, we noted that one crawler generated 3.75 million add-to-cart requests in 24 hours, while another looping pattern produced hundreds of millions of requests over a longer period.
This pattern helps explain why traffic volume alone is an incomplete measure of AI activity. Two sites can receive a similar share of AI traffic while placing very different demands on the application, depending on where those requests go.
Not every bot request is a crawler
“AI traffic” is a catch-all for a few different behaviors. Some systems crawl sites broadly, while others retrieve pages for search or in response to a user request. OpenAI, Anthropic, and Perplexity all use separate crawler and user-triggered identities for at least some of these functions.
That distinction matters because the same request count can represent very different behavior. A crawler moving systematically through a site is not the same as an agent fetching a page for someone asking a question, and server logs can identify the system making the request without always revealing the intent behind it.
111.8M
AI-crawler requests over 30 days
8.3M
AI client-agent requests over the same period
We saw this distinction in our own data. Assistant traffic remained relatively small for most of the period, then rose sharply for a short period, with requests associated with Claude-, Perplexity-, and Mistral- growing much faster than ChatGPT traffic.
For operators, the useful lesson is that AI activity is better understood by type and behavior than as one broad “AI bot” category.
04. Server logs only show one side of the journey.
What happens after AI sends someone your way
So far in this report, we’ve looked at the website from the server side, but server logs can only show part of what happens after AI enters the journey.
AI systems increasingly sit between people and the sources they might once have reached directly through search, a recommendation, or a link. Sometimes that detour leads to a visit to the original website; sometimes it doesn’t.
What happens when the person does come through?
44.7%
of respondents said they always or most of the time visit a company’s website after receiving an AI recommendation.
61.1%
said they associate the quality of a company’s website with the quality of its products or services.
That number doesn’t mean 44.7% of website traffic comes from AI; it doesn’t establish a direct referral path in every case; and it doesn’t prove those visitors are more likely to convert than someone arriving from search or another channel.
What it does show is that the company website still matters. People still visit it, even after AI has already told them what to expect there.
These two findings change how we should read infrastructure data. AI systems can access a website before a person ever sees it. The person who eventually arrives may already have a recommendation, summary, or impression formed elsewhere. Their visit can therefore serve a different purpose from the first discovery click that websites have traditionally been designed around.
They may be confirming that the company exists, verifying a claim, reviewing pricing, examining product details, comparing alternatives, or deciding whether the recommendation deserves their trust.
The website still has to perform when that moment arrives.
“AI may change how people reach a website, but at the end of a long chain there’s a human requesting information.”
Daniel Pataki
CTO at Kinsta

For technical teams, reliability and responsiveness become even more crucial parts of the wider business experience. And for marketers and brand owners, AI discovery hasn’t removed the website’s underlying infrastructure from the customer journey.
The two sides meet on the same system.
AI systems request the content.
People judge what awaits them.
With both audiences converging on the same site, understanding your own traffic becomes the practical next step.
04. Position, pattern, profile — three questions to run against your own site.
A site-level AI traffic diagnostic
The findings in this report point to a simple way to evaluate AI traffic for an individual site. Rather than starting with an industry average, look at three things: how much AI traffic you receive, what those requests are doing, and who or what is behind them.
“AI traffic doesn’t call for the same response on every site. The right decision starts with understanding what’s actually reaching your site and whether it is creating a problem.”
Daniel Pataki
CTO at Kinsta

01. Position
How much AI traffic are you actually receiving?
Start with your own baseline over a meaningful period. Look at AI-crawler requests and bandwidth, then compare them with the distribution in this study rather than with the fleet-wide average alone.
In our bandwidth analysis, the median site was at 1.57%, the 90th percentile at 17.8%, and the 99th percentile at 90.3%. On the request side, roughly 20% to 27% of sites received no AI-crawler requests at all on a given measured day.
The purpose is not to assign a permanent percentile to every site, but to establish whether your own AI traffic is relatively limited, typical of the middle of the distribution, or concentrated toward the upper end.
02. Pattern
What are those requests asking the site to do?
You need to look at where AI crawlers go: the paths they request, repeated URL patterns, query parameters, search and filter pages, shopping actions, and other dynamic routes.
Our data showed why this matters. Across three measurements, 76.9% to 90.5% of AI-crawler requests went to dynamic content, compared with roughly 18% to 19% of human requests.
A site receiving a moderate amount of AI traffic mostly against cached pages presents a different infrastructure picture from one receiving the same volume against dynamic routes.
03. profile
Who or what is behind those requests?
Finally, separate the traffic where possible. A crawler moving broadly through a site is different from a user-triggered agent fetching a page for a specific task, and aggressive automation may require a different response from either.
Perfect classification is not the goal. The useful question is whether the source and behavior of the traffic explain what you are seeing and whether anything warrants closer investigation.
Position, pattern, and profile add up to a site-level view that an industry-wide percentage doesn’t reveal. A site with little AI traffic and ordinary request behavior may require no more attention. A site near the upper end of the distribution, with crawlers repeatedly reaching dynamic routes, deserves a closer look.
conclusion
What matters is what happens on your site
AI traffic doesn’t hit every site the same way. A fleet-wide percentage can describe what’s happening across thousands of websites, yet still tell you almost nothing about your own.
The same unevenness applies to what those requests ask the site to do. AI crawlers didn’t use disproportionately more bandwidth in our sample, but they were far more likely than human visitors to request dynamic content. Where those requests go and how the site has to serve them matter just as much as the number of requests.
None of that infrastructure cost would matter if no one visited. But people still do. Many consumers still visit a company’s site after receiving an AI recommendation, and what they find there shapes what they think of the business. The website increasingly sits at both ends of that journey: providing information AI systems can access and an experience people can evaluate for themselves.
For site owners and operators, industry averages are useful context, but the decisions that matter have to start with your own traffic. How much AI activity reaches your site, what are those requests doing, and who or what is behind them? Those are the questions that turn a broad change in the web into something you can actually measure and manage.
the action
Start with your own site
Industry averages can show the scale of AI traffic, but they can’t tell you what is happening on an individual website. Measure how much AI traffic reaches your site, look at where those requests go, and identify the sources behind them where possible. Then decide whether what you find calls for monitoring, optimization, or intervention.
Position
How much is reaching you?
Pattern
What are those requests doing?
Profile
Who or what is behind them?
See what bot traffic looks like on your site

This report was brought to you by Kinsta.
Kinsta is a managed hosting platform for WordPress, serving 230,000+ customers worldwide. Our infrastructure gives us a unique view into how websites are being accessed, served, and changed by the growth of automated traffic.