Managing your resources is crucial for optimizing your site’s performance and stability. A WordPress site has to be able to handle traffic surges, scale resources when the time is right, and detect any performance anomalies quickly.
Of course, applying all of these tasks is necessary, too. The Kinsta API has a few endpoints that can help predict resource scaling and anomaly detection.
For this article, we’ll examine the concepts of predictive resource scaling and anomaly detection and how the Kinsta API fits into your workflow. We’ll discuss some real-world scenarios of this sort of scaling, examine the API’s capabilities, and consider how to integrate these strategies into your workflow.
As our first step, though, we should try to grasp the tasks we’re going to face.
Understanding predictive resource scaling and anomaly detection
We’ll get to what the Kinsta API can help with shortly. Before this, let’s look at what predicting your resource scalability can net you. From there, we’ll also cover the benefits of being able to detect anomalies within your site’s performance.
The benefits of predictive resource scaling
In a nutshell, predictive resource scaling is a way to manage your site’s resources based on the demand you anticipate. It’s a proactive approach that involves analyzing data, poring over usage patterns, and other relevant factors.
Predicting when your site is likely to experience an increase in traffic or resource consumption lets you scale to accommodate the demand. The net result is optimized performance and a better overall user experience (UX).
However, there are lots of benefits to predictive resource scaling that make up the whole:
- Improved site performance. Scaling up your resources can help to prevent performance bottlenecks. In turn, this can ensure your site remains responsive during peak traffic periods.
- Cost optimization. Predictive scaling lets you allocate resources with greater efficiency. As such, you won’t over-provision those resources, and you will reduce unnecessary costs.
- Enhanced user experience. Traffic surges could be mitigated, leading to better UX. Your site will be able to handle those spikes with less strain, giving you a consistent, smooth, and quick front-end experience.
Combining predictive scaling with the ability to detect performance anomalies on your server is a great combination. Next, we’ll discuss the benefits of detecting those inconsistencies.
The importance of anomaly detection
One aspect that often goes hand-in-hand with a scaling strategy is detecting irregularities in your site’s performance metrics. Your stats will have a baseline and extreme outliers when it comes to CPU usage, memory consumption, and response times, which can be a source of trouble and potential optimization.
Detecting these anomalies early lets you address any potential issues before they impact your site’s availability and UX and become a major problem. What’s more, there are many other benefits:
- Proactive issue resolution. If you can detect inconsistencies before they become larger issues, you can take prompt action to resolve them. This can minimize downtime and ensure the continuous availability of your site.
- Improvements to site stability. Anomaly detection lets you identify and address current performance issues. Fixing these can contribute to your site’s overall stability and reliability.
- Optimization insights. By analyzing the anomalies that arise, you can glean valuable insights into areas of your site that may require further optimization.
Both anomaly detection and performance scaling are two sides of the same coin. This means you use the strategies in tandem to create a robust performance base for your site. In the next section, we’ll see how this looks in some typical scenarios.
Real-world scenarios for predictive resource scaling and anomaly detection
The need to boost the server resources at your disposal has a lot of practical uses. It’s fair to say that almost every site will need some form of this strategy in place.
To better understand how you’d use predictive resource scaling and anomaly detection in a real-world setting, let’s go over some. Our first is arguably one of the most popular scenarios.
1. Ecommerce sites during peak seasons
In an ideal world, your ecommerce site will have consistent traffic and engagement all year round. However, in reality, your activity will fluctuate. For instance, consider an ecommerce site that has big traffic spikes during holiday seasons or sale events.

Here, anomaly detection turns into a wider analytical deep dive. You begin with your metrics and look at historical data surrounding your traffic levels. If you can use these metrics to anticipate expected traffic surges, you can begin to think about resources.
The job is to be proactive about resource scaling based on your expected traffic levels at specific points of the year. For example, you might increase CPU and memory allocation to help handle an increased load. On the front end, the shopping experience can be stable and smooth for your customers. In turn, this can not only save you revenue but also bring it in.
2. News and media sites during major events
Sites that deal in time-centric content, such as news outlets also face the same challenges as ecommerce sites. In this instance, those traffic spikes happen when there are major events or breaking news.

The difference is more critical here, though, as the spikes happen more frequently and are also more erratic. Access to relevant content is often crucial, too. Think about weather warnings, for instance.
This is where predictive resource scaling can shine. As with ecommerce, analyzing past traffic patterns during similar events can help you make informed decisions about when to scale and by how much. Monitoring current news trends could also be beneficial. The primary goal here is to ensure your site remains accessible and responsive. While a smooth UX is also important, access without interruption is key.
3. Software as a Service (SaaS) applications with varying usage patterns
SaaS apps can be volatile, with fluctuating usage patterns based on both the customer’s behavior and overall demand for the service. A good example of this is during the outbreak of Covid-19 in March 2020. 16 million knowledge workers had to stay home, and Slack had a 20 percent rise in users during those first two weeks.
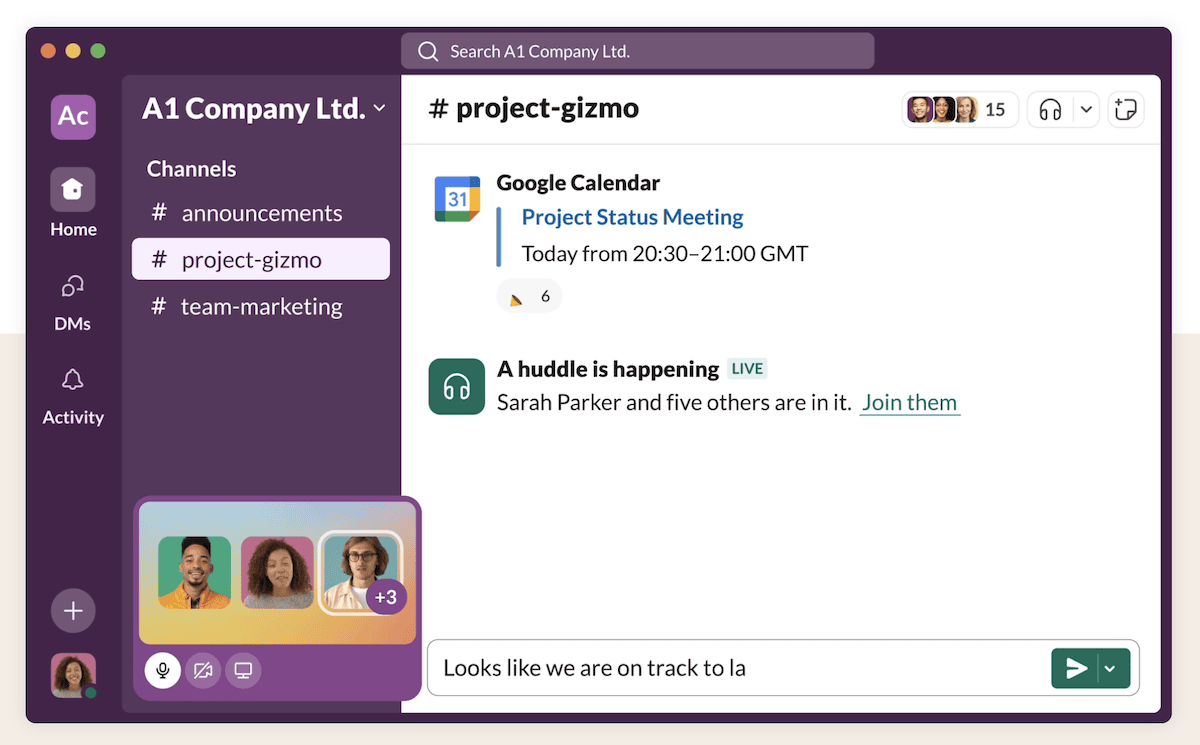
Anomaly detection can help you understand what could go wrong when scaling your resources. This mattered a lot for Slack because it was important to help people keep working during the pandemic.
Predictive resource scaling is vital, too, as it’s one way to optimize your infrastructure to match any usage patterns. Again, reviewing historical data and implementing a proactive scaling strategy can help UX, minimize costs, and build trust and external reputation among your user base.
The Kinsta API’s capabilities for resource management
Having a way to implement resource scaling and detect deviations is just as vital as knowing about the strategies. For Kinsta users, you have the MyKinsta dashboard, which contains a wealth of metrics:
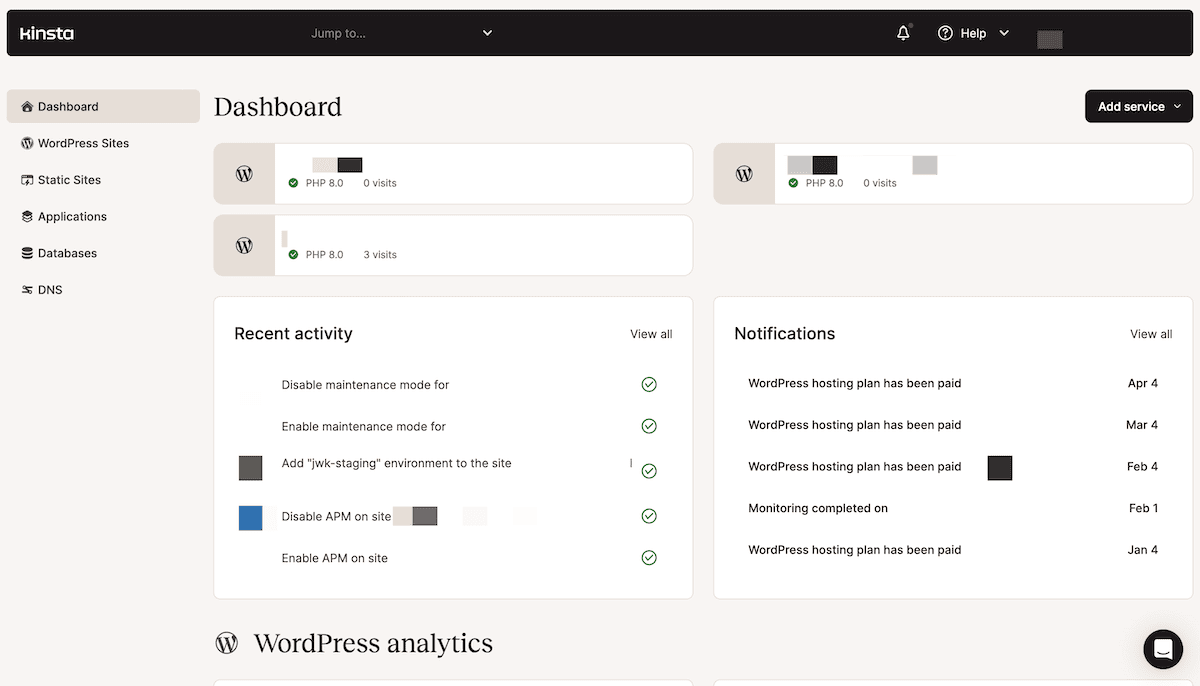
However, this doesn’t help in situations where you need greater flexibility. Instead, the Kinsta API will be the tool for the job. This gives you a number of endpoints to hook into our functionality, of which some will be all-important for scalability and analysis:
CPU Usage.You’re able to monitor your server’s CPU usage over time, which helps you identify trends and potential bottlenecks before they become a problem.Memory Usage.You can track your memory consumption to ensure your site has sufficient resources to handle its workload and boost it when necessary.Bandwidth.Analyzing the total data you transmit can be a good indicator to implement your scaling strategy.Slowest Requests.This is one of many other endpoints that can show you which requests and responses have the greatest impact on your site’s performance.
We’ll look at more of these in detail later on. However, it’s important to understand that the Kinsta API only covers most of the bases of resource scaling and anomaly detection:
- You must predict any future issues. The Kinsta API can only send data your way; you have to interpret it.
- By extension, any scaling you need to implement is your responsibility. The Kinsta API can’t carry this out for you, and this is understandable.
- While the Kinsta API provides many ways to monitor your site, you might not have all the endpoints you need to satisfy your goals (although we’re working on it!).
Regardless, the API has a lot in the box, and its programmatic nature means you can tie it into other systems, implement your own functions and classes, and almost anything else you wish.
Detecting anomalies with the Kinsta API
You won’t employ scaling every day, and you may only decide to pull the trigger a few times a year. As such, let’s look at something you’ll do far more regularly—detect any inconsistencies in your server metrics.
Setting up monitoring and alerts
Your monitoring system will be the backbone of your proactivity. There are a lot of considerations here, but our advice is to keep things simple at first:
- Decide what you want to monitor. You might rely on your own reporting to indicate key metrics or simply look at your MyKinsta dashboard to see what you check on frequently.
- Assess how you’d like to receive alerts. For instance, you could receive Slack notifications or a simple email whenever you reach a threshold.
- Determine a baseline. You should take some time to understand your server’s typical behavior. This is where you look at historical metric data and any future indications or trends.
Once you have this knowledge, you can begin to use the Kinsta API to set up the endpoints you need.
Kinsta API endpoints for detecting anomalies
There are a few endpoints that can be helpful here. We’ve mentioned some earlier in the post, but for completeness, here’s a list we think will fit the bill:
Bandwidth.We’ve already discussed this, in that it’s how you’ll measure the total data you transmit.HTTP Requests Per Minute.This is a simple one: it literally measures how many HTTP requests your site gets every minute!
There are a couple of endpoints that are good for trend analysis:
CPU Usage.Our metric shows the average total CPU usage for a selected time period.Memory Usage.Similarly, this is the average of the total memory consumption for a selected time period.
If you need some guidance on opportunities to scale, there are some endpoints to help:
Build Time.Tracking this shows you how long it takes you to build your app. Combined with metrics on your CPU and memory usage (among others), you can form an opinion on whether you need to scale.Run Time.The total time your application runs can help you decide where to prioritize your usage, find performance bottlenecks, and much more.
Let’s give you an example of using an endpoint for anomaly detection. Here, we’re using Node.js to check the bandwidth of one site. Note that you’d need to implement API key validation – likely using environment variables – and some way of constantly monitoring the bandwidth.
import fetch from 'node-fetch';


const API_TOKEN = <YOUR-API-TOKEN>;
const APPLICATION_ID = <YOUR-COMPANY-ID>;

async function checkBandwidth(token, id, timeframeStart, timeframeEnd, intervalInSeconds) {
  const query = new URLSearchParams({
    interval_in_seconds: intervalInSeconds,
    timeframe_start: timeframeStart,
    timeframe_end: timeframeEnd,
  }).toString();

  const resp = await fetch(`https://api.kinsta.com/v2/applications/${id}/metrics/bandwidth?${query}`, {
    method: 'GET',
    headers: {
      Authorization: 'Bearer <YOUR-API-KEY>',
    },

  });

  const data = await resp.json();

  if (!resp.ok) {
    console.error('Error checking bandwidth:', data);
    return;
  }

  console.log('Bandwidth data:', data);

}


async function run() {
  const timeframeStart = '2021-07-22T18:10:45.511Z';
  const timeframeEnd = '2021-07-22T18:10:45.511Z';
  const intervalInSeconds = '3600';

  await checkBandwidth(API_TOKEN, APPLICATION_ID, timeframeStart, timeframeEnd, intervalInSeconds);
}

run().catch(error => {
  console.error('An error occurred', error);
  process.exit(1);
});
When it comes to notifications, you could set up a Slack channel to start a conversation when your bandwidth reaches a certain limit.
To hunt down any anomalies, you’d want to look over the data you fetch for any outliers—although you could build a programmatic way to search for outlying metrics, too. From there, you can begin to formulate a response.
Responding to anomalies
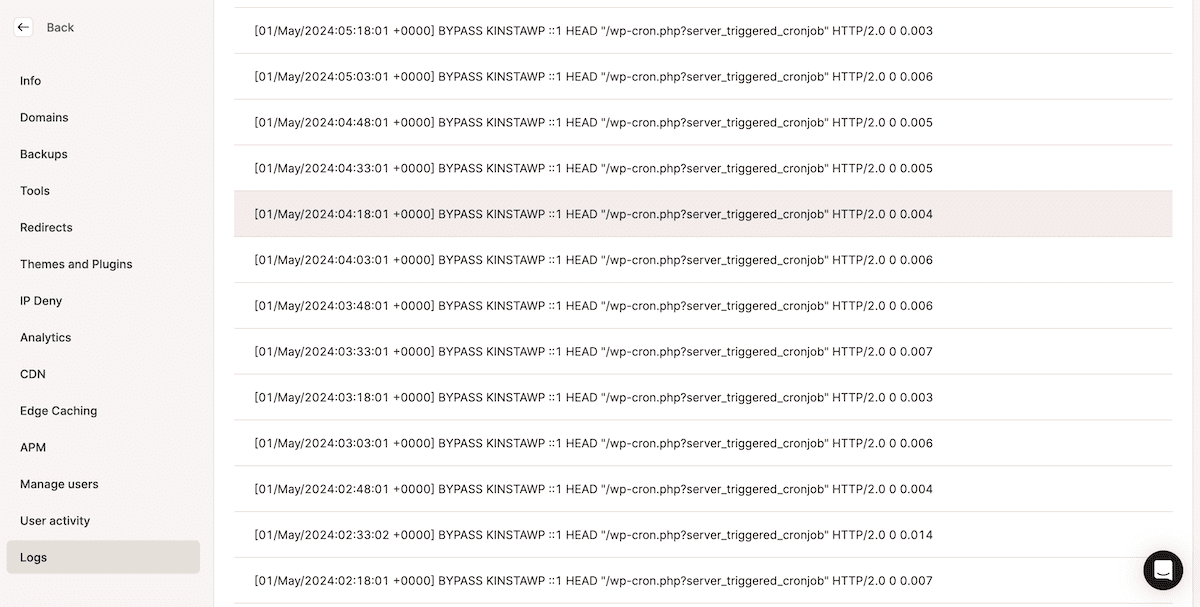
In a nutshell, your script will detect an anomaly, it will ping Slack, and you can then zip into action. How you do this will rely on your response plan. This process will establish how you further investigate, diagnose, and resolve the root cause of the issue.
For instance, you may have a service level agreement in place if this is a client site that demands you respond within a set timeframe. For your own site, you may simply jump into your analytics and look over your logs.
Implementing predictive resource scaling with the Kinsta API
Once you know your baseline metrics, you can look to decide whether you scale your resources or not. As we outlined in an earlier section, automated prediction is something for you to implement. Kinsta’s application hosting offers this for every plan. You can find the option within the MyKinsta dashboard under the Applications tab.
However, the Kinsta API can give you the tools to make your predictions with accuracy and confidence.
There are a few strategies you can take here:
- Notice opportunities to take advantage of scaling up.
- Assess your overall and macro resource consumption.
- Seek out bottlenecks as targets for your resource scaling.
If you look at the bandwidth, HTTP requests per minute, and average response time endpoints, these are great ways to find scaling scope. You’ll notice that checking bandwidth and HTTP requests pulls ‘double duty’ for resource scaling and anomaly detection.
The same endpoints you use for analyzing trends are also great for predicting resource scaling. In fact, CPU usage and memory usage are both telltale signs that you need to up your server power.
Finally, bottlenecks within your page loading processes can ravage your resources and be an ideal target for scaling. The slowest requests endpoint is one to monitor. It flags the worst offenders for your site, and it’s something the MyKinsta dashboard gives you a graph for:
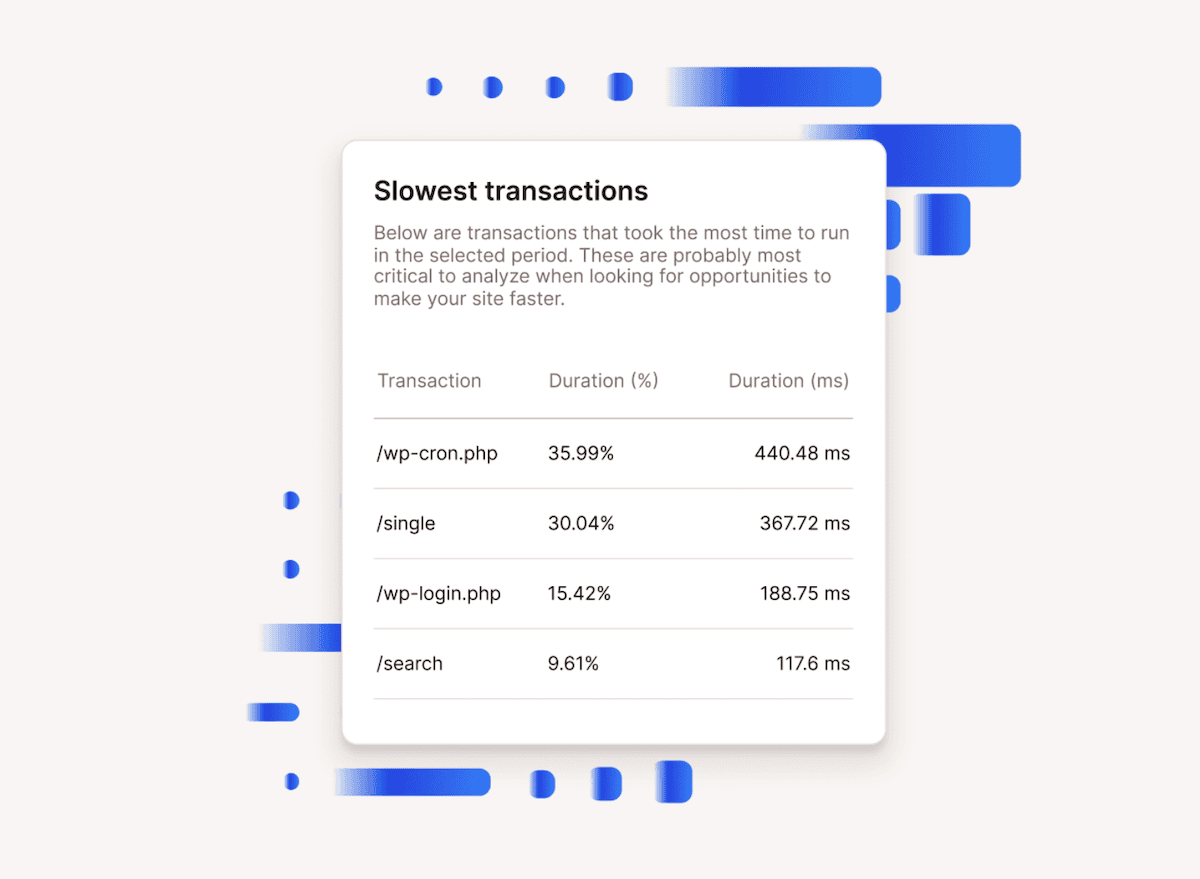
However, this could be a sign of a need to scale upwards and might also highlight a point of optimization. These will be ‘quick wins’ (in theory) along the way because fixing these encapsulated issues should chip away at the amount of resources you allocate to your site and consequently free them up.
Tips and tricks for integrating predictive scaling and anomaly detection into your workflow
Before we wrap up, let’s discuss some tactics, typical practices, and tips to integrate predictive scaling and anomaly detection into your workflow. Proactivity is something we mention a lot throughout this piece, and there are a few ways you can get one step ahead in this area:
- Find some clear baselines and thresholds for your site’s performance to help guide your scaling and detection strategies.
- Make time to review and update your predictive models on a regular basis for accuracy and relevancy.
- Implement automated monitoring where possible, using alerts that the whole team can see. You want to essentially minimize the number of manual interventions you have to make.
On the subject of balancing automatic and manual interventions, there are a few tips we can pass on here, too:
- There needs to be a balance between any automated scaling actions and manual oversight. This is more important than you realize for the right level of control and accountability for your strategy.
- Where you implement automated scaling, there should be clear guidelines and rules about when it should trigger and when it will need manual intervention.
- Review and fine-tune your automation rules regularly. This will help you increase efficiency and minimize false positives in your reporting.
We have one final tip regarding analysis and monitoring. This part of the process involves constantly checking your metrics and reacting to any changes. As such, there are a few ways you can make this easier.
The biggest, in our opinion, is to analyze the outcomes of any decisions you make on a regular basis. This can be key for the next cycle because better insight into how you make decisions will make your next ones more effective.
Summary
Predictive resource scaling and anomaly detection are two top ways to be proactive when it comes to managing your WordPress website’s performance and responsiveness. The Kinsta API can help you implement and build on these techniques programmatically.
For example, many endpoints help you monitor your site’s performance. With the right scripts in place, you can set up baselines and benchmarks. If you couple this with a platform such as Slack, you can have automated alerts that help you spark your response plan into action.
Do you need a strategy for predictive resource monitoring and anomaly detection, and if so, what’s important to you? Let us know in the comments section below!