New Relic APM is a powerful tool that drills down into the inner workings of a WordPress website to pinpoint plugins, theme template files, database queries, external calls, or coding errors causing performance issues on your websites.
At Kinsta, our customers are free to add their own New Relic license so they can enjoy the powerful visibility this tool provides.
If your hosting provider doesn’t offer New Relic integration, you can set it up yourself if your site is hosted in a self-managed private environment.
However, getting New Relic running is just the beginning. If you’ve never used New Relic APM (and maybe even if you have), you may struggle to get the most out of this powerful tool. In this tutorial, we’ll show you how to use New Relic APM to diagnose and fix performance issues on your WordPress site.
Ready to get nerdy? Let’s get to it!
A Quick Overview of New Relic APM
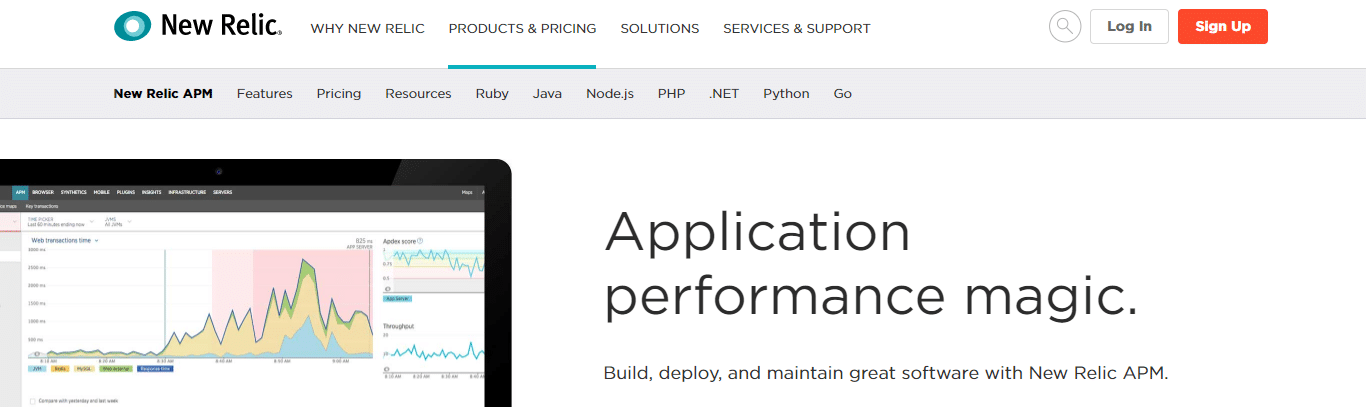
So what is New Relic APM? For our purposes, the following definition fits:
New Relic APM is a web application that provides detailed information about the performance of your WordPress site.
You install New Relic by adding an extension to PHP. That extension listens to every request processed by PHP and then sends that information back to the New Relic dashboard. New Relic then organizes that information into a series of charts and graphs which you can use to diagnose your website’s performance issue. It’s important to note that New Relic isn’t supported on HHVM.
Let’s take a quick tour through New Relic’s primary data visualizations.
Overview
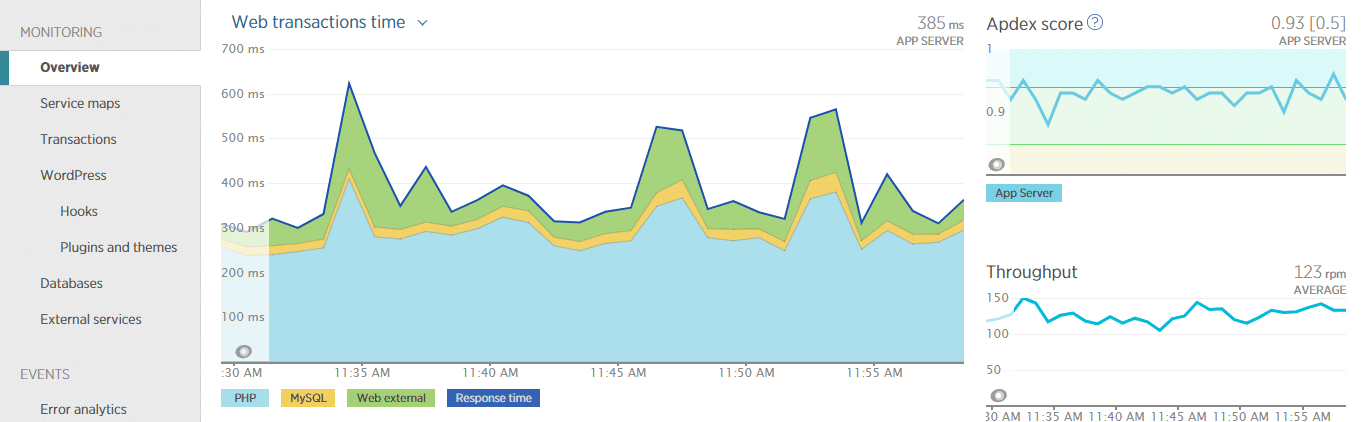
The overview provides a quick snapshot of the overall performance of your website. You won’t diagnose specific issues from this screen, but the handy compilation showing how PHP, MySQL, and external calls are working together can point you in the right direction.
Learn more about the APM overview page.
Transactions
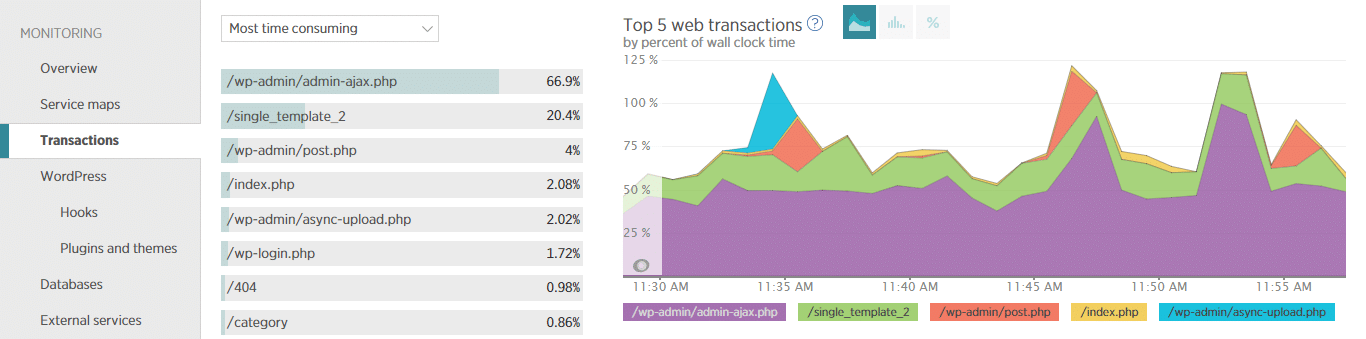
The transactions tab is the most useful tab in New Relic.
Learn to love the transactions tab and you’ll be able to drill down into slow transactions to identify database calls, external resources, or code bottlenecks slowing down your site. Of particular interest within the transactions view is the list of slow transactions. To see the list, scroll down to the bottom of the transactions tab and look in the lower right-hand portion of the page.
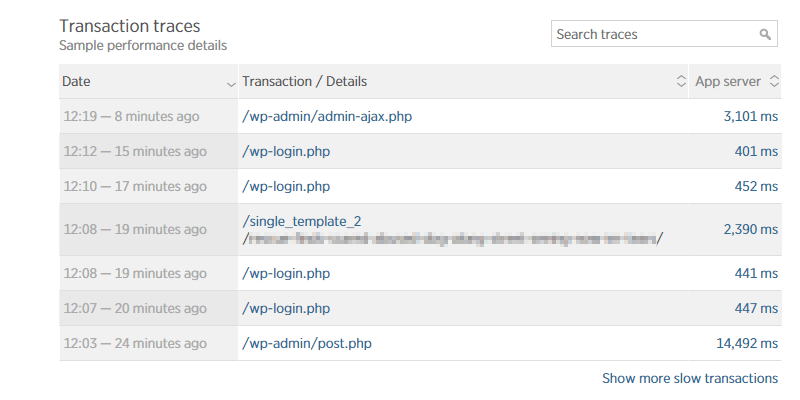
Here you’ll find a list of the slowest transactions captured by New Relic. We won’t spend any more time on this section right now, but a little later we’ll explain how to use this section to diagnose your website’s woes.
Learn more about the New Relic APM transactions page.
WordPress Hooks
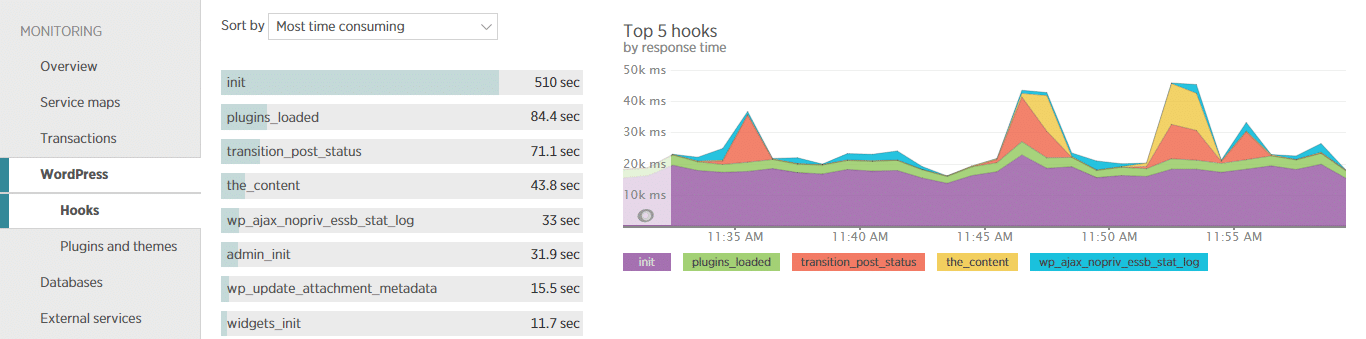
The WordPress hooks tab provides a visualization of the time consumed by all of the PHP functions triggered via WordPress action hooks. This information can be useful to experienced developers who can use the information to work backwards from an overloaded hook to identify the functions that are fired by the hook.
WordPress Plugins and Themes
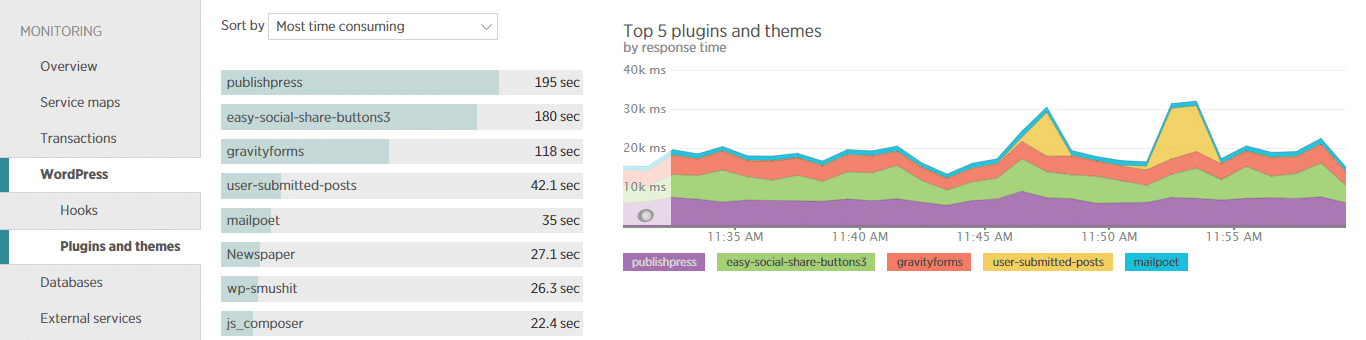
The WordPress plugins and themes tab shows you how much PHP processing time the plugins and active theme are consuming. If a single plugin or your site theme is consuming a dramatically outsized amount of time, this page can help you quickly spot the plugin or theme causing the issue.
A word of caution is in order: The WordPress plugins and themes tab in New Relic is the easiest to misuse.
When investigating a website performance issue it can be tempting to default to checking this tab first and simply deactivating the most time-consuming plugin. However, to do this is to ignore the valuable information found elsewhere in New Relic. It’s akin to treating symptoms rather than digging in and finding the root cause.
Plugins may run slowly due to a misconfiguration issue, such as a membership management plugin running slowly due to the use of an incorrect SMTP port number. Or a plugin might not have been uninstalled correctly. This is the sort of information you could probably derive by drilling into a slow transaction within the transactions tab, and you’ll never fix by simply deactivating the slowest plugin as reported by New Relic.
So get comfortable with this tab, but not to the exclusion of the rest of information provided by New Relic.
Databases
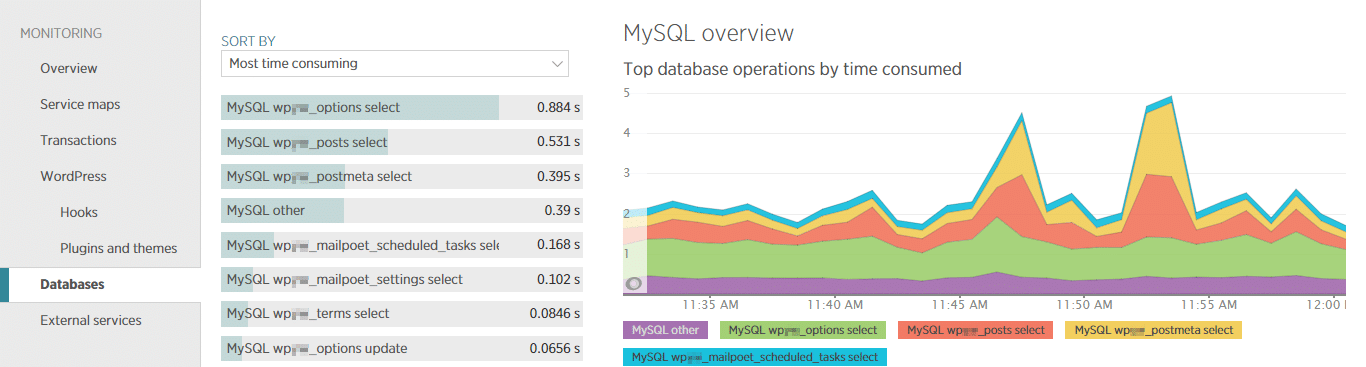
The databases tab lets you identify the database tables and types of queries consuming the most time. New Relic ties this information back to the transactions making those queries. You can use this information to identify database tables which may require optimization and template files which are placing an outsized load on the database.
External Services

Most WordPress websites rely on a number of external services:
- Plugin, theme, and core updates are delivered from the wordpress.org as well as plugin and theme developers.
- Many plugins integrate with third-party APIs, such as WPMU DEV’s Smush image optimization plugin (smushpro.wpmudev.org from the screenshot above).
- Chat plugins are generally powered by external services.
- Many sites are integrated with social media platforms for optimum presentation and performance when content is shared on those networks.
When any one of these external services stops responding in a timely fashion it can bring your entire website to a crashing halt.
The external services tab allows you to quickly see which external services are consuming the most time. You can then use that information to determine if it’s an issue of speed (the service is responding slowly) or quantity (there are too many calls to the external source) and work towards resolving the issue.
Error Analytics
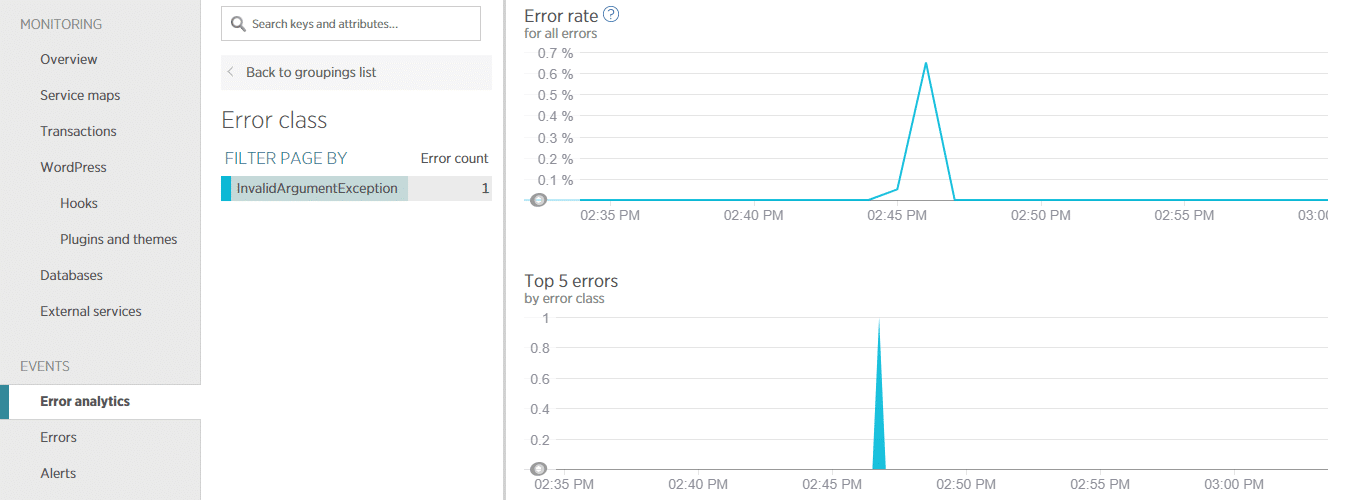
The error analytics tab reports the PHP errors encountered while loading your WordPress site. The errors are grouped into classes, so that you can quickly see how many different types of errors are being generated. The errors are also tied back to the actual transactions that generated the errors. If you select a specific error you can also see a full stack trace for the transaction that generated the error.
Think of error analytics as a better-organized PHP error log. It can prove invaluable when trying to track down the files generating PHP errors and the transactions where those errors occur.
Debugging Slow-Loading Pages
The most common issue our team uses New Relic to debug is the case of a specific page or process that is taking an exceptionally long time to load. When this happens, the Transactions tab in New Relic APM is almost certainly the first place to head.
The process you will need to follow to diagnose a slow-loading page is pretty straightforward:
- Duplicate the slow transaction.
- Find the transaction in the list of slow transactions in New Relic.
- Review the transaction summary and trace details to determine the cause of the slow performance.
Let’s look at an example of this and how New Relic can be used to diagnose the issue.
Step 1: Duplicate the Transaction
Let’s look at an example. In this example, our client is seeing slow-loading every time an individual blog post is loaded. All other pages load normally, but individual posts take several seconds to load.
So the first step is to duplicate the issue. In this case, that means visiting a single blog post a few times to ensure New Relic captures the necessary date.
Note: If your site makes use of page caching, which is built-into our platform here at Kinsta, you’ll need to clear the cache between each page load. Otherwise, you’ll end up loading the page from cache rather than having WordPress generate the page.
Step 2: Find the Slow Transaction
Once you’ve duplicated the slow transaction a couple of times, head to New Relic and select the Transactions tab. Then scroll down until you see the list of slow transactions in the lower right-hand portion of the New Relic dashboard.
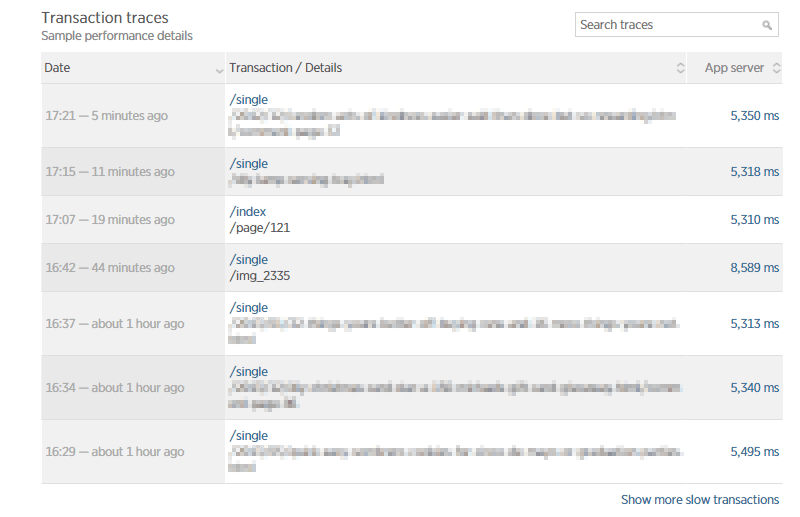
Click on the transaction you are debugging to see details.
Step 3: Review Transaction Summary and Trace Details
Once you select the transaction, a summary of the transaction will be displayed.
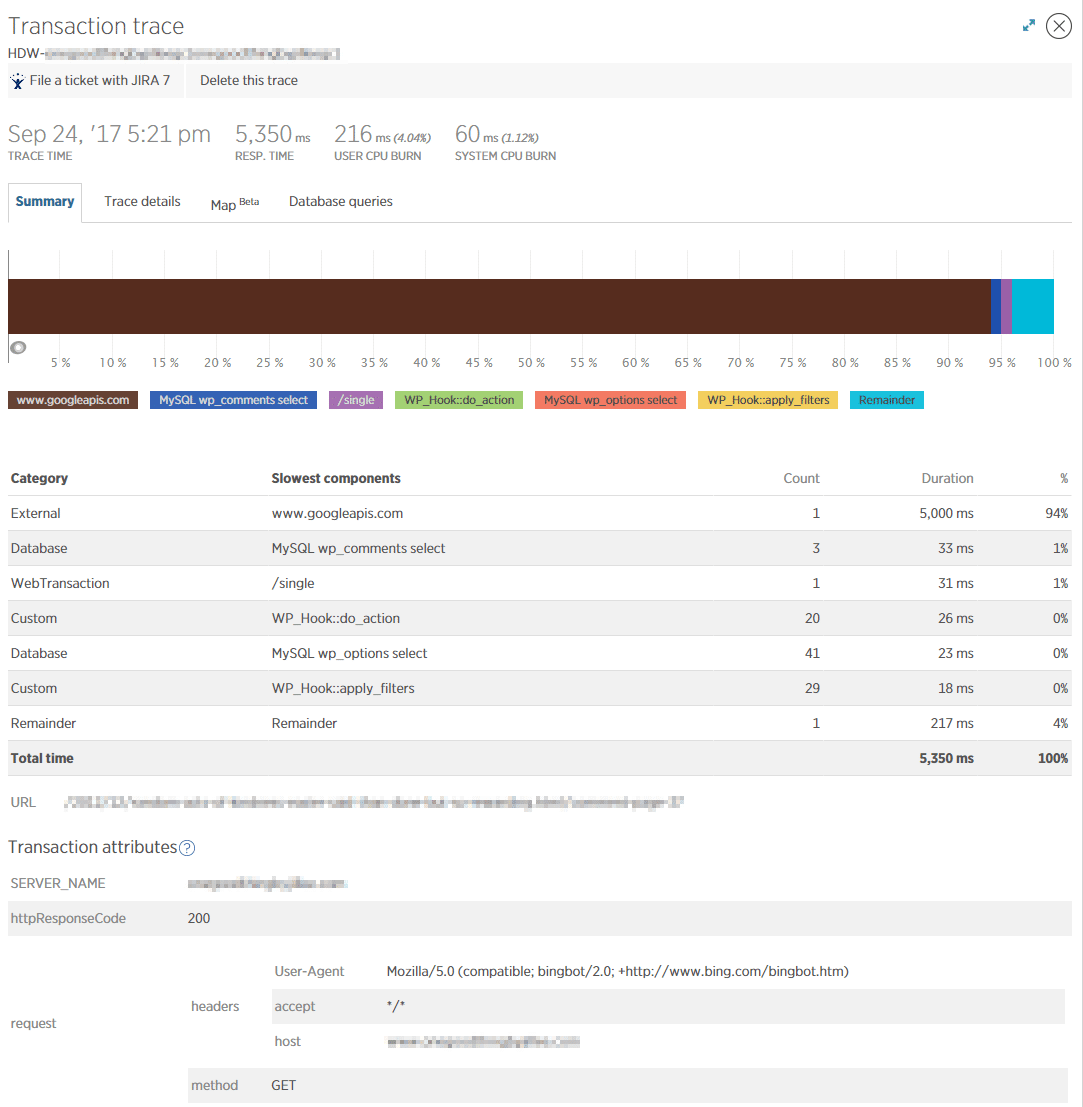
The summary lets you see a snapshot overview of the components that contributed to the processing time of the transaction. In the case of our example transaction, a call to an external resource, www.googleapis.com, is responsible for 5,000 milliseconds of a transaction that took a total of 5,350 milliseconds to complete.
While this is useful information, the trace details tab will provide the details we need to see exactly what is happening.
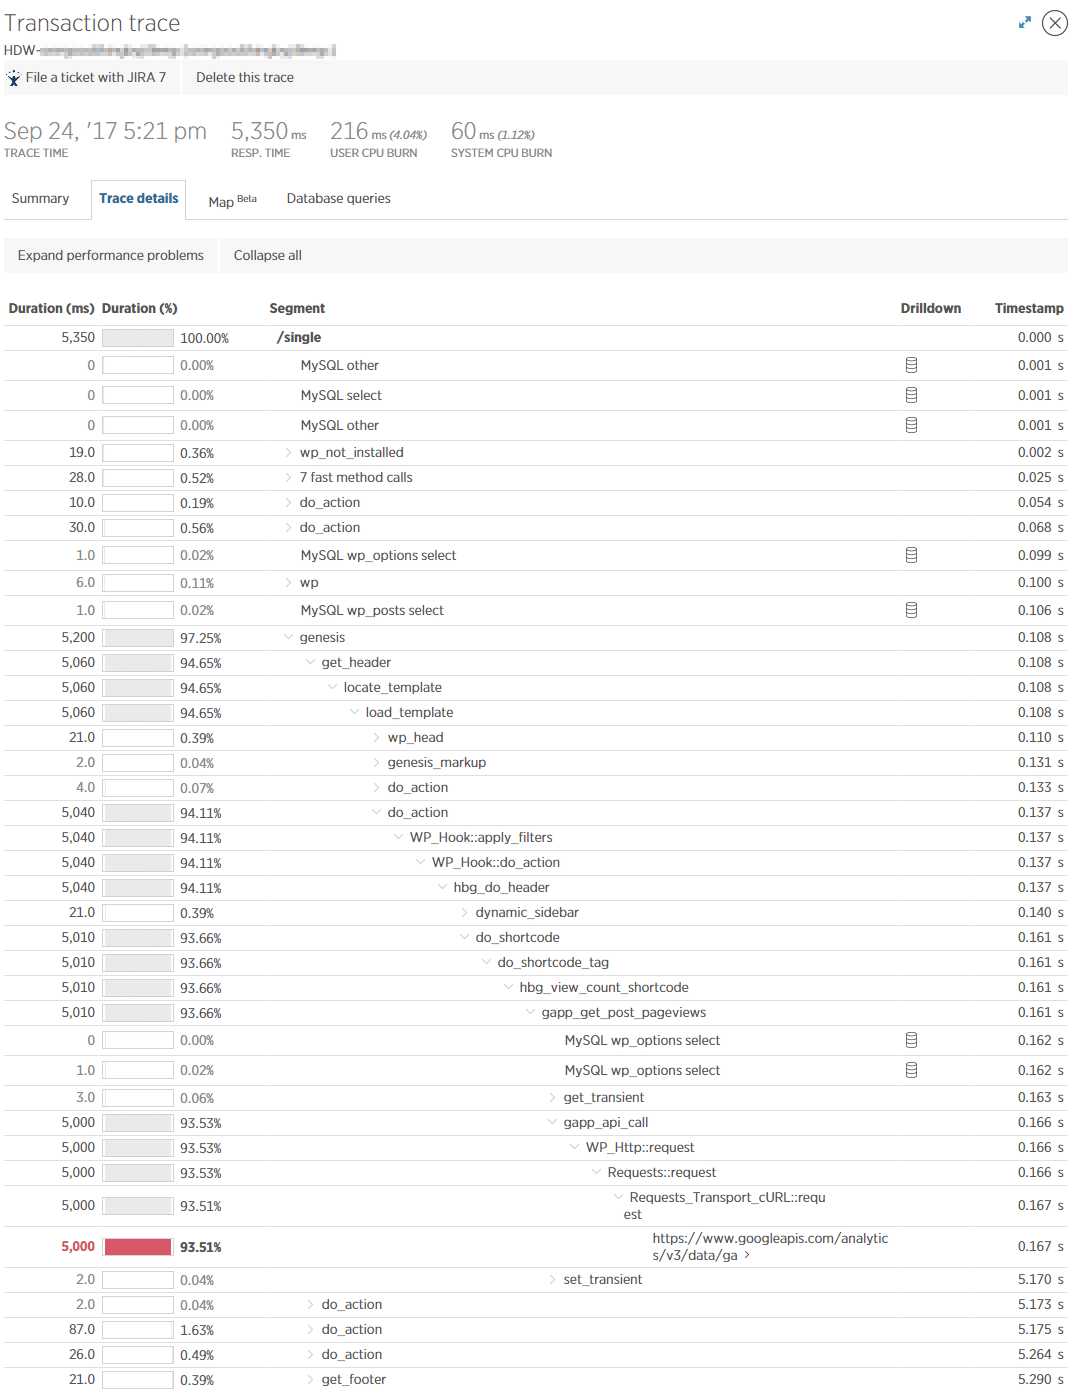
The trace details tab provides a hierarchical step-by-step waterfall showing the function, database queries, and external calls that PHP works through as it generates the page.
In the case of our example transaction, the trace details reveal that a call to a Google analytics URL is what is holding up the process. If we work backwards from that request, it is initiated a PHP function named gapp_get_post_pageviews. A quick Google search for that transaction reveals that it is part of the Google Analytics Post Pageviews plugin. This plugin is installed on the site and used to add a view counter to a sticky header bar.
New Relic has just allowed us to isolate the view counter in the sticky header bar as the primary component contributing to the slow loading of single blog posts on the site in question. Now the owner of this site knows exactly what component to target in trying to resolve the slow loading individual blog posts.
Fixing Overall Slowness
The second most common type of issue we troubleshoot for our clients is a complaint that the entire site is loading slowly. When every transaction takes a lot of time to load, one of three things is probably going on:
- The site is starved for server resources.
- A plugin or the active theme is causing problems.
- The site database is struggling to keep up with the rate of queries.
At Kinsta, server resource issues are rare, as our scalable virtual machines are able to manage varying amounts of load. However, if the site is starved for CPU or RAM, this can cause overall slowness that New Relic will not pin on any single resources. So if you do see overall slowness and New Relic indicates that every part of the site is contributing, check the load on your server to see if a shortage of server resources is to blame.
If your site has access to plenty of server resources, then the next place you’ll want to check to diagnose overall slowness include the WordPress Plugins and themes tab, the External services tab, and the Databases tab.
Here are examples of overall slowness which can be diagnosed using each of these tabs.
Overall Slowness Caused by a Plugin
When a plugin is causing overall slowness the symptoms will vary based on the activity the plugin is performing. However, in many cases, you’ll find that a slow plugin will affect every page of a WordPress site. In the case of the site whose data you see in the image below, overall slowness was observed on every front-end page of the site.
Here’s what New Relic had to say about the performance of the plugins on the site.
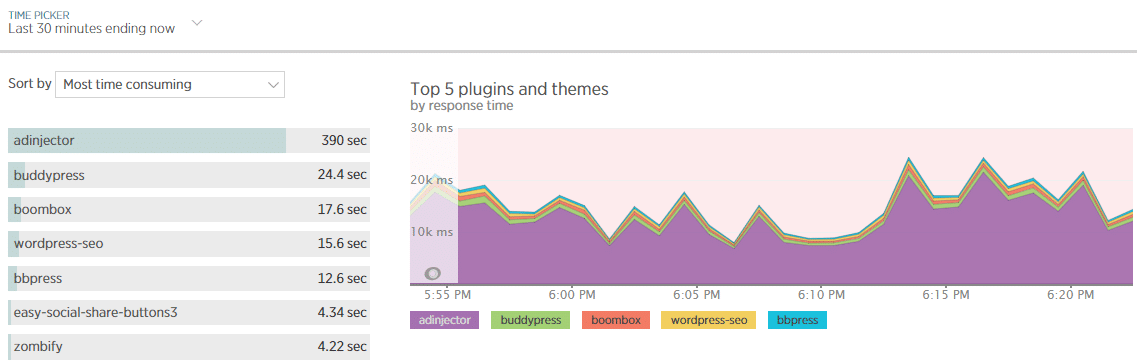
Immediately you can see that the adinjector plugin is consuming more 15 times the amount of time as the next slowest plugin.
When you see data like this it can be tempting to immediately dismiss the plugin as poorly coded or somehow ineffective. While this is sometimes the case, it is not always the case. Plugin misconfiguration, database slowness, or external resources that are slow to respond may cause a plugin to consume a lot of time.
So when you see a plugin that is responding slowly it’s a good idea to check several other screens in New Relic to find additional information. The transactions, databases, and external resources should all be checked before deciding that deactivating the plugin is the best or only way forward.
Overall Slowness Caused by External Services
If a site relies on a call to an external service in order to generate page views, and that service stops responding or takes a long time to respond, the result can be a WordPress website that stops loading entirely.
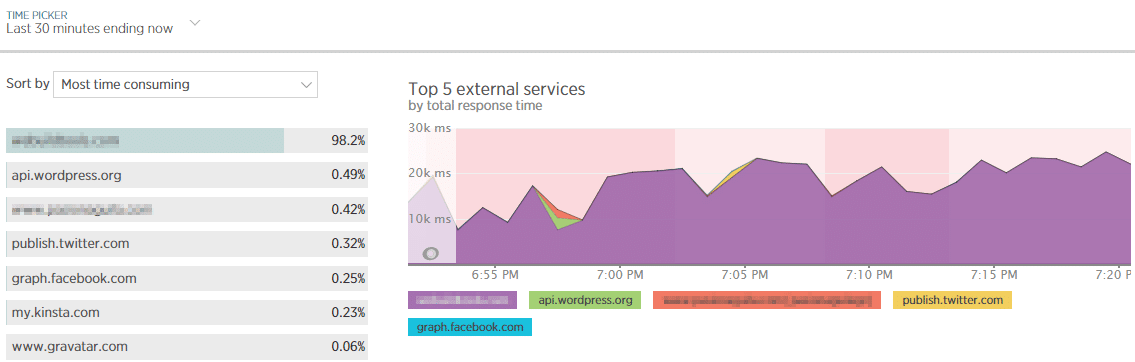
The image above is from the same site that produced the slow plugins screenshot above. As you can see, there is a single external service contributing an outsized amount to the total time spent waiting for external services.
This case shows why it’s necessary to view information in combination before arriving at a conclusion. The service being called in this case is the developer of the plugin identified in the last step.
This information adds some nuance to the situation. It isn’t the code of the plugin that is the issue, per se. Instead, it looks like the plugin makes lots of calls to the developer’s website and these calls, considered in combination, are consuming a lot of processing time.
If we take things one step further and look at a slow transaction for this site, we can see that this external call appears to be checking on the license status of the plugin in question, which suggests that the license for this particular plugin may have expired.
In any event, we are now able to advise the owner of this site that the adinjector plugin is causing the slow performance, and the slow performance is due to repeated calls to the developer’s website to check on the status of the plugin’s license.
Overall Slowness Caused by an Overwhelmed Database
A poorly optimized database can cause overall slowness on a WordPress site. One optimization we always recommend is to convert your database from MyISAM to InnoDB. In New Relic, this database related slowness will most likely show up in two places:
- First, you’ll see an outsized amount of MySQL activity in the overview.
- Second, you’ll see one or more database tables consuming a lot of time in the databases tab.
Starting with the overview screen, a site with a struggling database might look something like this:
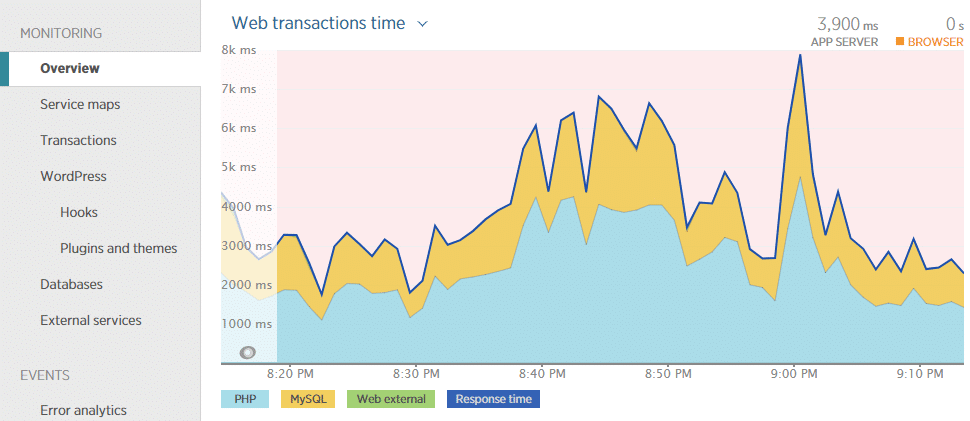
To get a better handle on which database table or query is causing the issue, head for the databases tab.
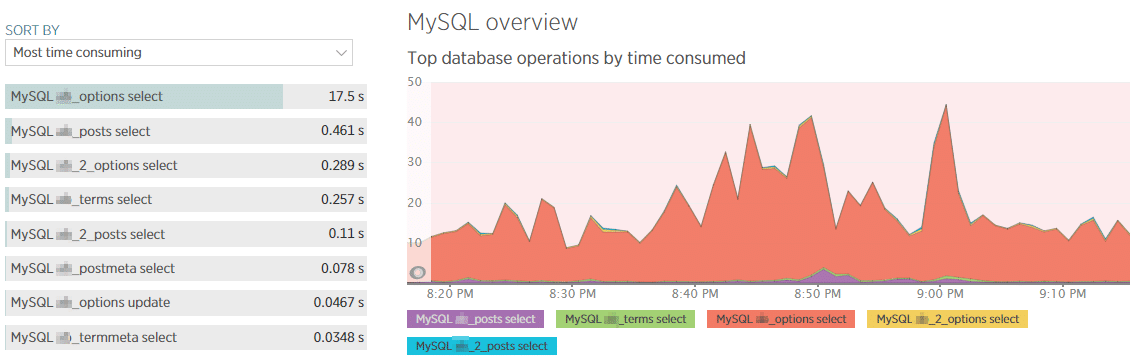
The databases tab will point out the table and type of query consuming the most time. If you select one of the entries in the list you can see more detail including some sample queries.
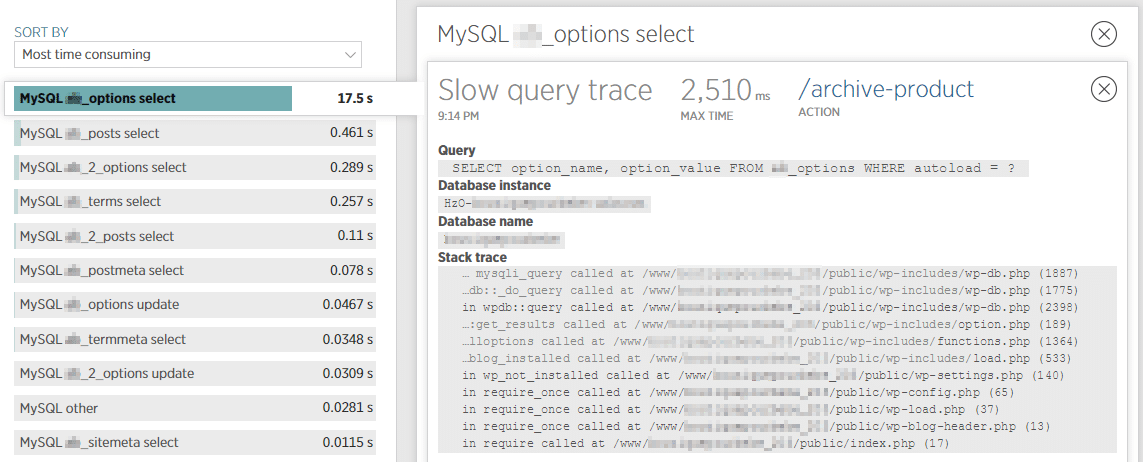
In this case, the data points a finger at autoloaded data in the wp_options table. Sure enough, a quick analysis of the wp_options table confirms that nearly 250 MB of data are autoloaded from this table, making this site an obvious candidate for database maintenance and optimization. Check out our more in-depth post on how to optimize your wp_options table and autoloaded data.
Now Get Debugging!
Once you know how to use it, New Relic can be a valuable tool for identifying PHP performance bottlenecks on your WordPress website. To get the most out of New Relic it’s critical that you know WordPress, understand the information each tab is reporting and see how all of the information is interrelated.
We have an another interesting case study on the topic make sure you take a look: Debugging WordPress Performance Issues – Stuff Happens Checklist
Do you have any New Relic WordPress tips? We would love to hear them below in the comments.

Jon is the Chief Operating Officer at Kinsta and is involved with Kinsta's sales, customer service, and technical support teams on a daily basis. Jon's a family man. So when he isn't feverishly tapping the keys of his laptop he's usually helping one of his kids fix a bike or setting up Netflix for an impatient preschooler.