
A lot of optimization articles focus on how you can speed up your WordPress site, such as optimizing your images or moving to a faster host. While those are all important, today we want to discuss with you the impact of third-party performance and how it affects your WordPress site. Basically, anything you call externally from your site has load time consequences. What makes this problem even worse is that some of them are only slow intermittently, making identification of the issue even more difficult. Today we’ll explore ways to identify and analyze third-party services and performance problems.
- What Are Third-Party External Services?
- Identifying External Services
- Analyzing Continuous Third-Party Performance Issues
- Analyzing Intermittent Third-Party Performance Issues
What Are Third-Party External Services?
A third-party external service could be considered anything that communicates with your WordPress site from outside your own server. Here are a few common examples we encounter on a regular basis:
- Social media platforms like Twitter, Facebook, and Instagram (widgets or conversion pixels)
- 3rd-party advertising networks like Google Adsense, Media.net, BuySellAds, Amazon Associates
- Website analytics like Google Analytics, Crazy Egg, Hotjar
- A/B testing tools such as Optimizely, VWO, Unbounce
- WordPress comment systems such as Disqus, Jetpack, Facebook comments
- Backup and security tools such as VaultPress, Sucuri, CodeGuard
- Social sharing tools such as SumoMe, HelloBar
- CDN networks like KeyCDN, Amazon CloudFront, and CDN77
- Externally hosted Javascript
How External Services Cause Problems
External services typically bring with them two problems. One is brought about by sheer volume, the other has to do with waiting until they load.
- If you have a lot of external services, you need to load all of them and wait for information from them on each page load. The more calls you have, the more you wait, the higher the load on your own server and the higher chance you have of bumping into the second issue.
- In some cases, the page load will wait until the data transfer is completed between your site and the external service. If the service is called in the header and there is a service interruption your page will simply refuse to load.
Of course, there are things that can be done to speed things up, such as loading scripts asynchronously, but we will get into his later on. In most cases, the sheer volume is one of the biggest issues that you will have to deal with when debugging 3rd party performance issues.
Identifying External Services
Identifying these services is not too difficult. One of the easiest ways is to open up a website speed test tool, whether it be Pingdom, GTmetrix, WebPageTest, or Chrome Devtools, and run your website through it. You should see a list of resources that were loaded. Hover over a resource and if it doesn’t contain your domain name at the beginning, that is either an external service or external asset that you are calling.
Below you can see that the minified version of jQuery was loaded from an external source (https://ajax.googleapis.com).

If you don’t know what the external service is for, you can always try browsing to the main domain or search for its name in Google, as the developer or company associated should come up. This is a good way to determine if the service is legit. As you can see below, searching for the jQuery file results in some well-known companies such as jQuery and Google which describe hosting this file. So you are probably safe.

Analyzing Continuous Third-Party Performance Issues
If your website is always slow, you’ll need to figure out what is slowing it down. If your website has intermittent issues, that’s a bit more difficult. Let’s start with continuous slowness. We’re presuming here that your website is slow because of external services. While many speed issues can be caused by external services, there are a vast amount of other issues, so this may not solve your problems.
First, you need to determine if there is anyone service that is taking a long time to load and how it affects the performance of your site. So we set up a test site, hosted on Kinsta, which contains the following:
- 2 Google AdSense Ads
- Facebook Like box
- Instagram Widget
- Disqus comments
- Facebook conversion tracking pixel
- Google Analytics

This will allow us to remove each service one by one and show you just how much each they affect your overall site load. We’ll also share some strategies for alternative ways to load them. You can then apply the same strategies to your own WordPress site. We ran the test site through Pingdom and one of the first things you can look at is the “content size by domain” and the “requests by domain.” If you are seeing requests, not from your domain name, most likely these are external services or external assets. This is a good place to start. As you can see below static.xx.fbcdn.net has 37 requests, which is not good!
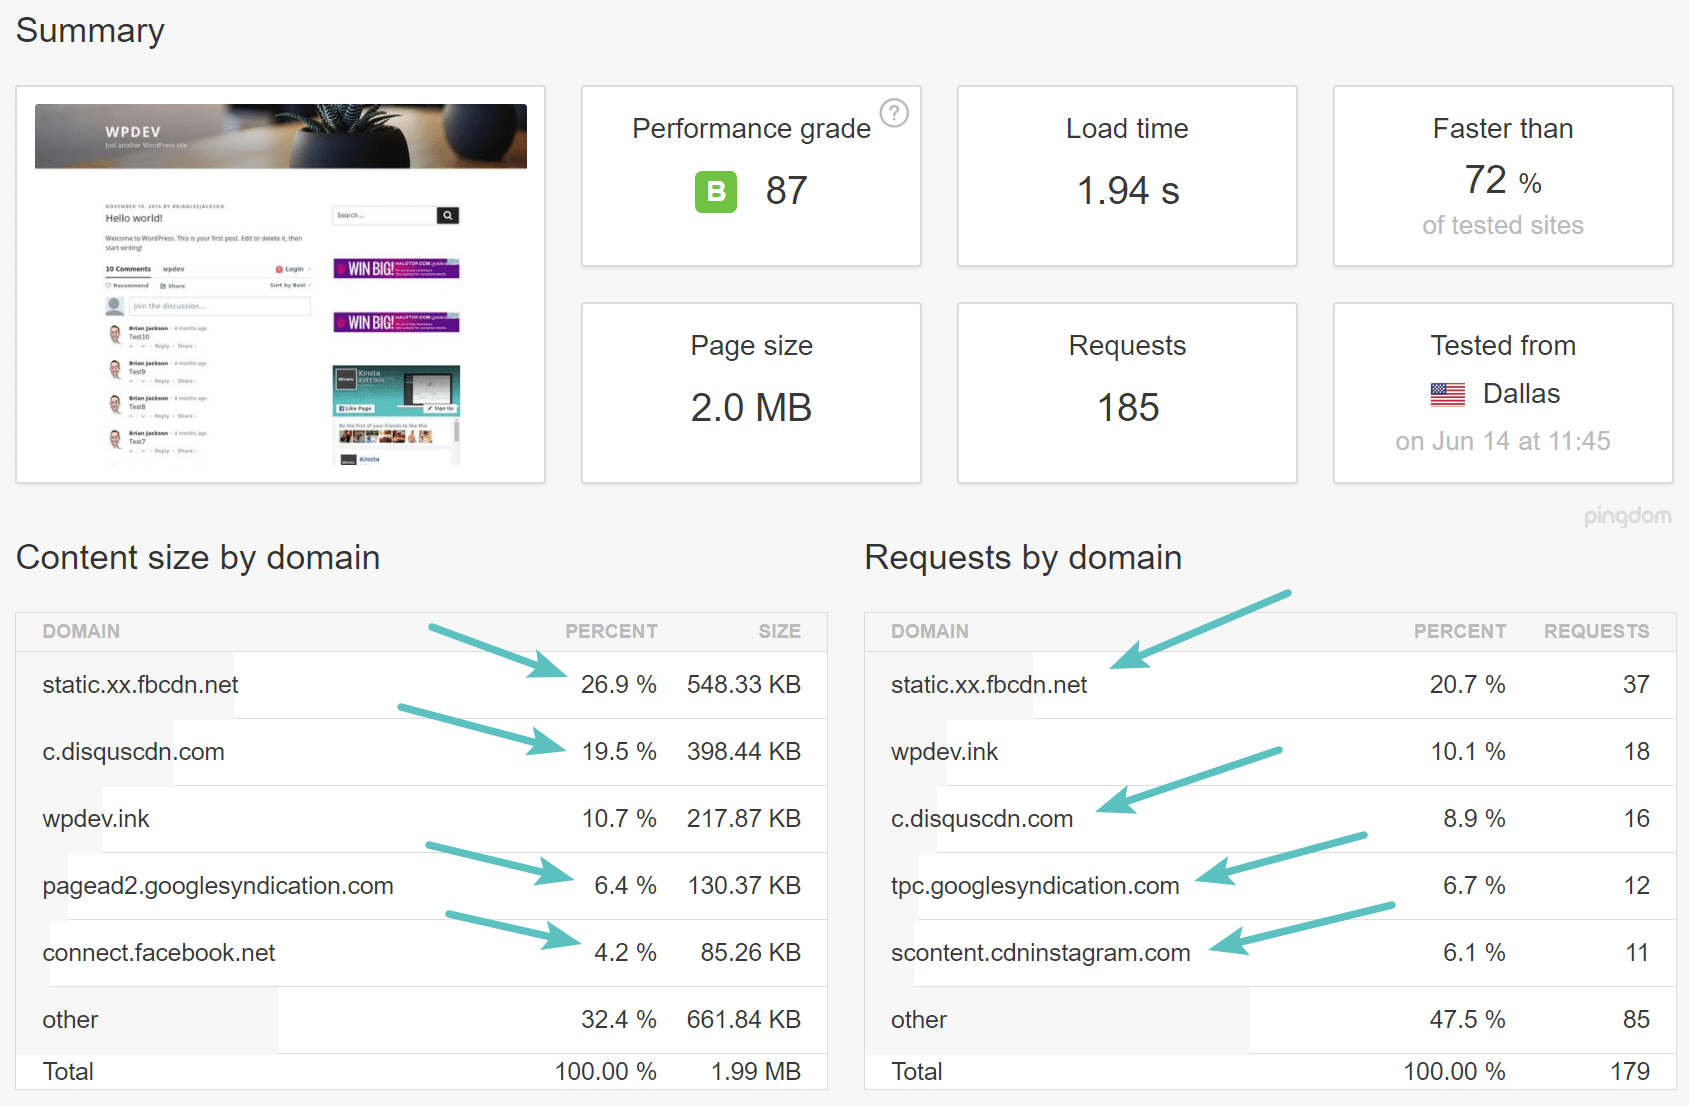
The site load time was also 1.94 seconds which is really not good because as you can see above, the test site doesn’t have any content on it. This is a smaller scale test to help you better analyze third-party performance. The larger the WordPress site, the bigger the issues become. But fundamentally, most of the issues can be resolved in a similar way.
Tackling Google AdSense
The very first thing we want to tackle is Google Adsense. Typically when you run a speed test you can hover over each bar to see how long each part of the loading process took. You should be looking for extra long bars (compared to the rest) and places where bars only start loading after a particular bar has finished – these are your bottlenecks. Once you’ve found a specific element that takes too long or prevents other resources from loading, you need to figure out why it is there and where it comes from.
This can be a bit difficult, the call to the service could be coded within your theme, or it could come from a plugin. However, as we mentioned earlier, there is also the issue of sheer volume. If we take a look at the requests below from pagead2.googlesyndication.com and tpc.googlesyndication.com, we can see that the bars are fairly short, meaning they aren’t causing that much of a delay. Some of them do have a longer receive time (green bar) though, which is the time it takes for the web browser to receive data from the server. The big issue is once you add all the requests together.
We like to call Google AdSense a variable 3rd-party service. That is because every time a page is loaded a different number of requests and assets are loaded. This makes it very hard to determine what is causing performance issues as it will be different every time you run a speed test. Below is a just a snippet of some of the 3rd-party requests the ads are generating. They also generate redirects, which have their own delays.

You might think it is crazy for just two ads to generate so many requests, but that is how they work.
Option 1 – Load Async
Your first option is to ensure that they are loading asynchronously. The async attribute basically tells the browser to start downloading the resource right away without slowing down HTML parsing. Once the resource is available, HTML parsing is paused so the resource can be loaded. Newly generated code from Google AdSense will have this attribute by default, but if you have code that is still a couple years old, we recommend checking it.
<script async src="//pagead2.googlesyndication.com/pagead/js/adsbygoogle.js"></script>
<!-- nogluten-top-right-page-300x250 -->
<ins class="adsbygoogle" style="display: block;" data-ad-client="ca-pub-xxxxxxxxxxx" data-ad-slot="9805695044" data-ad-format="auto"></ins>
<script>
(adsbygoogle = window.adsbygoogle || []).push({});
</script>
Make sure to check out our other post on eliminating render-blocking JavaScript and CSS. This can help you better understand how scripts load and function on your WordPress site.
Option 2 – Remove Them
Your other option is to remove Google AdSense altogether. Obviously, for some sites that rely on third-party ad revenue, this is not an option. But we have seen e-commerce sites throw an AdSense ad on their site, just trying to make a quick buck. You should be aware of the performance issues with this. If you are selling products or services, one Google AdSense ad might do more harm than good, and hurt your primary revenue source. For bloggers, you can also look into affiliate ads vs AdSense. A lot of times with affiliate ads you can load them from your CDN and there will only be a single request.
In this example, we are going to remove the ads to show you how just two small little ads can affect the overall performance of your WordPress site. So we ran another speed test after removing them and as you can see our load times dropped from 1.94 seconds down to 909 ms! Our requests went from 185 down to 138, and our overall page size was reduced from 2 MB to 1.7 MB.

That’s right! Two little ads added about a second to our overall load time. This is why unless your income model revolves around 3rd-party advertisements, don’t put them on your WordPress site. If you have an issue with an ad network and you have a plugin that handles the ad network for you, chances are that disabling that plugin will get rid of the issue. If it is coded within the theme you’ll need to modify your theme files. We recommend doing both of the following if you are a developer (if you aren’t here you can learn more about how to find a good WordPress developer).
Tackling the Facebook Like Box
The next thing to look at is the Facebook like box which is causing all of those static.xx.fbcdn.net and scontent.xx.fbcdn.net requests. We can see that the bars are fairly short, meaning they aren’t causing that much of a delay. However, once you add them all together and that is where the issue is. Again, this is a problem of sheer volume.
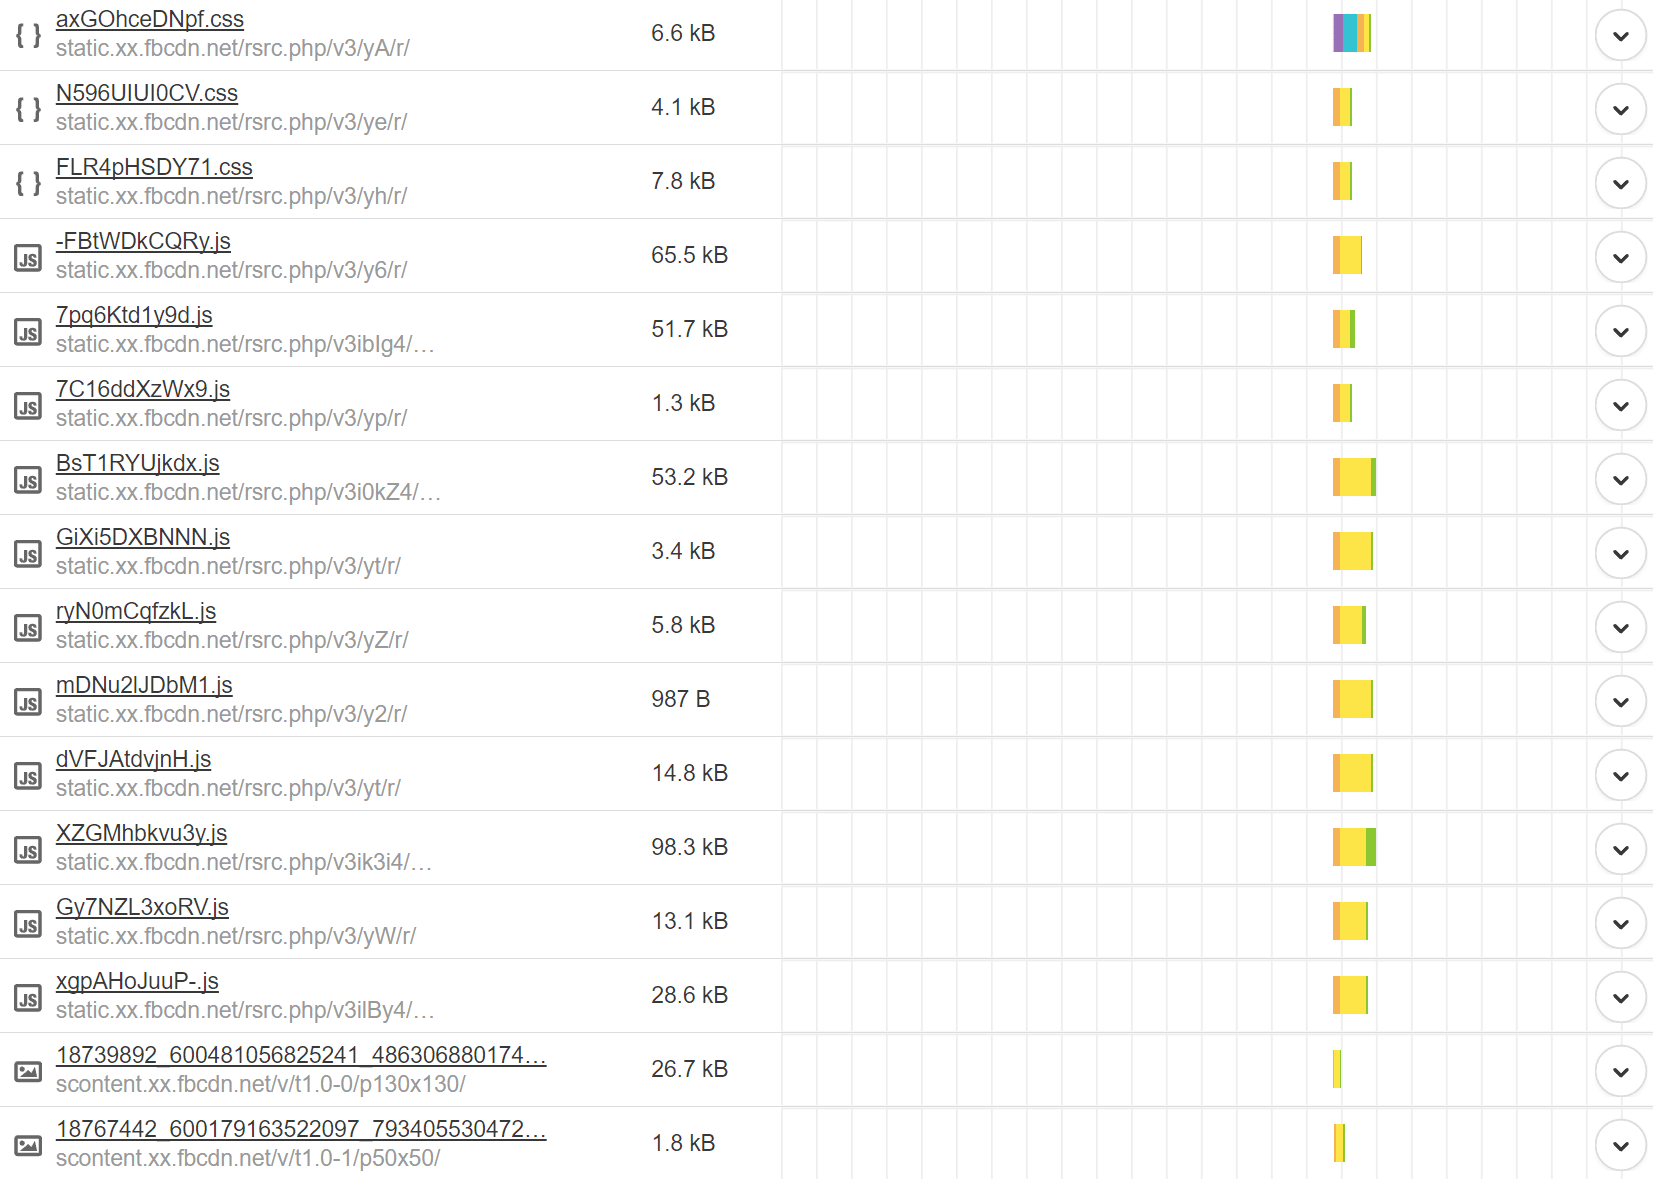
We recommend every site owner stay away from the Facebook like box! Not only does it generate a lot of requests to external JavaScript, it also loads a lot of images. Here are three recommendations to better handle this.
Option 1 – Load Async
To use the Facebook like box you or a developer would have had to add the following code to your WordPress site’s header. There are also some WordPress widgets that add the box as well.
<script>(function(d, s, id) {
 var js, fjs = d.getElementsByTagName(s)[0];
 if (d.getElementById(id)) return;
 js = d.createElement(s); js.id = id;
 js.src = "//connect.facebook.net/en_US/sdk.js#xfbml=1&version=v2.9&appId=1697897870426976";
 fjs.parentNode.insertBefore(js, fjs);
}(document, 'script', 'facebook-jssdk'));</script>
The issue with the above code is that it isn’t loading asynchronously. The async attribute basically tells the browser to start downloading the resource right away without slowing down HTML parsing. Once the resource is available, HTML parsing is paused so the resource can be loaded. We aren’t sure why Facebook didn’t add this attribute to the script, but you can see the modified version below which will load it async.
<script>(function(d, s, id) {
 var js, fjs = d.getElementsByTagName(s)[0];
 if (d.getElementById(id)) return;
 js = d.createElement(s); js.id = id;
 js.async=true; js.src = "//connect.facebook.net/en_US/sdk.js#xfbml=1&version=v2.9&appId=1697897870426976";
 fjs.parentNode.insertBefore(js, fjs);
}(document, 'script', 'facebook-jssdk'));</script>
You probably won’t notice much of a difference in load times if you check it in Pingdom, but your visitors definitely will, as it affects how/when the scripts and assets are loaded.
Option 2 – Use an Image Banner Instead
The next recommendation is to replace the Facebook like box with a banner image that simply links to your Facebook page. This would instantly reduce the 40+ requests down to 1 and you would no longer have the external dependencies. You can get very creative this way and it is a good balance between design and performance.
Option 3 – Get Rid of It
And finally, the last option would be to get rid of it altogether. We did just that on our test site and as you can see below, it dropped our load times from 909 ms to 786 ms. It reduced the overall page weight from 1.7 MB down to 1.0 MB and the total number of requests from 138 down to 78. One thing to really point out here is the page weight reduction. The Facebook like box added 700 KB! That is pretty bad.

Tackling the Instagram Widget
The next thing to look at is the Instagram Widget. In our example, we are using the free Instagram Feed plugin. The plugin is actually not the issue, but rather the requests from scontent.cdninstagram.com that are generated. We can see that the bars are fairly short, meaning they aren’t causing that much of a delay. However, once you add them all together and that is where the issue is. Again, this is a problem of sheer volume. You can probably see a pattern forming here. Many 3rd-party performance issues on WordPress sites are not from delays with single requests, but rather those that don’t care about performance to begin with.

We also recommend that people stay away from the Instagram widget unless you really need it, because it generates a lot of requests. Here are a couple of recommendations to better handle this.
Option 1 – Use an Image Banner Instead
Just like with the Facebook like box, unless you really need a dynamic Instagram widget, create a banner instead that links to your Instagram page. This would instantly reduce the 20+ requests down to 1 and you would no longer have the external dependencies. You can get very creative this way and it is a good balance between design and performance.
Option 2 – Get Rid of It
And of course, you can just get rid of it altogether. We did just that on our test site and as you can see below, it dropped our load times from 786 ms to 690 ms. It reduced the overall page weight from 1.0 MB down to 814.3 KB and the total number of requests from 78 down to 57.

Tackling Disqus Comments
The next thing to look at are the Disqus comments. In our example, we are using the free Disqus Comment System plugin. The big problem with Disqus is that it generates a lot of requests, as well as having to load the gravatar for each individual person commenting. We have gone into detail about this in our posts on how to speed up WordPress comments.
You might also want to disable comments on WordPress completely.
If you are a large commercial site, you might also have to pay to remove Disqus ads, and if you don’t, that would end up in even more requests being generated on your site. You can see below a small snippet of just some of the requests is it generating.

Here are a couple recommendations when it comes to dealing with comments.
Option 1 – Lazy Load Disqus Comments
Lazy loading is the process of not loading the assets and scripts until the person has scrolled down the page. This ensures that the first-page load is faster. You can easily lazy load Disqus comments using the free Disqus Conditional Load plugin from Joel James. We, in fact, use this on the Kinsta blog. We installed the plugin on our test site and as you can see below, it dropped our load times from 690 ms to 603 ms. It reduced the overall page weight from 814 KB down to 366.1 KB and the total number of requests from 57 down to 24. One thing to point out is massive page weight reduction!

Option 2 – Lazy Load Native WordPress Comments
Your other best option would be to lazy load native WordPress comments. Joel James, the same developer of the lazy load Disqus plugin also has a free plugin called Lazy Load for Comments. This works in a very similar fashion as the one above. We installed the plugin on our test site and as you can see below, it resulted in just about the same load time reductions.

Tackling The Facebook Conversion Tracking Pixel
And lastly, we’ll take a look at the Facebook conversion tracking pixel. Obviously, most people use this to collect data about people visiting their website, or to track conversions when running Facebook ads. So removing this might not always be an option, and there really isn’t anything you can do to improve the performance of it. As you can see below it is responsible for generating 5 different HTTP requests, and unfortunately, they aren’t the fastest.
We will simply remove this to show you how much it affects your site’s performance. After taking it off our site, it dropped our load times from 611 ms to 429 ms. It reduced the overall page weight from 367.5 KB down to 343.2 KB and the total number of requests from 27 down to 22.
The above examples are just a few of thousands of external services that you might have running on your WordPress site. It is important to look at each one and determine just how much it affects your site’s performance. As you can see, just one bad apple can cause huge issues!
External Services Can Help Performance
While most external services harm your site’s performance, there are those that can help it as well. A CDN, such as KeyCDN or Cloudflare can drastically speed up your site with minimal setup work involved. Check out our tutorial on how to setup KeyCDN and how to install Cloudflare. In this example below, we added KeyCDN to our test site. As you can see, it decreased our load time by another 100 ms.

Further Optimizations
We then did a few additional optimizations on the WordPress site to get us to a 100 performance grade score and a 270 ms load time. These optimizations included:
- Making sure everything loaded from CDN provider. This meant hosting Google fonts locally and results in a single HTTP/2 request.
- Removing additional assets which generate unnecessary HTTP requests such as emojis, embeds, jQuery migrate, etc. We used the perfmatters plugin.
Here are more in-depth tutorials for some of the optimizations:
- How to disable emojis
- How to disable embeds
- How to fix the leverage browser caching warning
- How to remove query strings from static resources
- How to Find WordPress Performance Bottlenecks with New Relic
- 8 Lesser-Known (But Useful) WordPress Performance Plugins
- How To Disable WordPress Plugins (No Access to WP-Admin)

As you can see, we went from 1.94 seconds down to 270 ms load times! Of course, you might need some external services, every business does. But it is important to not forget to analyze each one. If you are seeing huge load times, reach out to the developer or company responsible for it and bring up the issue.
Preventing Stalled Loading
The bigger issue is when a script prevents loading while it finished loading itself. If a script like this is included in the header it can keep your website blank indefinitely. Due to this, anything which is not absolutely necessary in the header should be placed in the footer. This will allow your website to load fully before the problematic script even begins loading. If you use the wp_enqueue_script() function (you should), you can use the fifth parameter to indicate that it should load in the footer.
If you notice that a plugin loads an asset in the header without reason you can use wp_dequeue_script() to remove it from the header and then use wp_enqueue_script() to register it in the same way, but in the footer.
Utilizing Google Tag Manager
Another way to help solve third-party performance issues is to utilize a free tool like Google Tag Manager. This allows you to manage all of your scripts and tags in one place. A few benefits of doing this is that they will load asynchronously, management becomes easier, and you can set up firing triggers for which pages scripts load on.

However, there are a few drawbacks to this as well:
Google Tag Manager doesn’t reduce the number of tags on your site or app, but it does simplify the task of managing them. For websites, Google Tag Manager executes asynchronously and can be configured to fire tags only when they are needed, helping your pages to load more quickly. (source)
If you use Google Tag Manager you will also have another HTTP request and DNS lookup to googletagmanager.com, even though it is very negligible.

We recommend looking into Google Tag Manager for large unoptimized sites that have a lot of third-party services and integrations. For smaller sites with developers, you are most likely not going to see that much of a performance boost by using GTM.
Analyzing Intermittent Third-Party Performance Issues
The way you solve intermittent issues is the same as the way you solve continuous issues but identifying the culprit is more difficult. Implementing the solutions above could already help, but it would still be nice to know what is causing the issue. A tool you can use for this is New Relic (license required). Below you can see an example of some 3rd-party ad networks and heavy load times associated with them over a period of time.

Ironically though, New Relic can also cause performance issues. In which case we recommend using it for troubleshooting and sporadic monitoring, not continuous usage. You can also use a tool like GTMetrix to schedule hourly speed checks on your site. After a couple of days you can check back and see the results in a nice little graph:
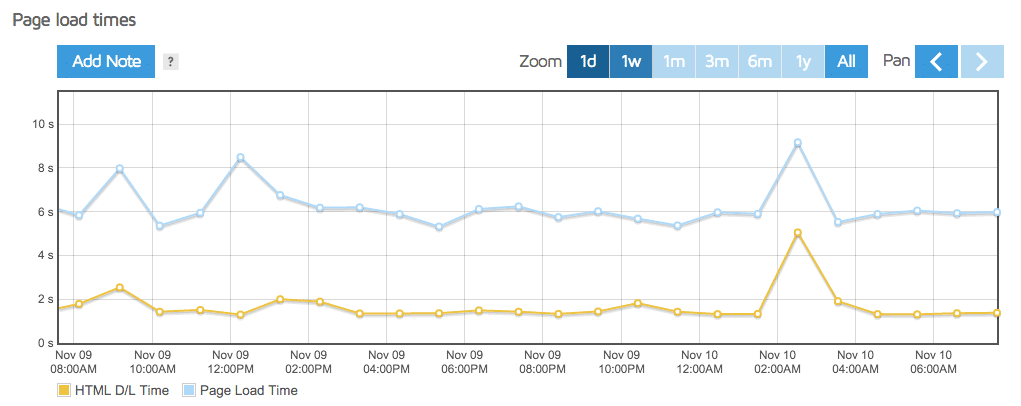
This tells you when your site was slower than average. We would click on the far right spike first to go into the report created at that point in time. we would then view the waterfall to see which resource created the issue. Make sure to check out our in-depth post on how to use GTmetrix to diagnose issues on your site.
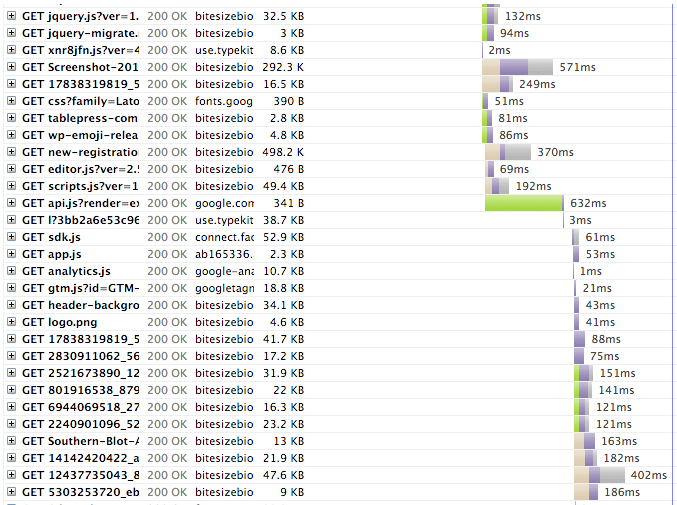
There’s one asset in there which seemingly blocks subsequent ones, take a look at the green bar near the middle. Turns out that this was from Google Recaptcha. 632ms may seem like a blink of the eye, but in reality, it is a lot. A page really should load in 2 seconds-ish. Over one-third of that is taken up just by this one asset. The asset should either be loaded later, or it should be ditched in favor of other methods of verification.
Summary
As you can see, just a few external services can have a huge impact. 3rd-party performance is not to be ignored and goes hand in hand with onsite and backend optimizations. Thankfully though, there is a lot that can be done, especially if you involve a developer. Ditching services, tweaking them to load in different ways such as async, providing the same thing in an alternative way such as a banner, all can go a long way in making your site a lot faster!

Brian has a huge passion for WordPress, has been using it for over a decade, and even develops a couple of premium plugins. Brian enjoys blogging, movies, and hiking. Connect with Brian on Twitter.

