
As your agency adds more clients, maintaining high performance across all the sites you manage can quickly become a challenge. Poorly coded plugins, unoptimized images, and third-party scripts can slow down your client sites and gradually lower PageSpeed Insights (PSI) scores.
Instead of manually checking each WordPress site, you can automate performance monitoring across all your sites and focus on investigating anomalies only when they arise, saving your team hours of work each month through simple, efficient automated checks.
In this article, you’ll learn how to automate your workflow for monitoring the performance of all your agency’s Kinsta-hosted WordPress sites by using the Kinsta API and Google PageSpeed Insights API together. As a final step, you will learn how to share this data with your team in real-time using Slack webhooks and automate the process with a cron job.
Exciting, right? Let’s get started.
Workflow overview: Kinsta to PageSpeed Insights to Slack
The script links three APIs. Kinsta, Google PageSpeed Insights, and Slack, to automate site performance monitoring.
Start by querying the Kinsta API to fetch your website domains and environments. This ensures your domain list stays current as you add client sites.
Then, for each site returned by the Kinsta API, your script uses the Google PSI API to extract key metrics: Performance Score (0–100), First Contentful Paint (FCP), and Largest Contentful Paint (LCP).
Finally, the script posts these metrics, site name, the three scores, and a PageSpeed Insights link to a designated Slack channel.
Setting up the tools
Before coding, generate two API keys and make quick configurations.
Using the Kinsta API: Check permissions and generate your API key
The Kinsta API requires an API key generated from an account with specific permissions. For our example, it should be the company owner or a company administrator.
To create a Kinsta API key, log in to MyKinsta and follow these steps:
- Navigate to the API Keys page (Your name > Company settings > API Keys).
- Click Create API Key.
- Set Expiry and give your key a unique name.
- Click Generate.
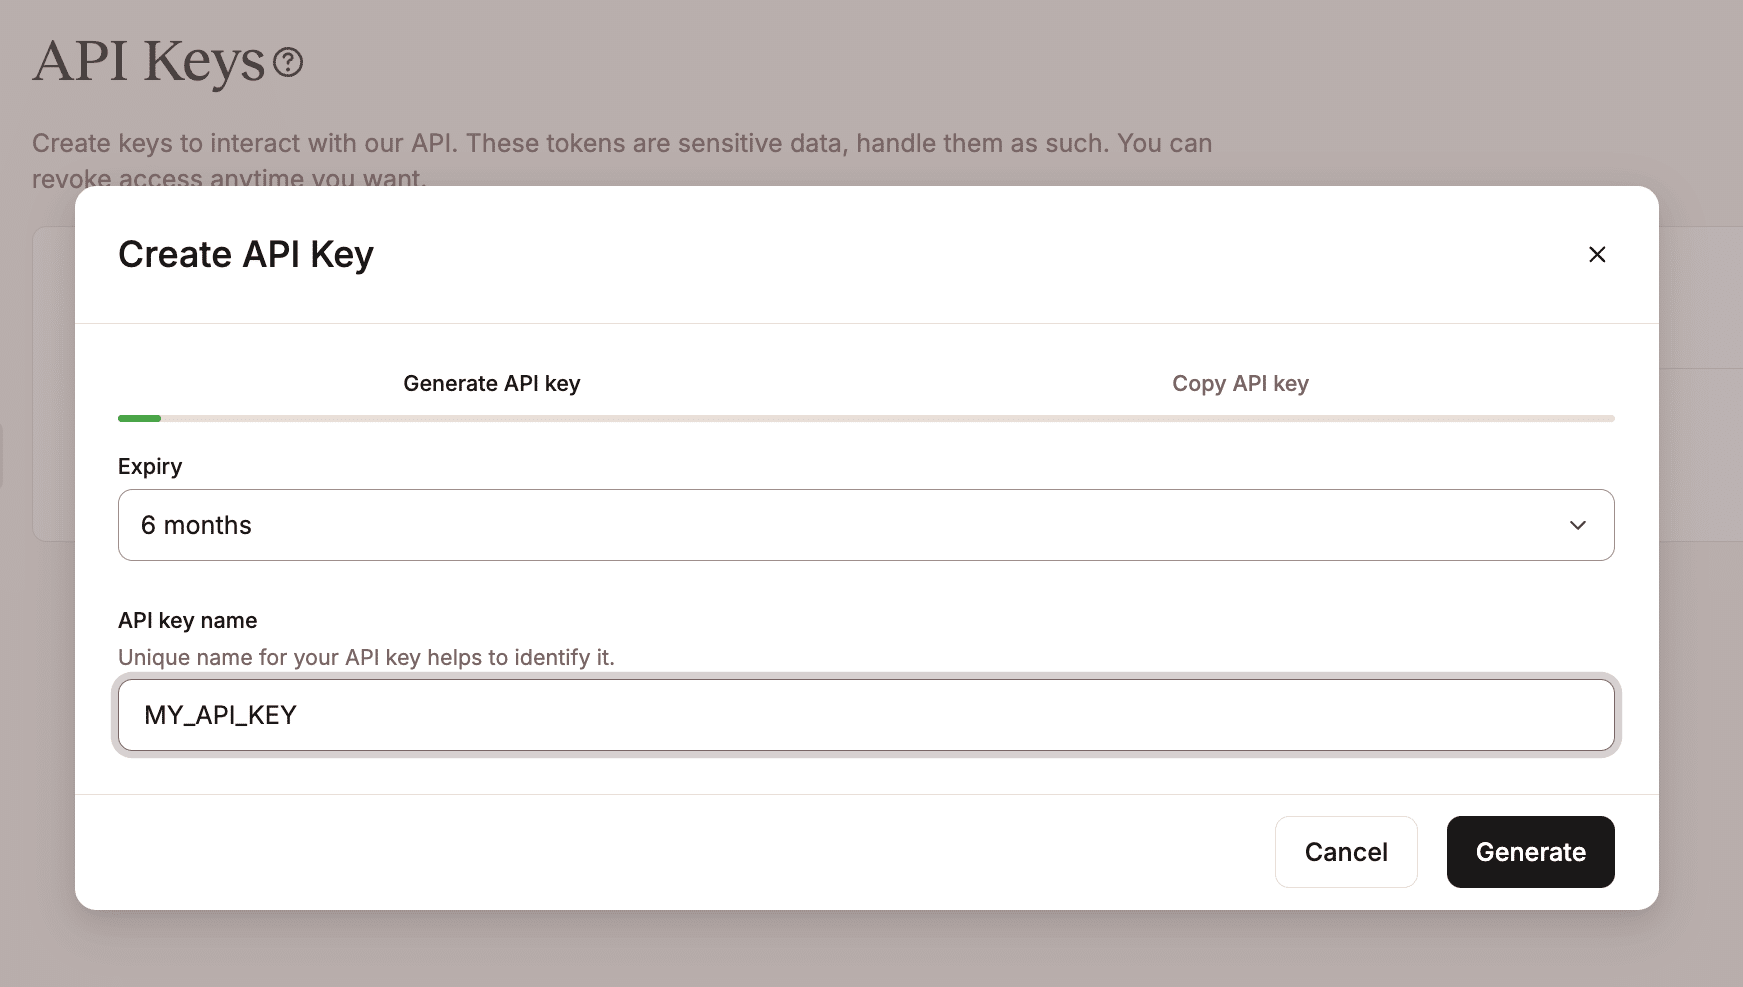
Note that this is the only time you can see your API key. Copy it and store it in a safe place.
The second thing you need is your MyKinsta company ID. You can easily find it in the query string of your MyKinsta dashboard URL (search for the idCompany parameter).
With this data, you can access the Kinsta API and use cURL to request a list of your company sites. Open your favorite command-line tool and enter the following command, replacing <YOUR_COMPANY_ID> and <YOUR_API_KEY> with your credentials.
curl -X GET "https://api.kinsta.com/v2/sites?company=<YOUR_COMPANY_ID>" \
	 -H "Authorization: Bearer <YOUR_API_KEY>"
If your company ID and API key are correct, you should receive a JSON response structured as follows:
{
	"company": {
		"sites": [
			{
				"id": "YOUR_SITE_ID",
				"name": "my-wordpress-website",
				"display_name": "My WordPress website",
				"status": "live",
				"site_labels": []
			}
		]
	}
}
As you can see, this response is missing an essential piece of information—the website URL. To retrieve the primary domain for each environment, you’ll add the parameter include_environments=true to the query string. With this parameter, the API also returns detailed data for each environment (live and staging), including the primary domain. Here is a generic response:
{
	"company": {
		"sites": [
			{
				"id": "54fb80af-576c-4fdc-ba4f-b596c83f15a1",
				"name": "firstsite",
				"display_name": "First site",
				"status": "live",
				"siteLabels": [
					{
						"id": "54fb80af-576c-4fdc-ba4f-b596c83f15a1",
						"name": "Do not remove"
					}
				],
				"environments": [
					{
						"id": "54fb80af-576c-4fdc-ba4f-b596c83f15a1",
						"name": "live",
						"display_name": "Live",
						"is_blocked": false,
						"id_edge_cache": "54fb80af-576c-4fdc-ba4f-b596c83f15a1",
						"cdn_cache_id": "54fb80af-576c-4fdc-ba4f-b596c83f15a1",
						"is_opt_out_from_automatic_php_update": false,
						"web_root": "/release_v1",
						"image_optimization_type": "lossy",
						"is_additional_sftp_accounts_enabled": false,
						"is_premium": false,
						"wordpress_version": "6.3.1",
						"domains": [ ... ],
						"primaryDomain": {
							"id": "54fb80af-576c-4fdc-ba4f-b596c83f15a1",
							"name": "example.com",
							"site_id": "54fb80af-576c-4fdc-ba4f-b596c83f15a1",
							"is_active": true,
							"type": "live"
						},
						"ssh_connection": { ... }
						},
						"container_info": { ... }
					}
				]
			}
		]
	}
}
Next, you need to generate a Google PageSpeed Insights application and API key.
Generate an API Key for Google PageSpeed Insights
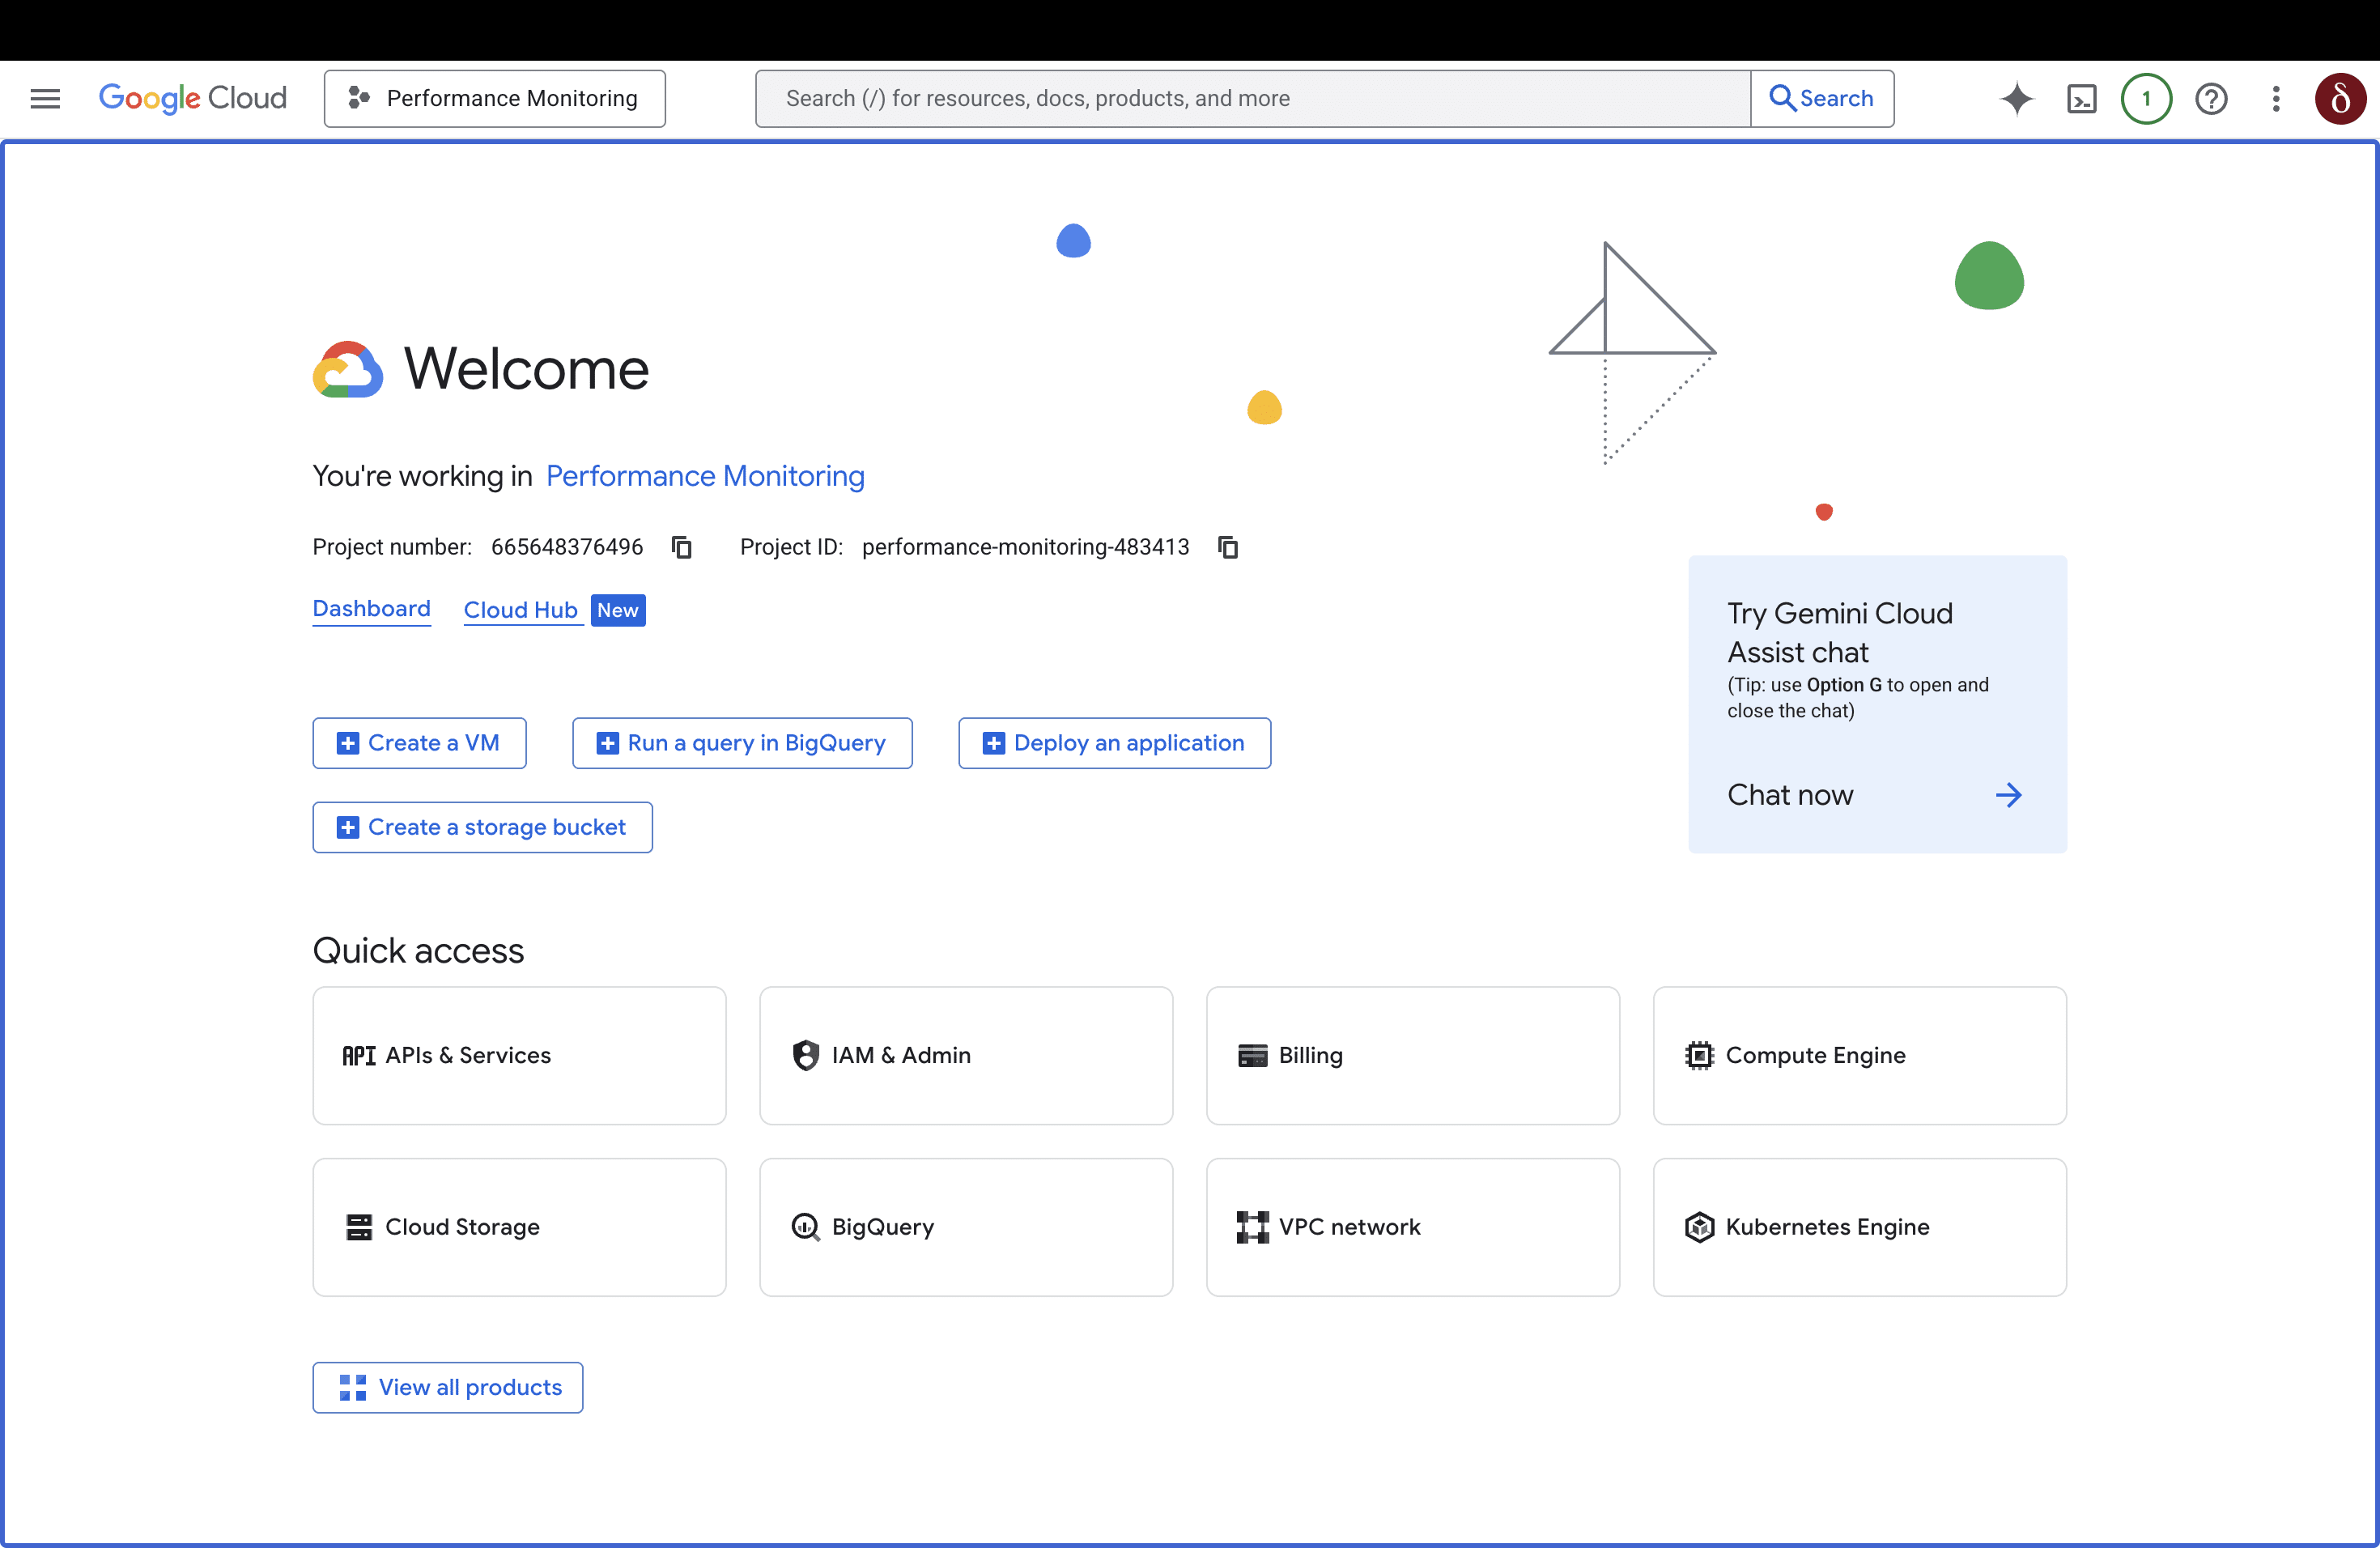
The next step is to create an API key to access the Google PageSpeed Insights service. Log in to the Google Cloud Console and follow these steps:
Step 1: Create a new project or open an existing one. For this article, we created a new Performance Monitoring project.
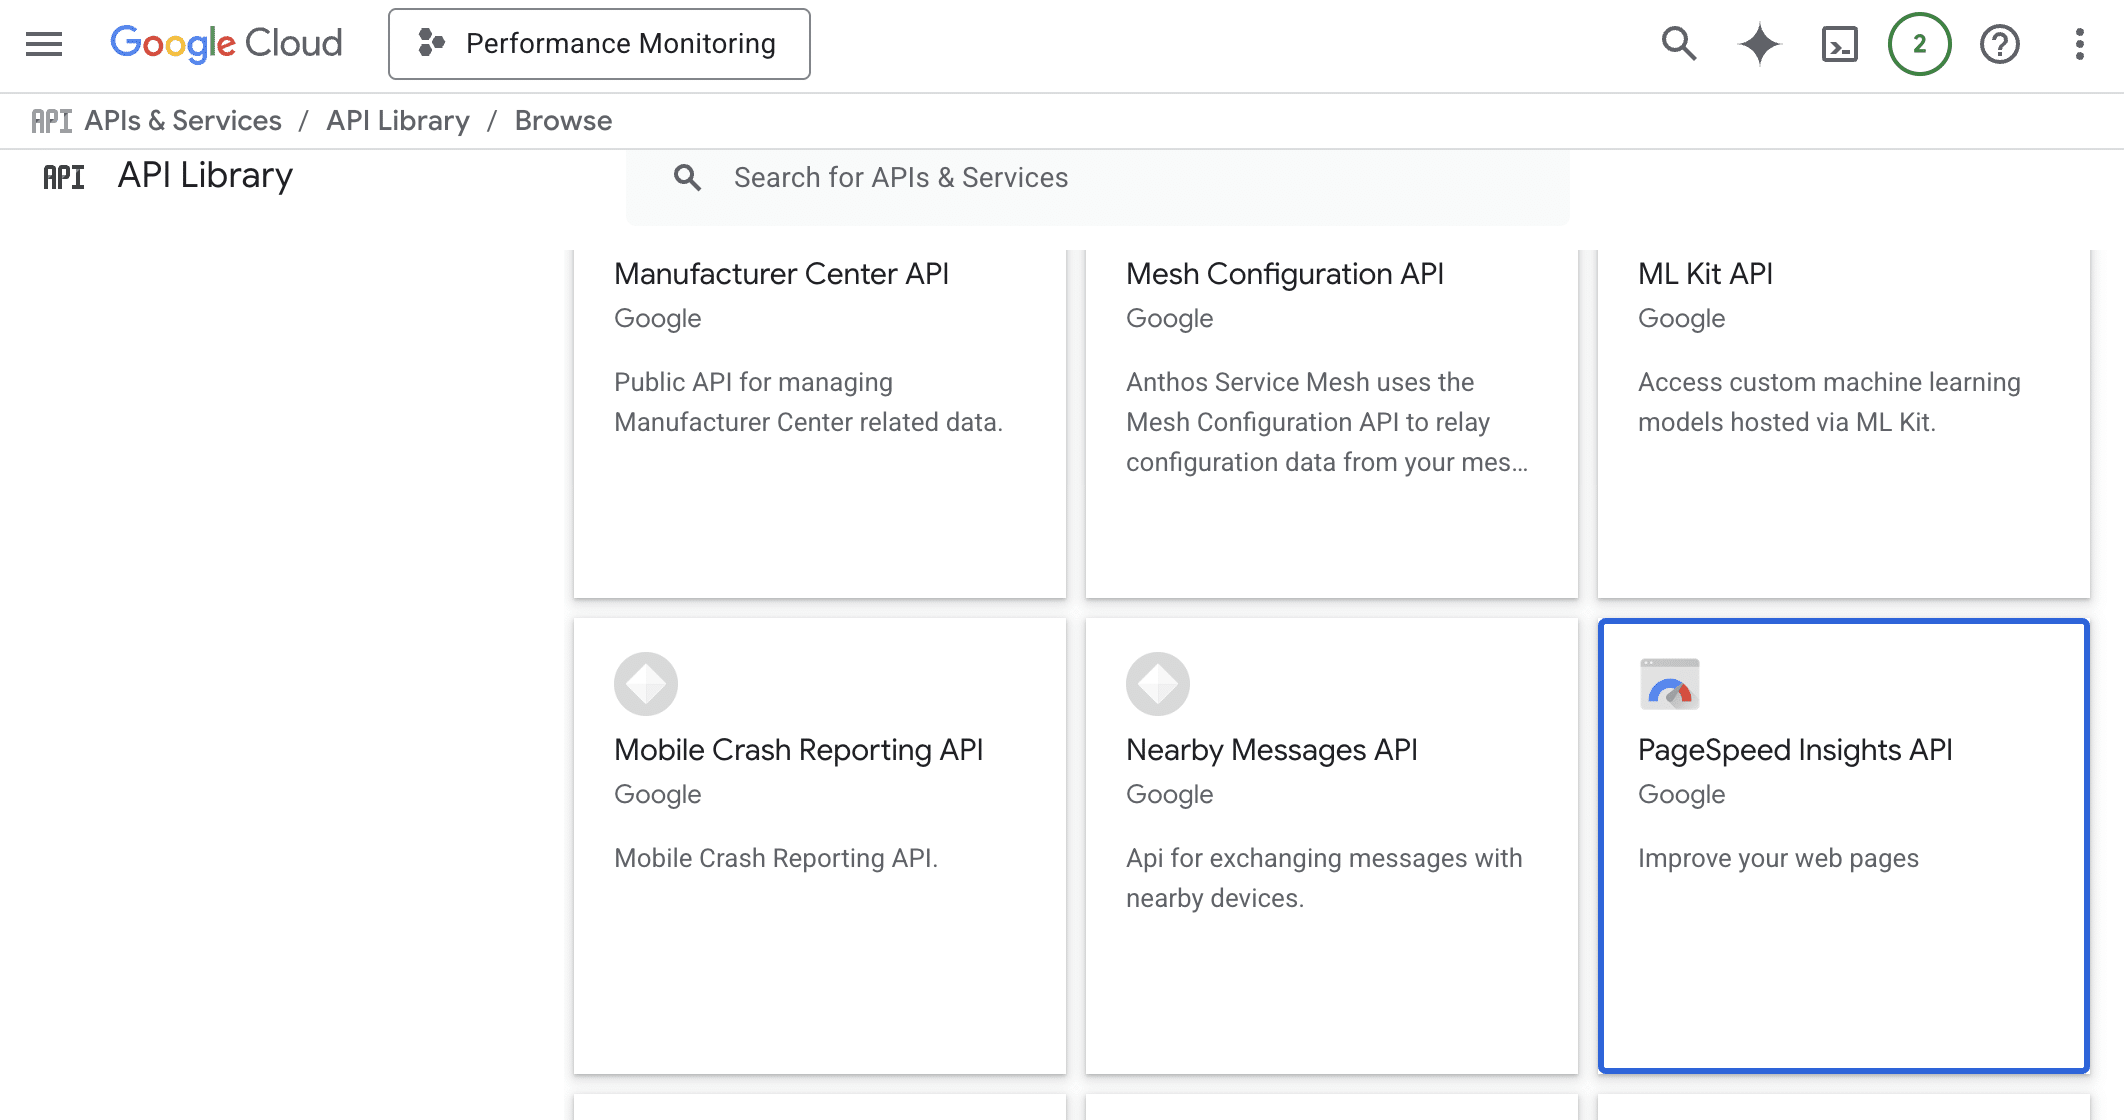
Step 2: Navigate to APIs & Services > Library, then search for PageSpeed Insights API at the bottom of the page and click on the button.
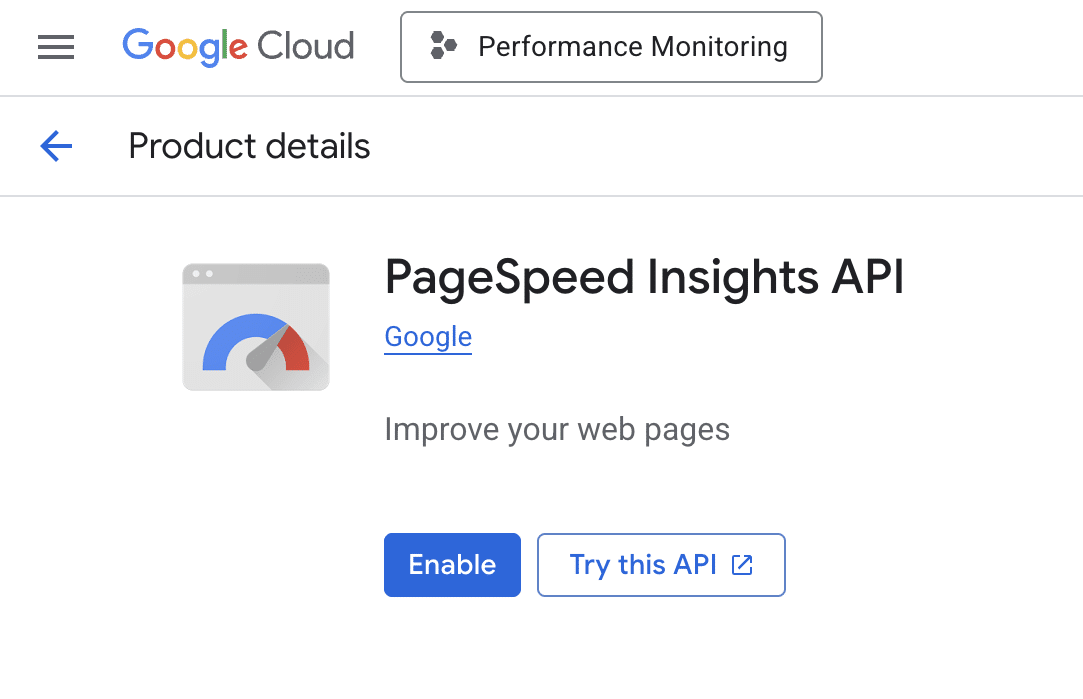
Step 3: On the next page, click Enable.
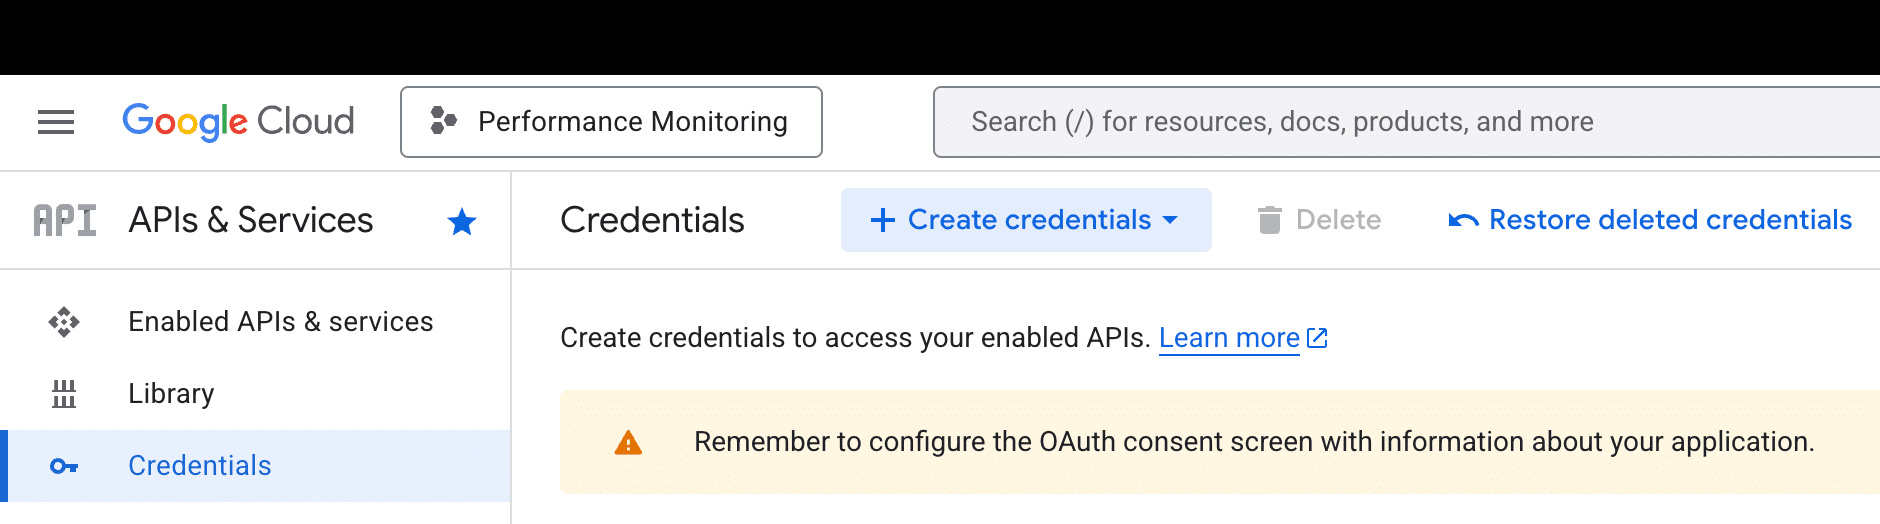
Step 4: Click Create credentials in the Credentials tab.
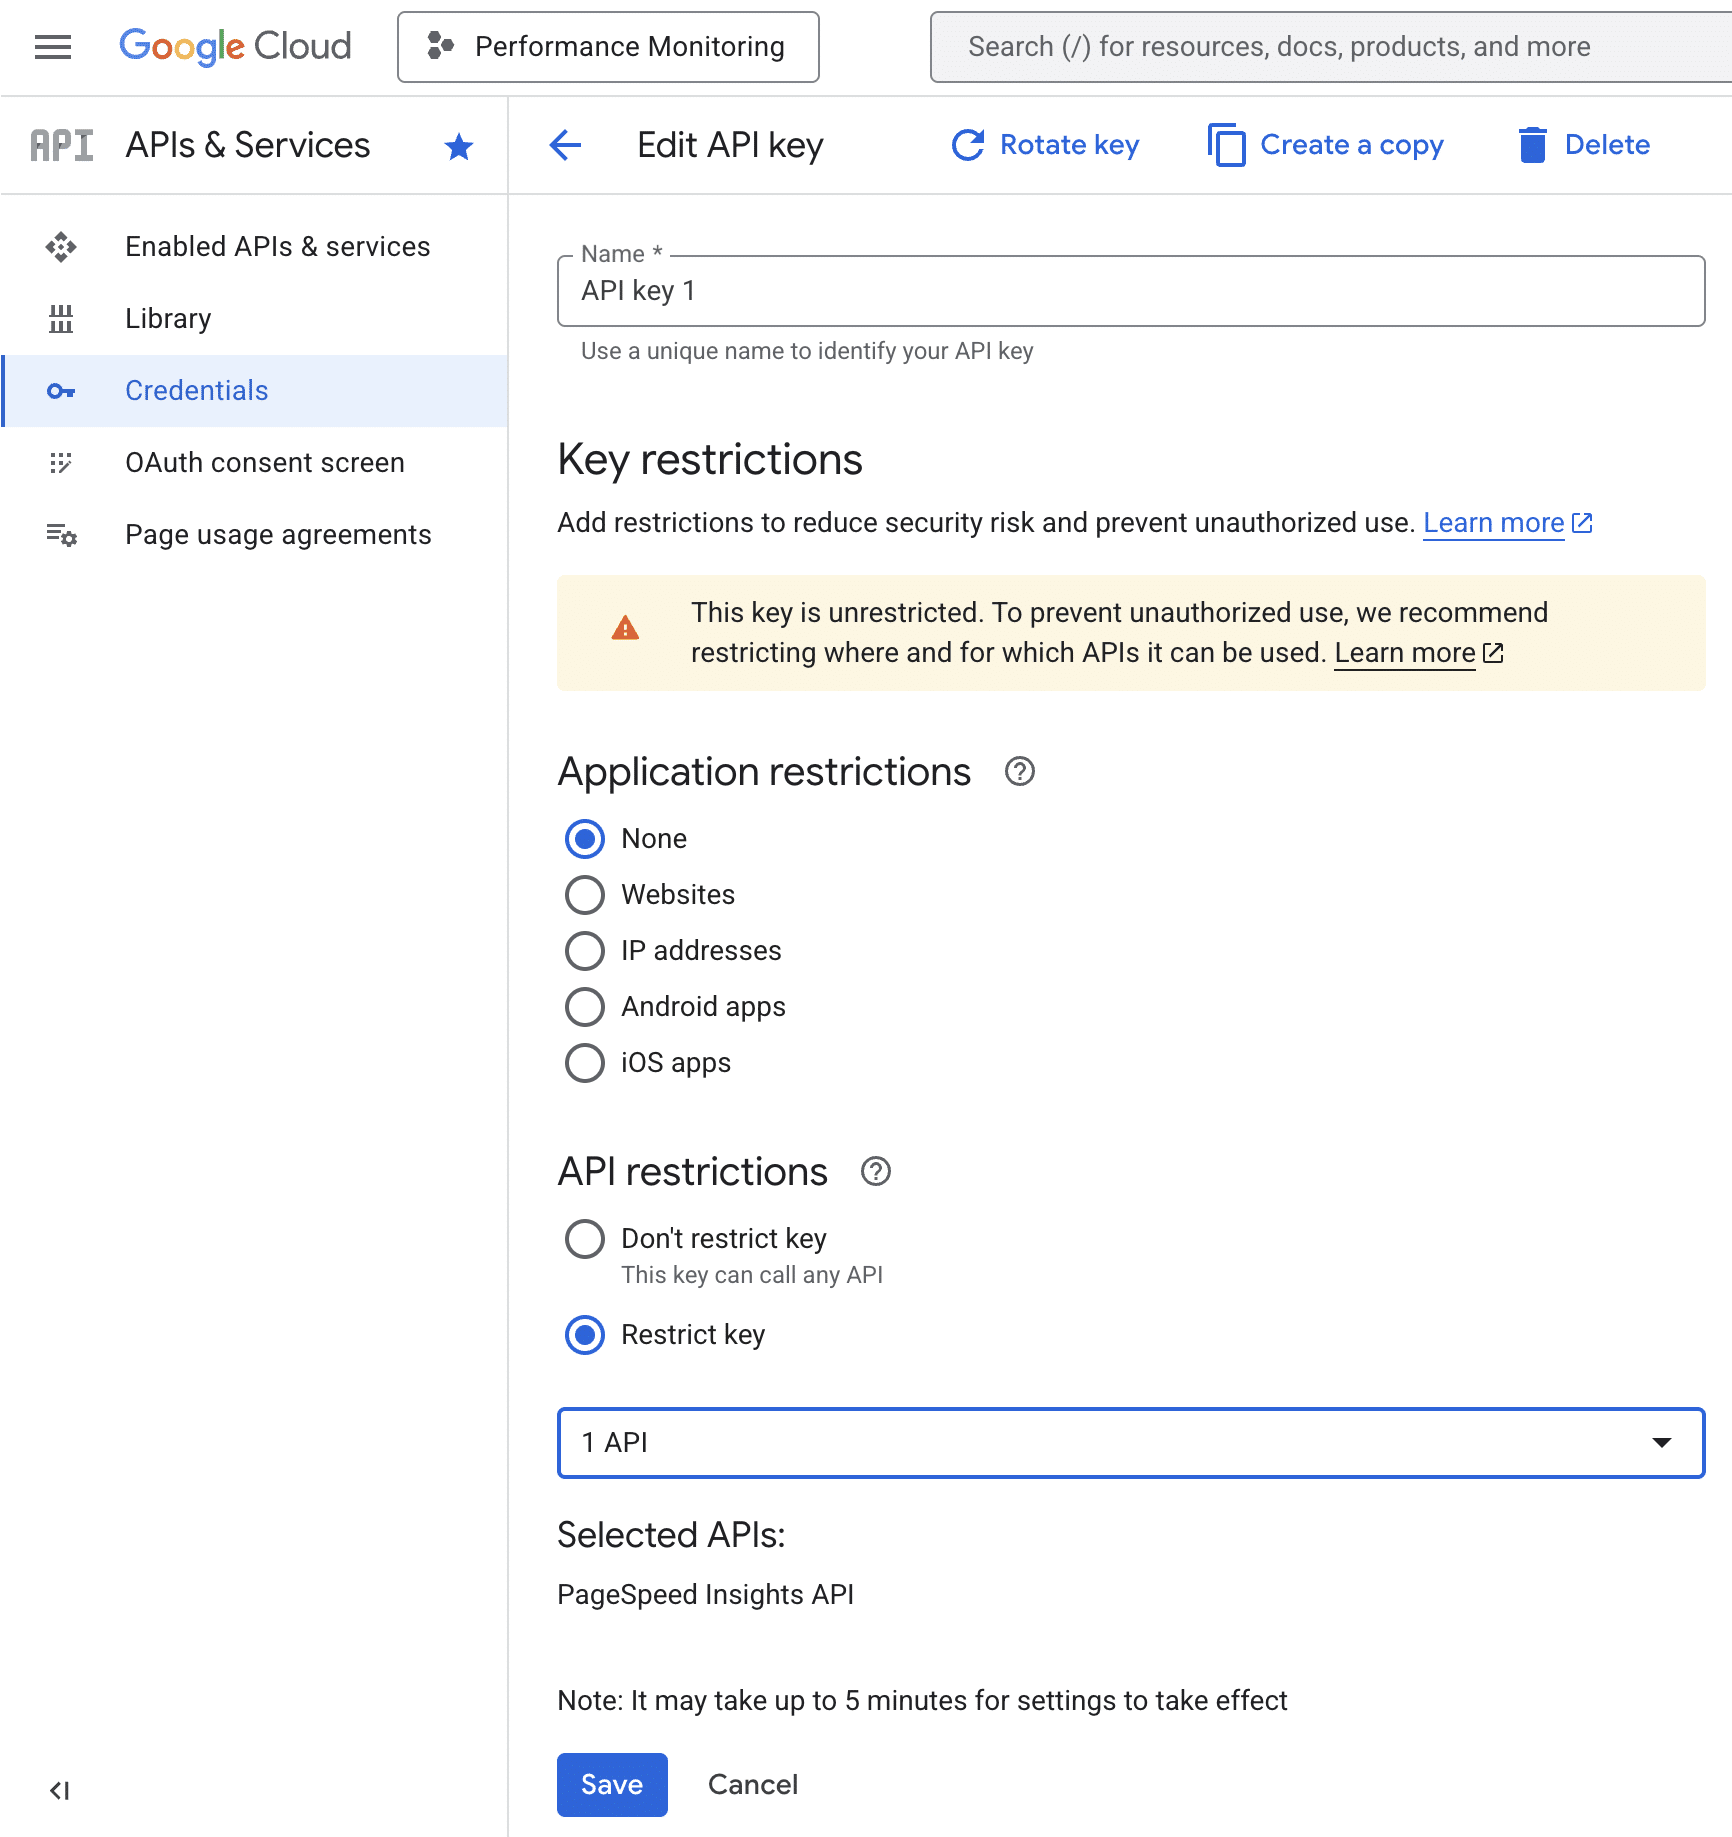
Step 5: For added security, we recommend setting restrictions for the newly created key by selecting only the PageSpeed Insights API.
Your PageSpeed Insights API key is now ready to use. One last service needs to be configured. You need to create a new Slack app.
Create a Slack app and configure the Incoming Webhook
To send messages to a specific Slack channel, you need to create a Slack application. Follow these steps:
Step 1: If you actively use Slack to collaborate with your team, then you have an active workspace. If not, refer to the Slack documentation to create one. For this example, we will assume that you have an existing My Company workspace.
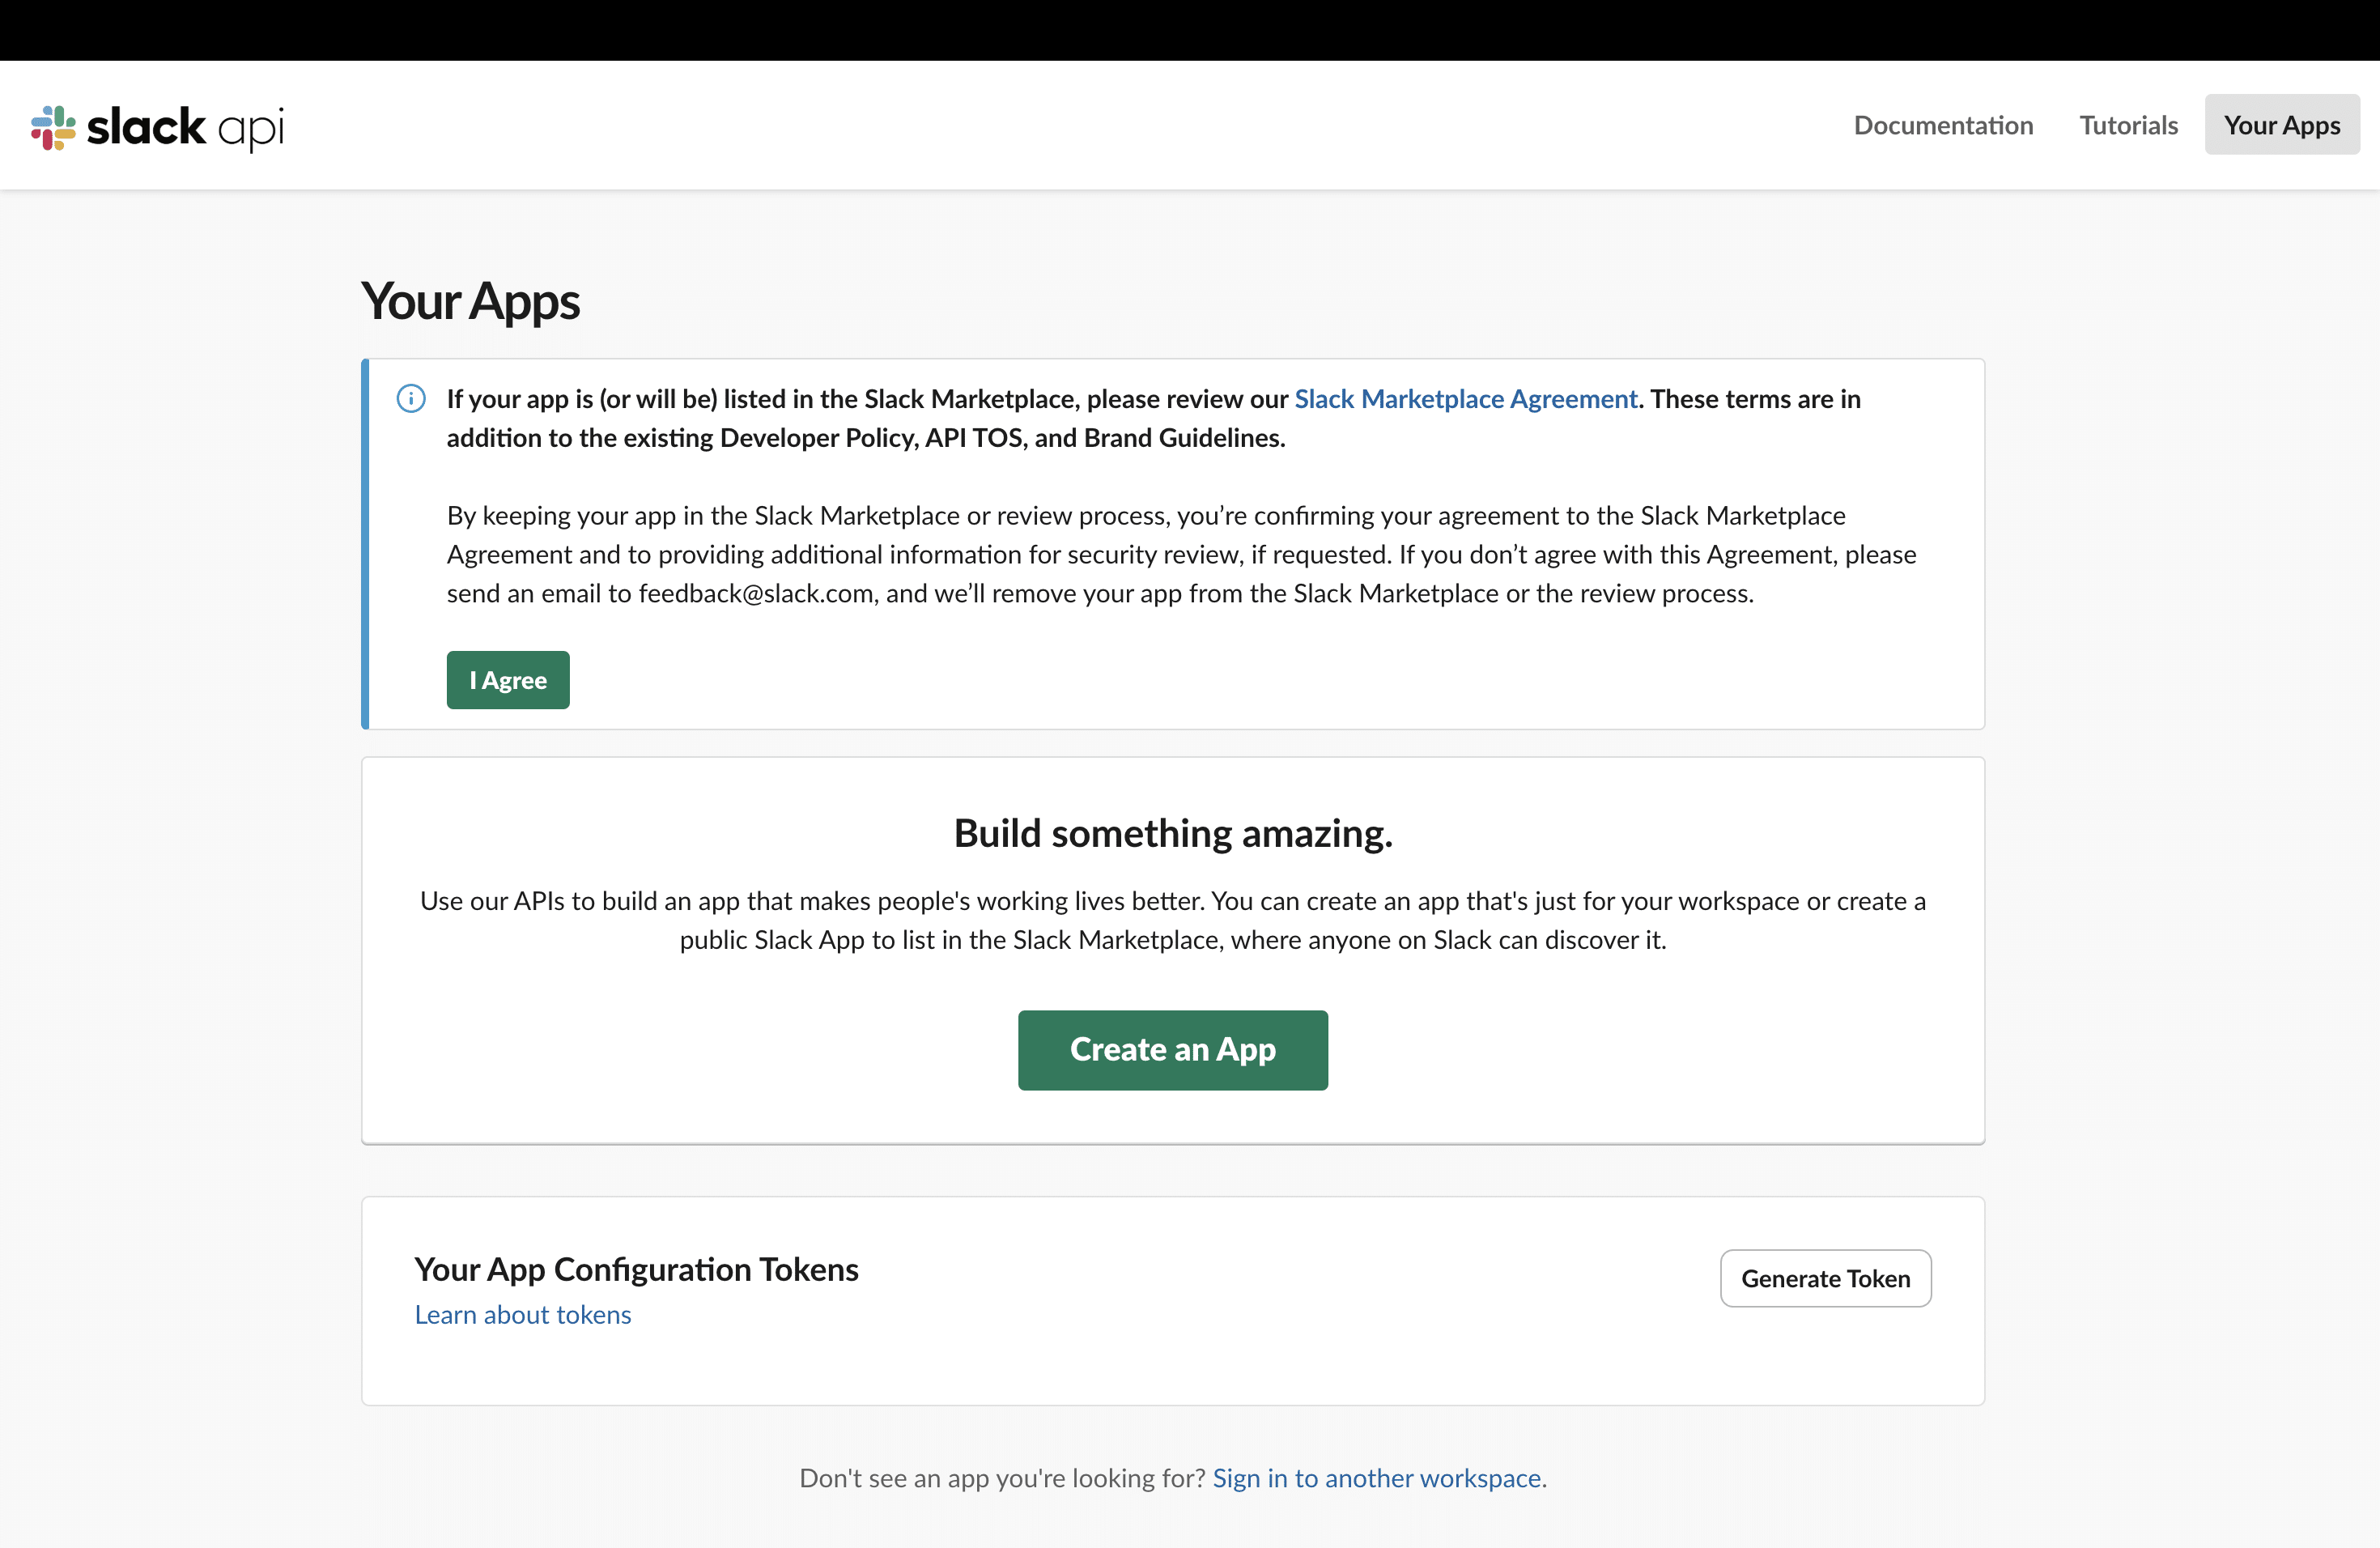
Step 2: Go to the Slack API dashboard and click Create an App (or Create New App if this isn’t your first app).
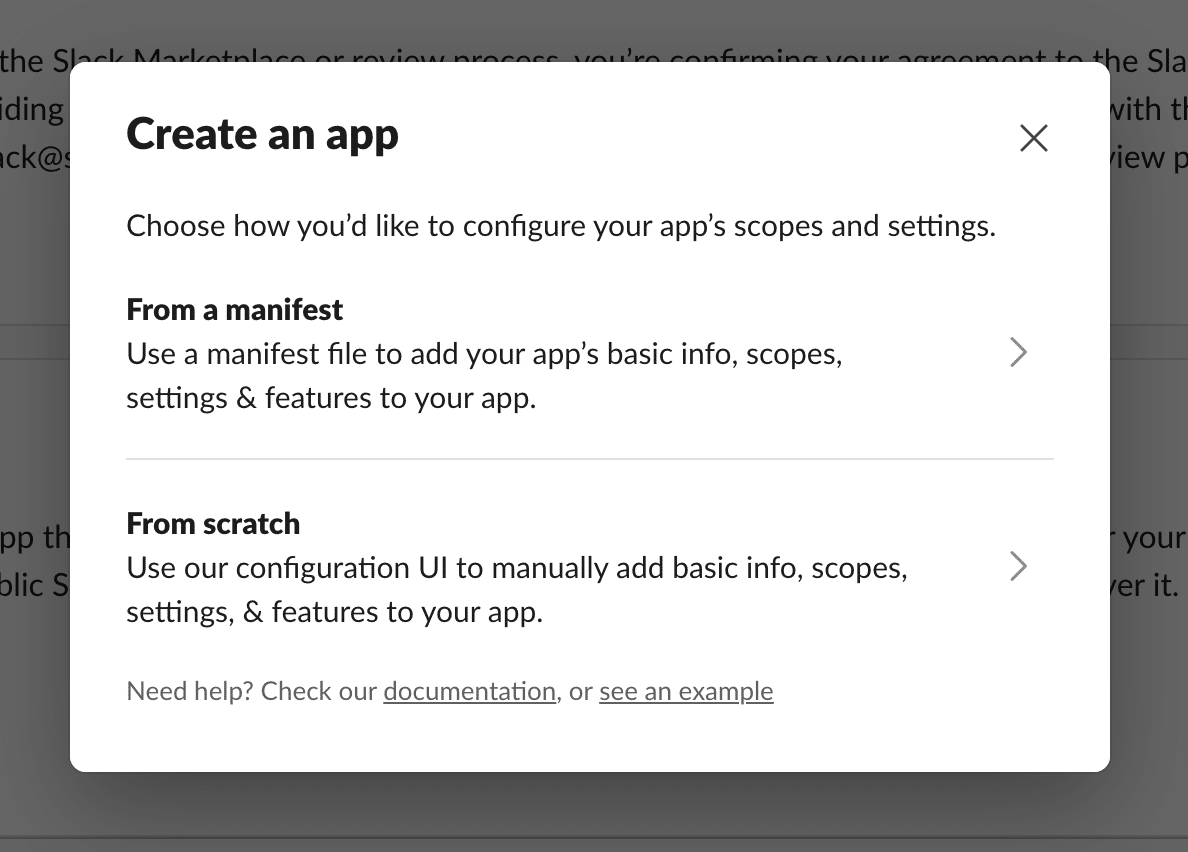
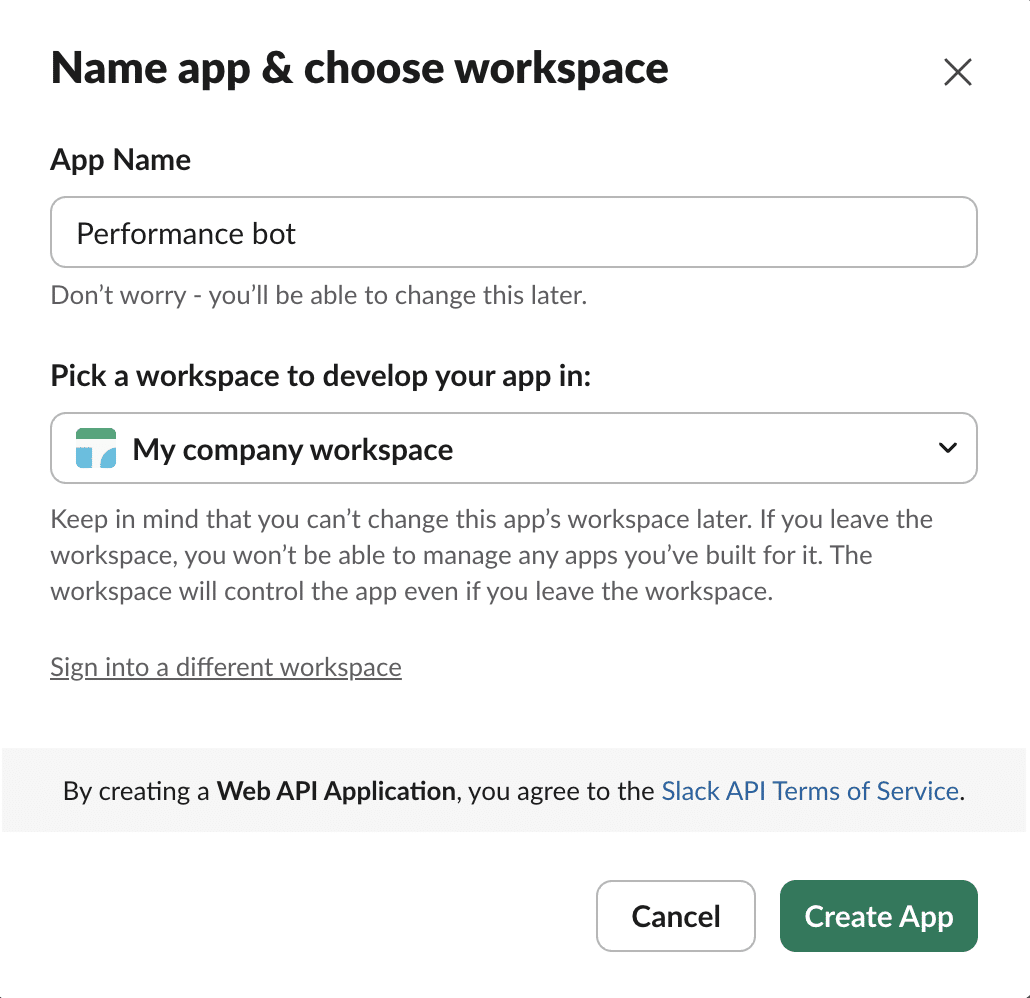
Step 3: You will be asked to configure your app’s scopes and settings. Select From Scratch.
Step 4: Next, give your application a name (e.g., Performance Bot) and select your workspace.
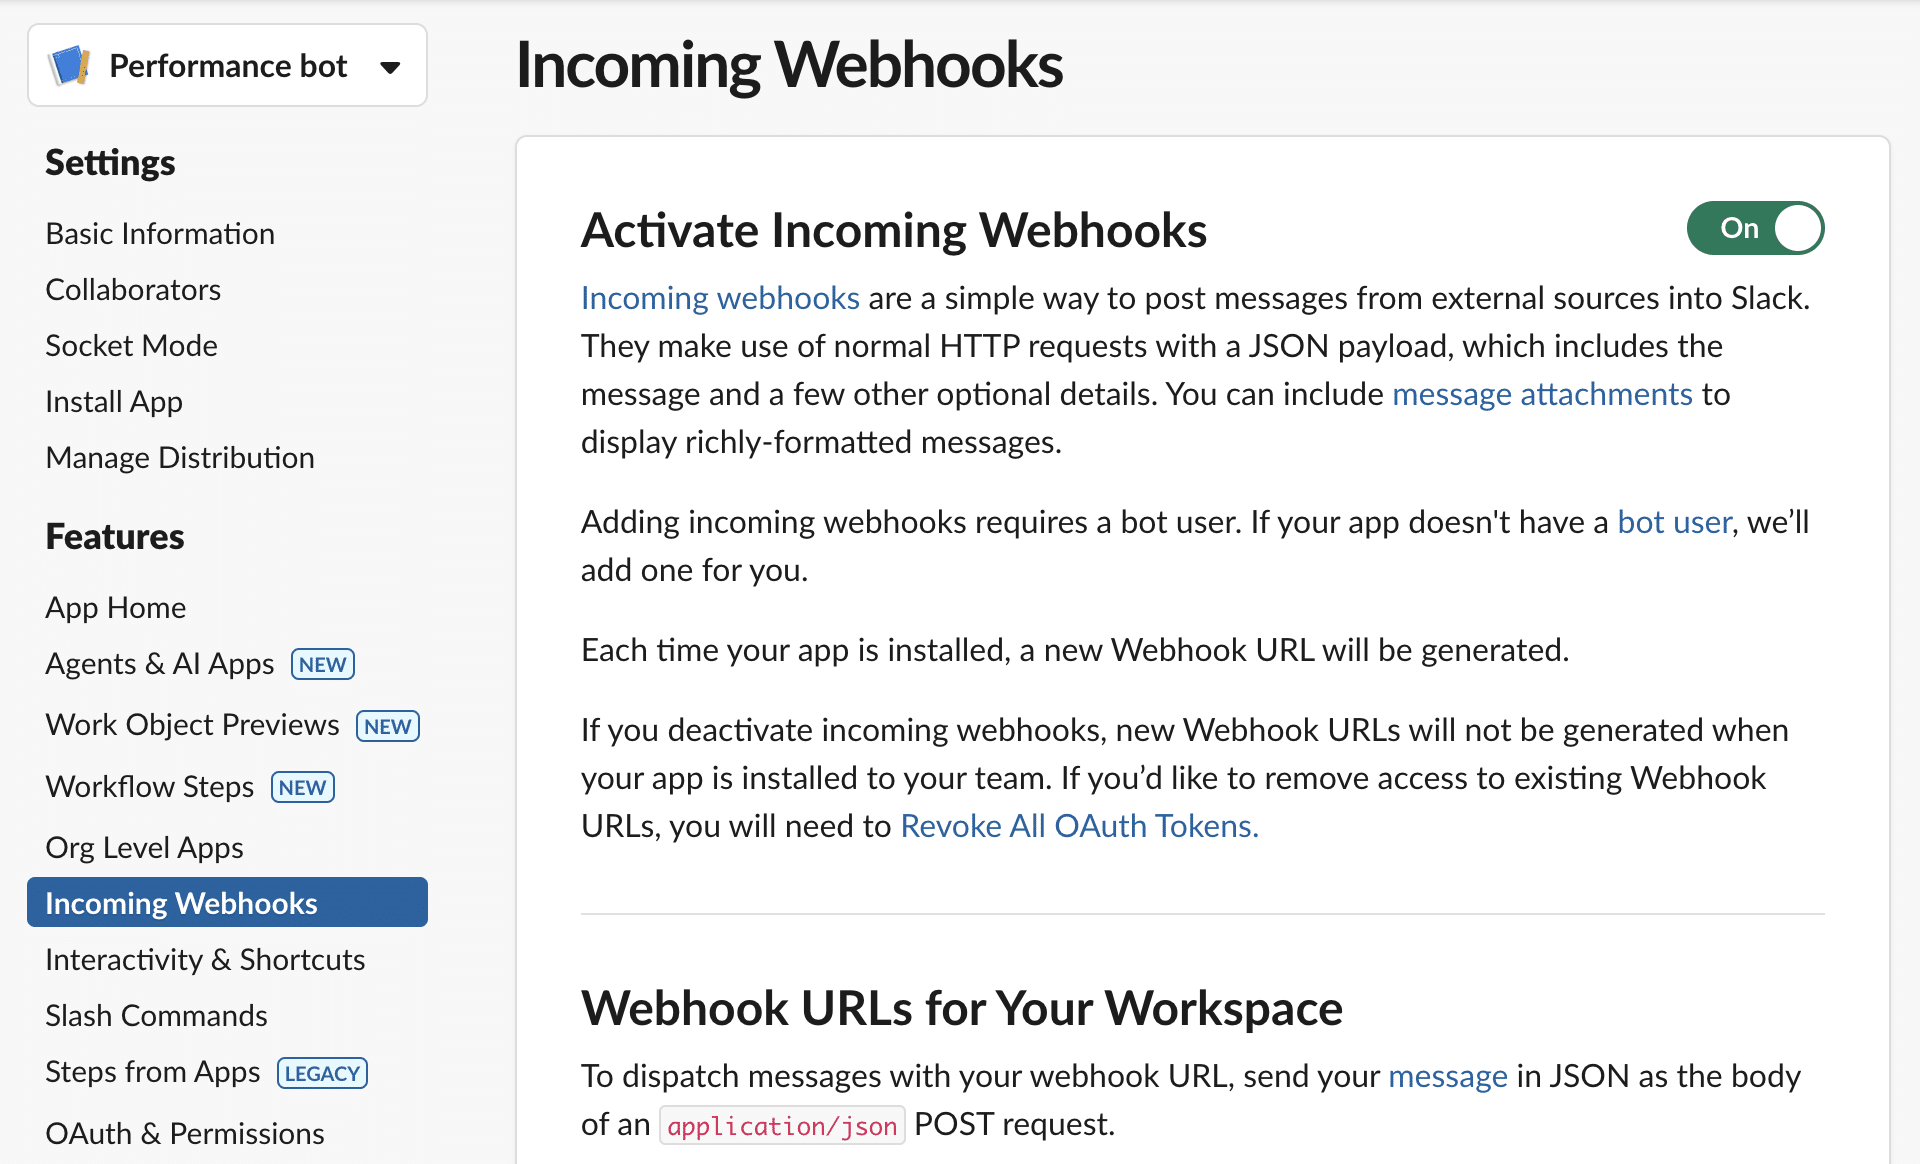
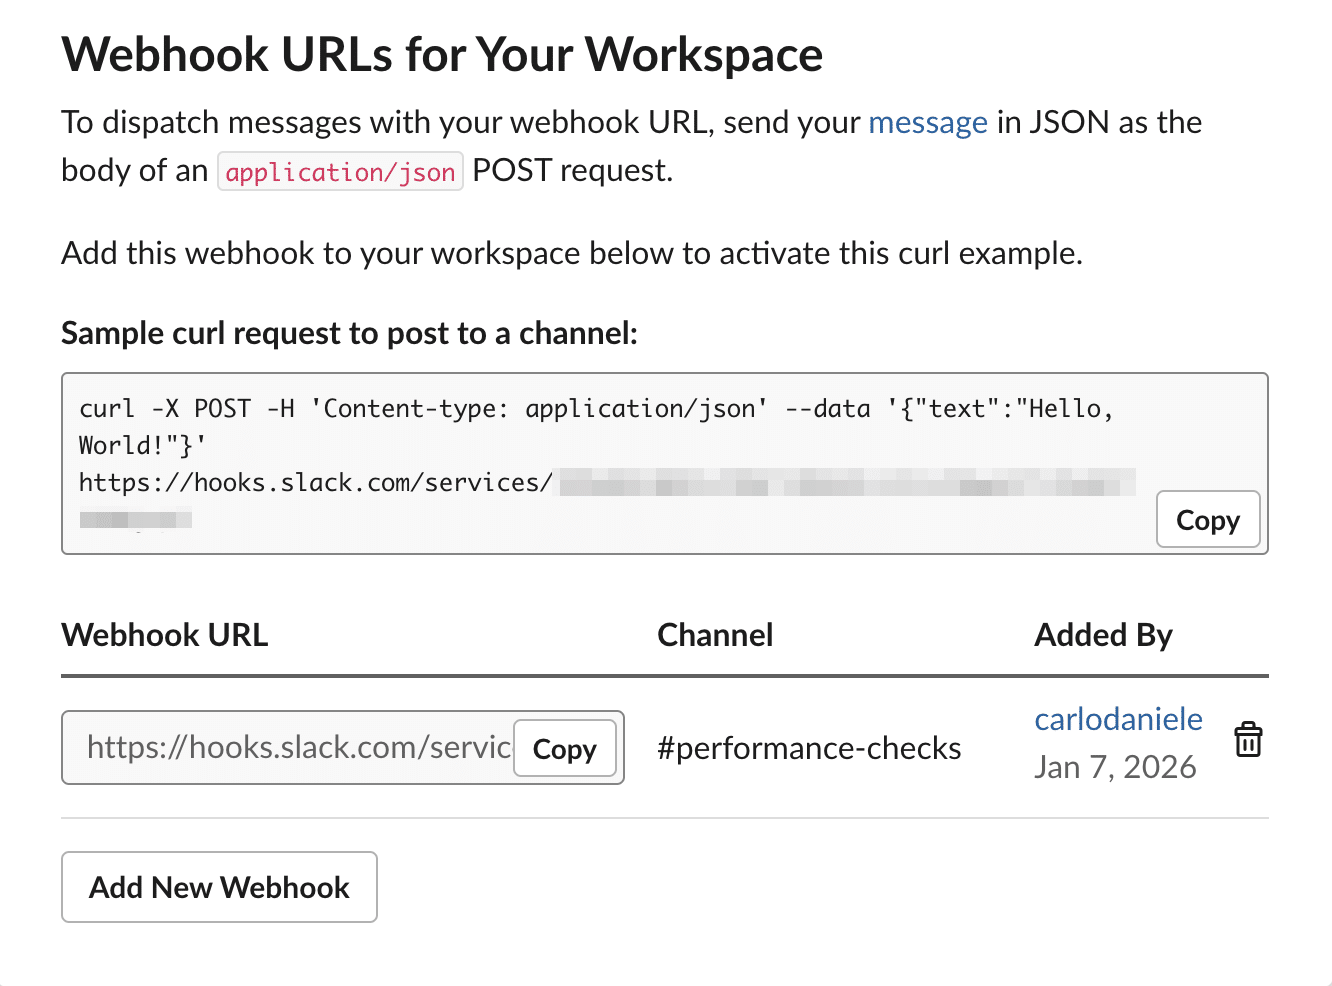
Step 5: Select Incoming Webhooks from the left sidebar, then click On. Next, click Add New Webhook at the bottom of the page.
Step 6: Copy the Webhook URL and save it for future reference.
You now have everything you need to create a script that allows you to automatically share your website’s performance metrics with your team on Slack. It’s time to dive into the code.
A PHP script to automate performance monitoring
The next step is to create a script that communicates with the three aforementioned services in order to automatically monitor the performance of all the agency’s client sites hosted on Kinsta.
Step 1: Script configuration
In your favorite code editor, create a new .php file and add the following code:
<?php

$kinsta_api_key	 = 'YOUR_KINSTA_API_KEY';
$kinsta_company_id  = 'YOUR_COMPANY_UUID';
$google_api_key	 = 'YOUR_GOOGLE_API_KEY';
$slack_webhook_url  = 'YOUR_SLACK_WEBHOOK_URL';

echo "--- STARTING PERFORMANCE MONITORING ---\n";
Replace the placeholders with your actual data that you retrieved earlier.
Step 2: Use the Kinsta API to retrieve a list of company sites
To get the list of sites in your Kinsta account, you need to use Kinsta API v2 and the /sites endpoint.
Here’s how you can access the API via cURL:
// 1. Fetch the list of sites from Kinsta
$url_kinsta = "https://api.kinsta.com/v2/sites?company=" . $kinsta_company_id . "&include_environments=true";
$ch = curl_init($url_kinsta);
curl_setopt($ch, CURLOPT_HTTPHEADER, ['Authorization: Bearer ' . $kinsta_api_key]);
curl_setopt($ch, CURLOPT_RETURNTRANSFER, true);
$res_kinsta = curl_exec($ch);
$data_kinsta = json_decode($res_kinsta, true);
curl_close($ch);

$sites = $data_kinsta['company']['sites'] ?? [];
echo "Found " . count($sites) . " sites to analyze.\n";
Note that we used the query parameter includes_environments=true to retrieve environment details (live and staging).
Next, query the Google PSI API and send the data to the Slack app.
PageSpeed Insights metrics and Slack notifications
Now, you need to send the URL of each retrieved site to the PageSpeed Insights API. When you call the service, PageSpeed Insights runs a performance check and returns an object containing performance metrics. Your script will send this data to the Slack API, which will generate the corresponding messages.
Here’s the code to add to your script:
foreach ($sites as $site) {
$site_label = $site['display_name'];
$primary_domain = "";
// 2. Search the downloaded data directly for the live environment
$environments = $site['environments'] ?? [];
foreach ($environments as $env) {
if ($env['name'] === 'live') {
$raw_domain = $env['primaryDomain'] ?? $env['primary_domain'] ?? null;
$primary_domain = is_array($raw_domain) ? ($raw_domain['name'] ?? "") : $raw_domain;
break;
}
}
if (empty($primary_domain)) {
echo "Skipping $site_label (No Live domain found).\n";
continue;
}
echo "Analyzing $primary_domain... ";
// 3. PageSpeed analysis
$psi_url = "https://www.googleapis.com/pagespeedonline/v5/runPagespeed?url=https://" . urlencode($primary_domain) . "&key=$google_api_key&category=performance&strategy=mobile";
$res_psi = @file_get_contents($psi_url);
if ($res_psi === false) {
echo "PSI Error.\n";
continue;
}
$data_psi = json_decode($res_psi, true);
$score = ($data_psi['lighthouseResult']['categories']['performance']['score'] ?? 0) * 100;
$fcp = $data_psi['lighthouseResult']['audits']['first-contentful-paint']['displayValue'] ?? 'N/A';
$lcp = $data_psi['lighthouseResult']['audits']['largest-contentful-paint']['displayValue'] ?? 'N/A';
// 4. Send rich notification to Slack
$report_link = "https://pagespeed.web.dev/analysis?url=https://" . $primary_domain . "&strategy=mobile";
$slack_msg = [
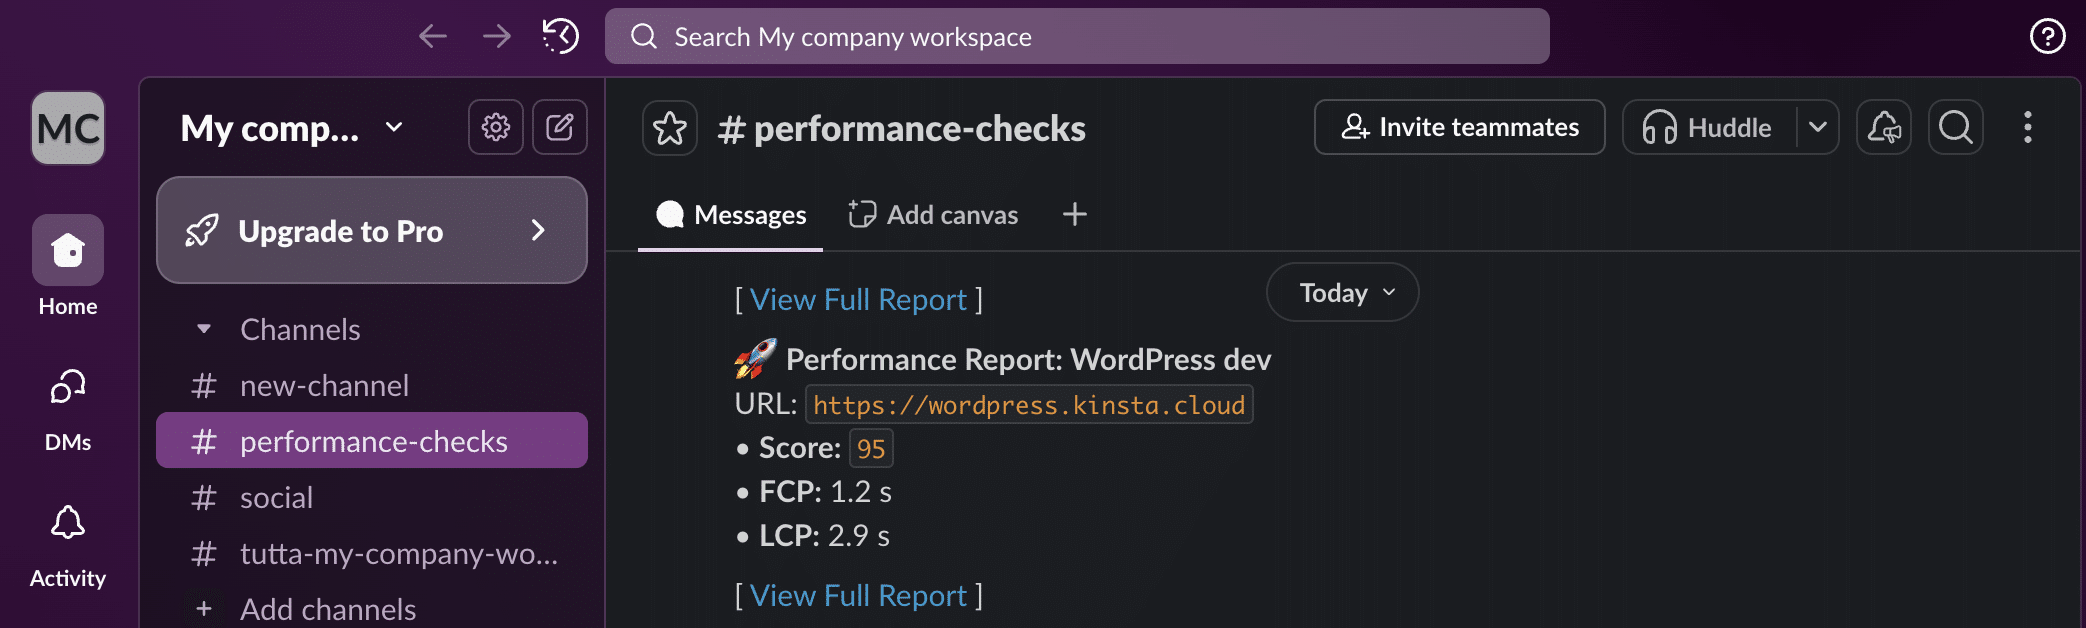
"text" => "🚀 *Performance Report: $site_label*\nURL: `https://$primary_domain` \n\n" .
"• *Score:* `$score` \n" .
"• *FCP:* $fcp \n" .
"• *LCP:* $lcp\n\n" .
"[ <$report_link|View Full Report> ]"
];
$ch = curl_init($slack_webhook_url);
curl_setopt($ch, CURLOPT_POSTFIELDS, json_encode($slack_msg));
curl_setopt($ch, CURLOPT_HTTPHEADER, ['Content-Type: application/json']);
curl_setopt($ch, CURLOPT_RETURNTRANSFER, true);
curl_exec($ch);
curl_close($ch);
echo "Done.\n";
}
echo "--- MONITORING COMPLETED ---\n";In short, this code iterates over the elements of the $sites array. For each element of the array, it fetches Core Web Vitals and posts a message to Slack.
Testing the script
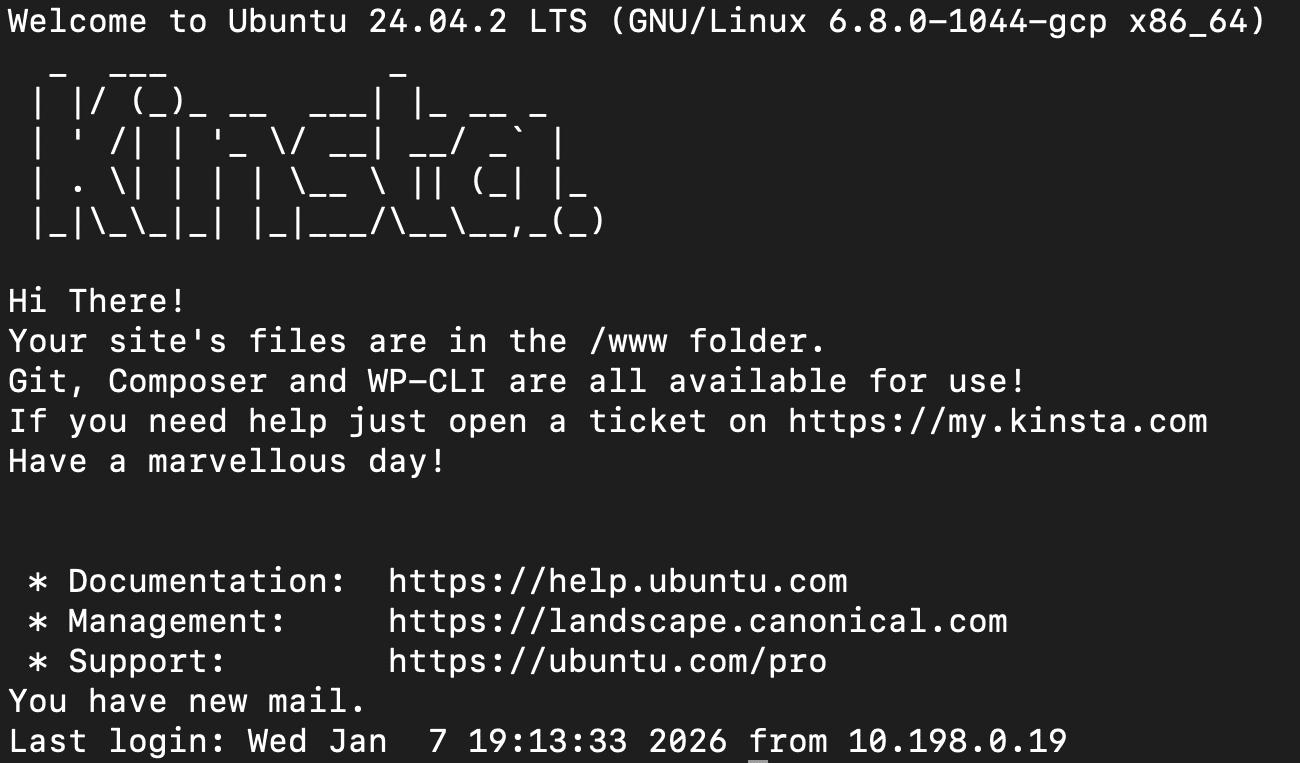
You can connect with your container using SSH and run your PHP script directly from the terminal. This allows you to quickly troubleshoot your script and receive performance results in Slack in real-time.
In MyKinsta, navigate to WordPress Sites > Site Name. Scroll down to the Primary SFTP/SSH user section and find the SSH terminal command field. It should look something like this:
ssh wordpress@host-name -p port-numberCopy the SSH terminal command and paste it into the terminal. You’ll be prompted to enter the password provided in the same section. Press Enter, and you will be connected to your container environment.
Now you can test your code. From the command line, navigate to the folder where you uploaded the script. In this example, we used the public folder:
cd publicNext, use the following command to run the script:
php performance-monitor.phpThe script echoes a message for each action it performs. Once it has finished running, you should see a list of messages similar to the following:
--- STARTING FULL PERFORMANCE MONITORING ---
Found 5 sites to analyze.
Analyzing site1.kinsta.cloud... Done.
Analyzing site2.kinsta.cloud... Done.
Analyzing site3.kinsta.cloud... Done.
Analyzing example.com... Done.
Analyzing site5.kinsta.cloud... Done.
--- MONITORING COMPLETED ---
If PSI fails to respond in a timely manner, the script moves on to the next site. In this case, you will see a message that looks like this:
--- STARTING FULL PERFORMANCE MONITORING ---
Found 5 sites to analyze.
Analyzing site1.kinsta.cloud... Done.
Analyzing site2.kinsta.cloud... Done.
Analyzing site3.kinsta.cloud... Done.
Analyzing example.com... PSI Error.
Analyzing site5.kinsta.cloud... Done.
--- MONITORING COMPLETED ---
As the script processes Google PSI responses, it sends a message to your Slack channel. For each site successfully analyzed by PSI, you should see a Slack message pretty similar to the following:
Awesome. You’ve just created your automated monitoring system.
Now, you may want to adjust it to fit your specific needs. For instance, if you manage hundreds of customer sites, sending a Slack message for each site could be inefficient.
You could, however, set up a condition that tests the site’s overall score and sends a message to the Slack channel only if the value returned by the PSI API is below a specified threshold (e.g., 90). The following code would do the trick:
$threshold = 90;
// 4. Send rich notification to Slack
// The alert is triggered only if the current score is strictly lower than our limit.
if ($score < $threshold) {
echo "Score below threshold. Sending Slack alert... ";
$report_link = "https://pagespeed.web.dev/analysis?url=https://" . $primary_domain . "&strategy=mobile";
// Prepare the Slack message
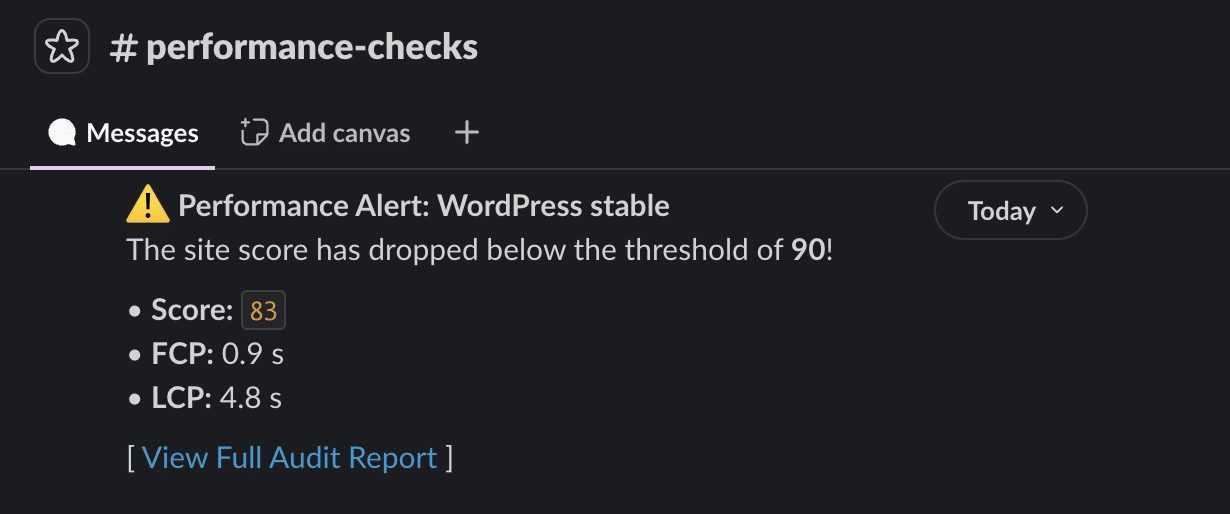
$slack_msg = [
"text" => "⚠️ *Performance Alert: $site_label*\nThe site score has dropped below the threshold of *$threshold*!\n\n" .
"• *Score:* `$score` \n" .
"• *FCP:* $fcp \n" .
"• *LCP:* $lcp\n\n" .
"[ <$report_link|View Full Audit Report> ]"
];
// Execute the CURL request to the Slack Webhook
$ch = curl_init($slack_webhook_url);
curl_setopt($ch, CURLOPT_POSTFIELDS, json_encode($slack_msg));
curl_setopt($ch, CURLOPT_HTTPHEADER, ['Content-Type: application/json']);
curl_setopt($ch, CURLOPT_RETURNTRANSFER, true);
curl_exec($ch);
curl_close($ch);
echo "Done.\n";
} else {
echo "Score is optimal ($score). No alert sent.\n";
}Update your script, save the file, and upload it again. Then, connect to the server via SSH, navigate to the appropriate folder, and run the following command again:
php performance-monitor.phpIf you chose a different name for your script, modify the command accordingly.
The terminal should now show a sequence of messages similar to the following:
--- STARTING FULL PERFORMANCE MONITORING ---
Found 5 sites to analyze.
Analyzing site1.kinsta.cloud... Score is optimal (100). No alert sent.
Analyzing site2.kinsta.cloud... Score is optimal (95). No alert sent.
Analyzing site3.kinsta.cloud... Score is optimal (100). No alert sent.
Analyzing example.com... Score below threshold. Sending Slack alert... Done.
Analyzing site5.kinsta.cloud... Score below threshold. Sending Slack alert... Done.
--- MONITORING COMPLETED ---
In Slack, you will receive a message for each site with an overall score below the 90 threshold.
That’s great, isn’t it? But you can optimize the process even further. Wouldn’t you like to save even more time by running the script automatically at set intervals without needing to access your command-line tool?
Yes, you guessed it. You need a cron job.
Automate the process using a cron job
There are several ways to set up a cron job on Kinsta. Although you can do it through WordPress, Kinsta users can add server cron jobs to each site container.
To set up a cron job on Kinsta, create a cron command and add it to your container’s crontab file via SSH.
For example, you could use a command like the following:
0 10 * * * /usr/bin/php /www/yoursite_123/public/your-script.php >> /www/yoursite_123/performance_monitor.log 2>&1Here is what this command does:
0 10 * * *sets the script to be executed every day at 10 AM./usr/bin/phpis the absolute path of the PHP interpreter on the server./www/yoursite_123/public/your-script.phpis the absolute path of the script. Be sure to check the path and the actual name of your script on the server.- The
>>operator (append redirection) appends new data to the end of the specified file. /www/yoursite_123/performance_monitor.logindicates the file in which all text printed by the script will be saved.- The
2>&1command instructs the server to direct errors to the same file.
We will not discuss cron commands in further detail here. You can refer to the documentation from The Open Group or use a crontab tool, such as Crontab Generator or Cronitor.
After building your cron command, you need to add it to your site container. You can either ask our support team to do this for you or do it yourself via SSH. If you choose the latter, start by typing the following command:
crontab -eYou will be asked to select an editor. Choose “nano” if you are unsure.
In the editor, paste your command at the end of the file. Save the file and return to the command line. You should then see a message confirming that your changes were completed successfully.
crontab installing new crontabThat’s it. The script will now run at set intervals and send a message to the Slack channel of your choice with the requested metrics for your client sites that are performing poorly.
Scaling up: What else can you automate with the Kinsta API?
The script presented in this article can be customized and expanded further. For instance, you could integrate other services, such as Trello or Asana, export data, or send periodic email digests to clients.
Automating your performance checks on your clients’ sites is just the beginning. Integrating the Kinsta API with your team’s daily tools can transform your agency’s operations by eliminating manual site management and maintenance tasks, improving efficiency, and reducing operating costs. You’ll also improve service quality, reduce delivery times, and ensure the best possible experience for your customers.
The Kinsta API enables you to automate various tasks, including creating staging environments, selectively pushing changes from staging to production, accessing error logs, clearing the site cache, managing backups, and more. These features make managing WordPress sites quick and easy, allowing you to scale with confidence.
Ready to take your agency to the next level? Explore our plans or contact our sales team to discuss your specific needs.
Happy scaling!

Carlo is a passionate lover of webdesign and front-end development. He has been playing with WordPress for more than 20 years, also in collaboration with Italian and European universities and educational institutions. He has written hundreds of articles and guides about WordPress, published both on Italian and international websites, as well as on printed magazines. You can find him on LinkedIn.

