
We use Google PageSpeed Insights all the time, and we recommend it to pretty much everyone who manages a WordPress site.
But we’ve been hosting websites long enough to notice something: a lot of the advice about PageSpeed Insights treats it like a grading system, and people optimize toward the number instead of what the number is supposed to represent.
The score isn’t useless, but it’s incomplete by design. Lighthouse runs in a simulated environment with CPU throttling and a fixed network profile. It can’t see your server, your caching layer, or how your database responds under real load.
This post covers what the recommendations actually mean, where they fall short, and what to do when you’ve checked every box and your site still feels slow.
What Is Google’s PageSpeed Insights?
Google PageSpeed Insights is a tool used for testing website performance. You can enter any URL and have it analyzed.

Google then provides an overall score out of 100 for the website you’ve tested, based on several performance optimization best practices.
Along with this result, you’ll also see several recommendations from Google on how to improve your performance (and therefore, your PageSpeed Insights score as well).
As of 2018, PageSpeed Insights scores are calculated via Lighthouse, Google’s open source, automated tool for improving the overall quality of web pages. This platform can evaluate all sorts of factors, including performance, accessibility, progressive web apps, and more.
The Truth About Scoring 100/100 in Google PageSpeed Insights
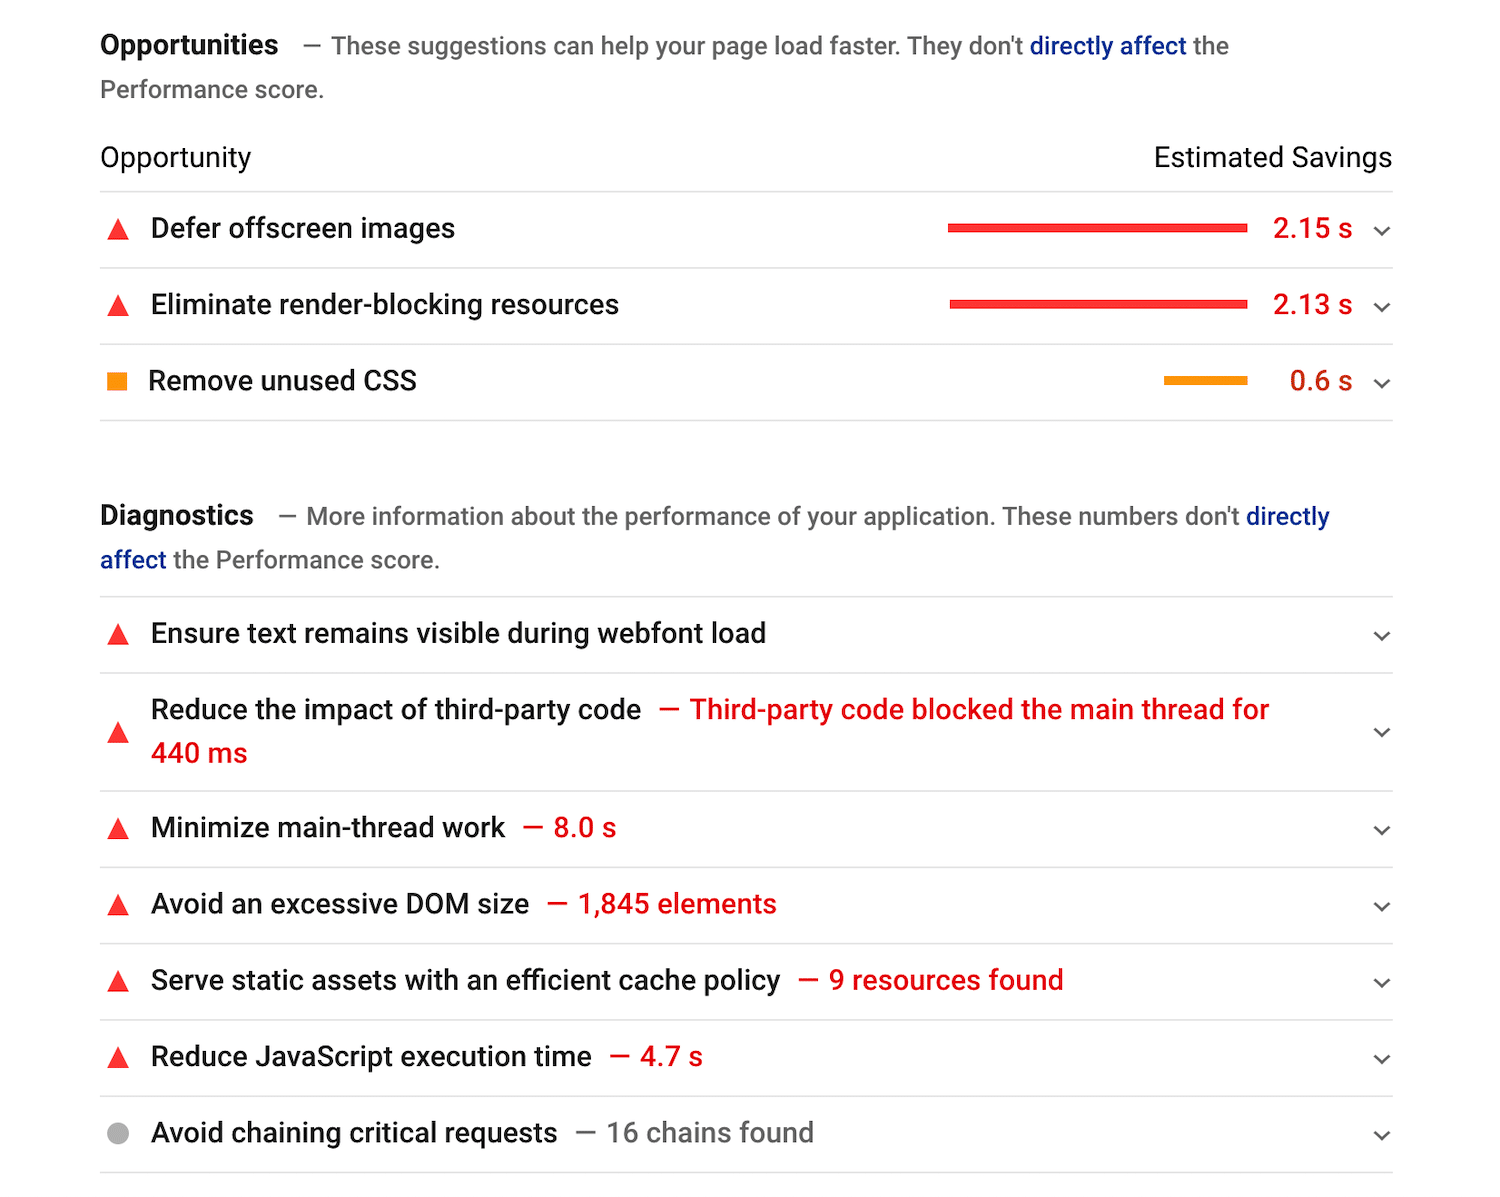
As we mentioned at the beginning of this post, we see many site owners and developers who become obsessed over achieving a perfect PageSpeed Insights score. Unfortunately, those folks tend to overlook the more important aspect of the test’s results: the recommendations.
While you should certainly strive to improve your website’s loading times as much as possible, getting a 100/100 in Google PageSpeed Insights isn’t actually that important. For starters, it’s not even the be-all-end-all test for performance.
Unlike PageSpeed Insights, Pingdom Tools enables you to test your site’s performance from various locations:
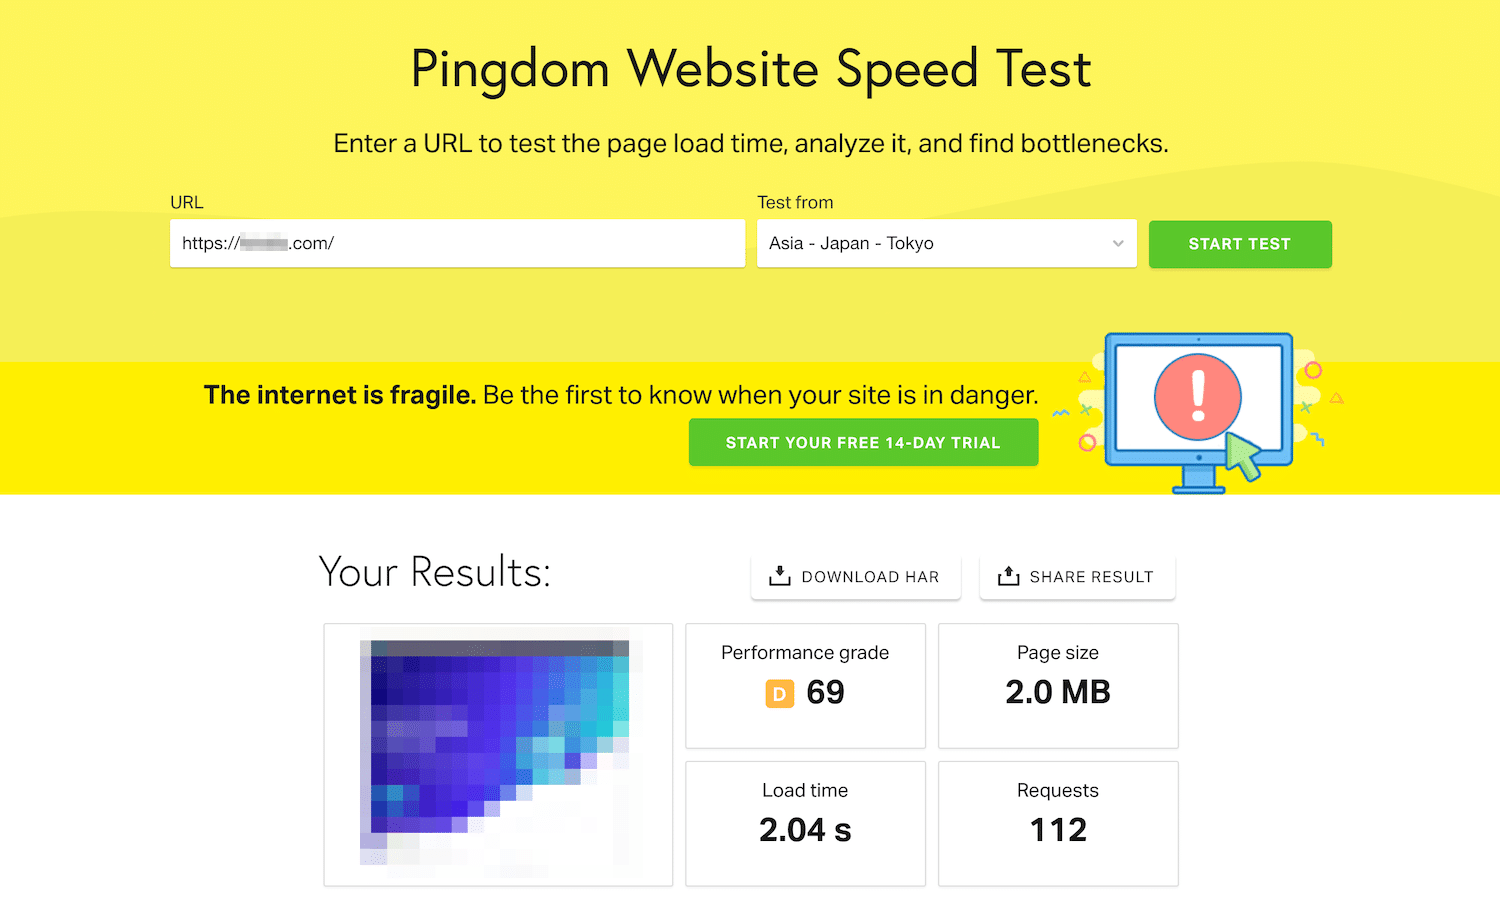
You can also run tests on platforms such as GTmetrix (which combines your scores from PageSpeed Insights and YSlow) and WebPageTest. Chances are, your scores across these different tools won’t match exactly, which shows you how arbitrary these numbers can be.
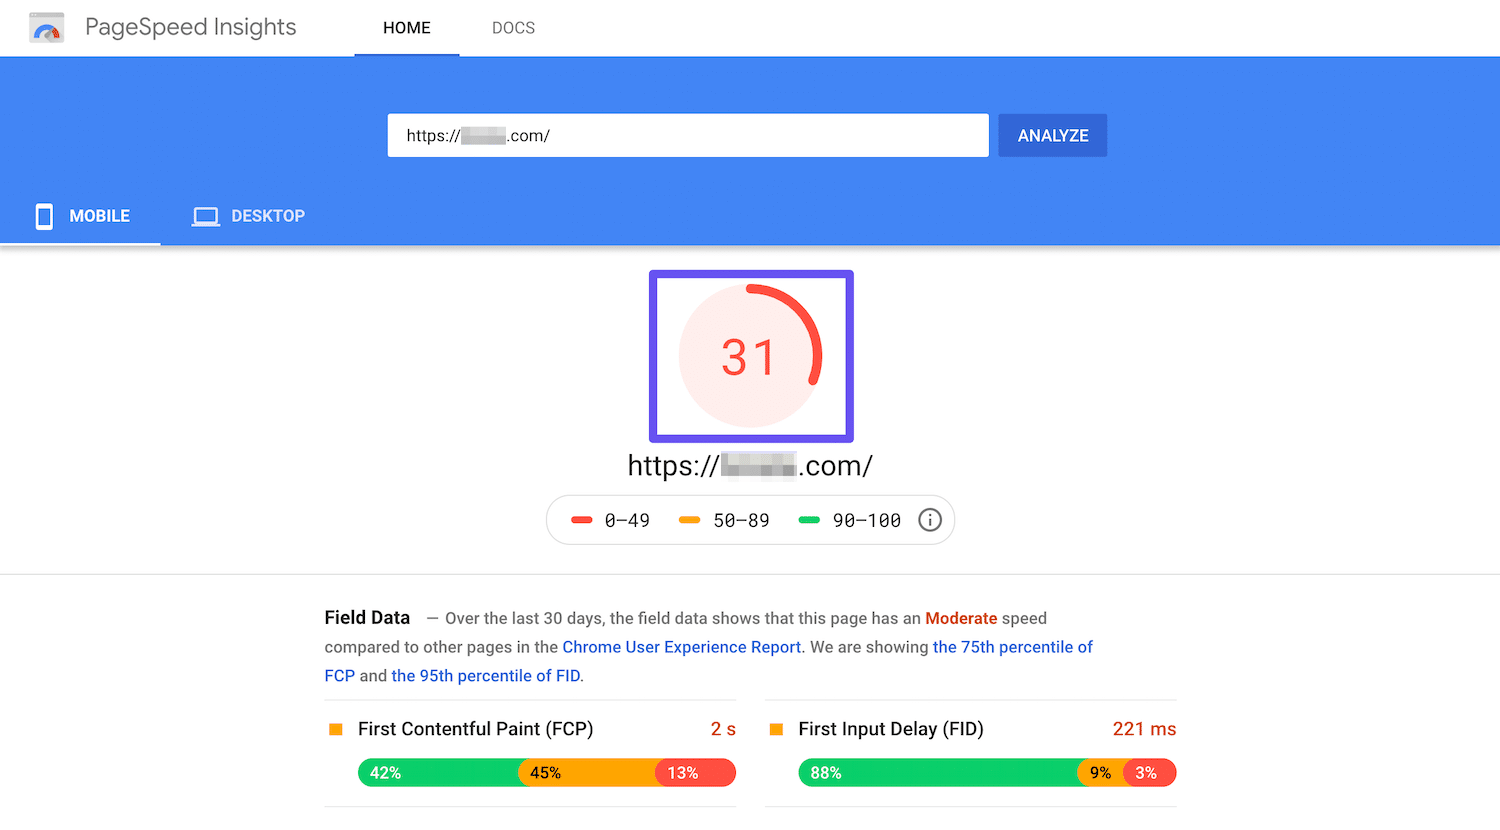
What really matters is the actual speed of your website. To put it into perspective, we’ve seen sites with average loading times of under 500 milliseconds (which is extremely fast!) that don’t have a 100/100 score on PageSpeed Insights. We’ve also seen 98/100 sites that feel sluggish on a real phone on a real connection.
Part of this is how Lighthouse works. It simulates a mid-range Android device with throttled CPU and a slow 4G connection. That setup will penalize certain legitimate optimizations and reward others that don’t actually matter much for your actual traffic. A score is a score in that specific simulated context. It’s not a measurement of what your visitors experience.
The other factor that should influence your approach to speed optimization is the perceived performance of your site. Your visitors don’t care what your Google PageSpeed Insights score is. They just want to be able to view your content as quickly as possible.
The real purpose of testing your site’s performance with Google PageSpeed Insights isn’t to achieve a high score. Instead, it’s to find problem spots on your site, so that you can optimize them and decrease both your actual and perceived loading times.
How Does Google Use PageSpeed Insights?
In addition to influencing your site’s User Experience (UX), performance also plays a role in SEO. Given that PageSpeed Insights is run by the world’s largest and most popular search engine, it stands to reason that your score might have some effect on your Search Engine Results Page (SERP) rankings (at least on Google itself).
The reality is that Google does use PageSpeed Insights to determine rankings – kind of. Site speed is a ranking factor, plain and simple. Your performance test score can give you a pretty good idea of where you stand on that front.
However, Google takes into consideration more than just the number in the circle at the top of your PageSpeed results. Hitting a 100/100 won’t guarantee you a top spot on the SERPs.
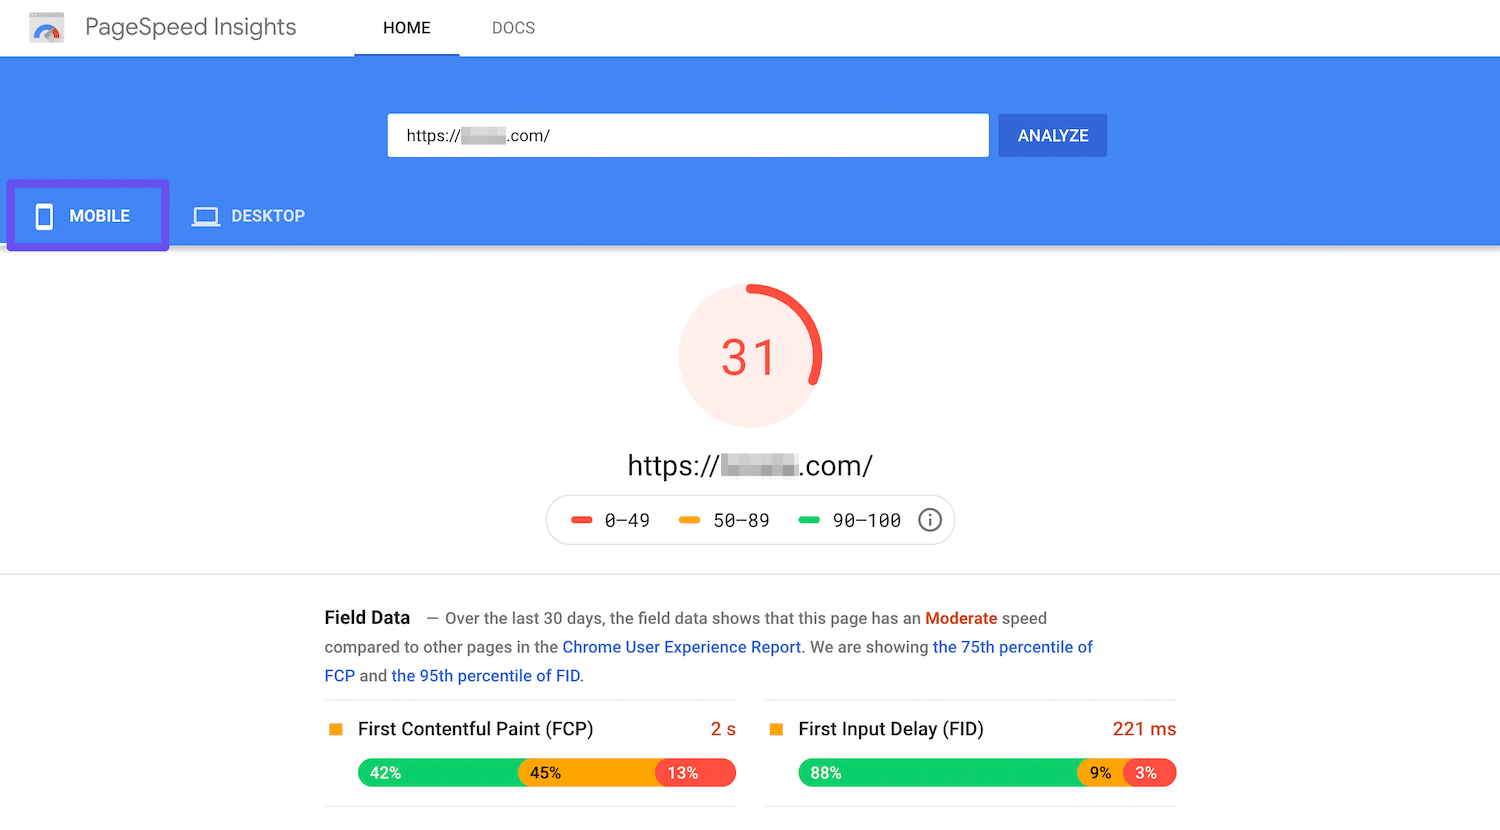
With that said, you can still put your PageSpeed Insights results to work when improving your SEO. For example, since 2018, mobile page speed has been a ranking factor for Google. You’ll notice that your performance test provides data for both the desktop and mobile versions of your site:
Since more than 73 percent of mobile internet users claim they’ve encountered a site that takes too long to load, the information in the Google PageSpeed Insights Mobile tab is invaluable. Using the recommendations here to decrease loading times on smartphones and other devices should give you a competitive edge.
Google PageSpeed Insights Recommendations (24 Ways to Improve Performance)
We’ve talked a lot about Google PageSpeed Insights’ recommendations in this post. They’re the real meat of your performance test results, and far more valuable than your actual score. That’s why we’ve dedicated the rest of this post to them.
1. Eliminate Render-Blocking Resources
One of the more common recommendations from Google PageSpeed Insights is to Eliminate render-blocking resources:

This is referring to JavaScript and CSS scripts that are preventing your page from loading quickly. The visitor’s browser has to download and process these files before it can display the rest of the page, so having a lot of them ‘above the fold’ can negatively impact your site’s speed.
You can learn more about this issue in our guide to eliminating render-blocking scripts. As far as Google is concerned, there are two solutions you should consider:
- If you don’t have a lot of JavaScript or CSS, you can inline them to get rid of this warning. This process refers to incorporating your JavaScript and/or CSS into your HTML file. You can do this with a plugin like Autoptimize. However, this is really only valid for very small sites. Most WordPress sites have enough JavaScript that this method could actually slow you down.
- The other option is to defer your JavaScript. This attribute downloads your JavaScript file during HTML parsing, but only executes it after the parsing is complete. Also, scripts with this attribute execute in order of appearance on the page.
You’ll find a list of the resources that are most affected by this issue below the recommendation in your PageSpeed results.
Check out this video to find out more about how to eliminate render-blocking resources:
2. Avoid Chaining Critical Requests
The concept of chaining critical requests has to do with the Critical Rendering Path (CRP) and how browsers load your pages. Certain elements – such as the JavaScript and CSS we discussed above – must be loaded completely before your page becomes visible.
As part of this suggestion, Google PageSpeed Insights will show you the request chains on the page you’re analyzing:

This diagram will show you the series of dependent requests that must be fulfilled before your page becomes visible. It will also tell you the size of each resource. Ideally, you want to minimize the number of dependent requests, as well as their sizes.
Several methods for accomplishing these goals are covered by other recommendations discussed in this post, including:
- Eliminating render-blocking resources
- Deferring offscreen images
- Minifying JavaScript and CSS
Additionally, you can optimize the order in which assets load, in order to shorten the CRP. This means moving above-the-fold content to the top of your HTML file. You can learn more about optimizing the CRP in our post, “How to Optimize the Critical Rendering Path in WordPress”.
It’s important to note that there’s not a magic number of critical request chains that you need to work down to. Google PageSpeed Insights doesn’t count this audit as ‘passed’ or ‘failed’, unlike many of its other recommendations. This information is simply made available to help you improve loading times.
3. Keep Request Counts Low and Transfer Sizes Small
The more requests browsers have to make to load your pages, and the larger the resources your server returns in response, the longer your website takes to load. Therefore, it makes sense that Google would recommend that you minimize the number of required requests and decrease the size of your resources.
Like the Avoid chaining critical requests recommendation, this one does not result in a ‘pass’ or ‘fail’. Instead, you’ll simply see a list of the number of requests made and their sizes:

There’s no ideal number of requests or maximum sizes to keep in mind. Instead, Google recommends that you set those standards for yourself by creating a performance budget. This is a set of defined goals that may be related to aspects such as:
- Maximum image sizes
- The number of web fonts used
- How many external resources you call to
- The size of scripts and frameworks
Creating a performance budget gives you a set of standards to hold yourself accountable to. When you go over your budget, you can then make decisions about whether to eliminate or optimize resources to stick to your predetermined guidelines. You can learn more about creating one in Google’s own guide.
4. Minify CSS
CSS files are often larger than they need to be, in order to make them easier for humans to read. They might include various carriage returns and spaces that aren’t necessary for computers to understand their contents.
Minifying your CSS is the process of condensing your files by eliminating unnecessary characters, spaces, and duplications. Google recommends this practice because it reduces your CSS file sizes, and therefore can improve loading speed:

To minify your CSS files, we recommend using a plugin such as Autoptimize or WP Rocket.
5. Minify JavaScript
Just as you can reduce CSS file size through minification, the same applies to your JavaScript files:

Autoptimize or WP Rocket can handle this task for your WordPress site as well.
6. Remove Unused CSS
Any code in your stylesheet is content that has to be loaded in order for your page to become visible to users. If there’s CSS on your site that isn’t actually useful, it’s putting an unnecessary drain on your performance.
That’s why Google recommends removing any unused CSS:

The solution here is essentially the same as that for eliminating render-blocking CSS. You can inline or defer styles in whatever way makes the most sense for your pages. You can also use a tool such as Chrome DevTools to find unused CSS that needs to be optimized.
7. Minimize Main-Thread Work
The ‘main thread’ is the primary element of a user’s browser that’s responsible for turning code into a web page that visitors can interact with. It parses and executes HTML, CSS, and JavaScript. Additionally, it’s in charge of handling user interactions.
This means that, when the main thread is working through your site’s code, it cannot also handle user requests. If your site’s main-thread work takes too long, this can result in poor UX and slow page loading times.
Google PageSpeed will flag pages that take longer than four seconds to complete main-thread work and present a usable web page:

Some of the methods used for reducing main-thread work have already been covered in other sections of this post, including:
- Minifying your code
- Removing unused code
- Implementing caching
However, you may also want to consider code splitting. This process involves breaking up your JavaScript into bundles that execute when they’re needed, instead of requiring browsers to load all of them before the page becomes interactive.
Webpack is often used to implement code splitting. Note that this is a fairly advanced technique and not one that beginners should usually undertake alone.
8. Reduce JavaScript Execution Time
JavaScript execution is often the most prominent contributor to main-thread work. PageSpeed Insights has a separate recommendation to alert you if this task is having a significant impact on your site’s performance:

The methods suggested above for reducing main-thread work should also resolve this warning in your PageSpeed results.
9. Reduce Server Response Times (TTFB)
Server response time is the one recommendation where your host matters more than anything you can configure in WordPress.
Time to First Byte (TTFB) is determined server-side: the time it takes for your server to receive a request, process it, and start sending a response. Plugins don’t fix slow TTFB. A CDN helps, but only if the origin response is already fast.
While this isn’t the same as your overall site speed, having a low TTFB is understandably good for your site’s performance. Therefore, reducing server response times is among Google PageSpeed Insights’ recommendations. If you’re able to achieve a low TTFB, you’ll see this message under Passed audits:

The benchmarks Google uses here are reasonable: under 200ms is good, 200-500ms is acceptable, over 600ms is a problem worth taking seriously. In practice, a WordPress site hitting 600ms+ TTFB on uncached requests is usually a database or server configuration issue, not a code issue.
Common causes include a slow or overloaded server, no object caching, unoptimized database queries from bloated plugins, and missing full-page caching. If you’re on Kinsta, full-page caching is handled at the server level through Nginx. Cached responses typically serve in under 50ms.
If you’re on other infrastructure, plugins like W3 Total Cache or WP Rocket can help, but they’re working around a limitation rather than solving it at the root. The most reliable path to a consistently low TTFB is a host that takes caching seriously at the infrastructure level, not the application level.
Our post on TTFB is an excellent resource for more details on optimization in this area.
10. Properly Size Images
Media files such as images can be a real drag on your site’s performance. Properly sizing them is a simple way to reduce your loading times:

If your page includes images that are larger than they need to be, CSS is used to resize them appropriately. This takes longer than simply loading the images at the right size initially, therefore impacting your page’s performance.
To fix this, you can either upload images at the proper sizes, or use ‘responsive images’. This involves creating differently-sized images for various devices.
You can do this using the srcset attribute, which is added to <img> tags to specify alternative image files at different sizes. Browsers can read this list, determine which option is best for the current screen, and deliver that version of your image.
For example, say that you have a header image and you want to make it responsive. You could upload three versions of it at 800, 480, and 320 pixels wide. Then you would apply the srcset attribute, like this:
<img srcset="header-image-800w.jpg 880w,
		Header-image-480w.jpg 480w,
		Header-image-320w.jpg 320w"
	sizes="(max-width: 320px) 280px,
		(max-width: 480px) 440px,
		800px"
	src="header-image-800w.jpg">
The srcset attribute specifies the different available files, and the sizes attribute tells browsers which one should be used based on the current screen size.
11. Defer Offscreen Images
The process of deferring offscreen images is more commonly known as ‘lazy loading’. This means that instead of making the browser load every image on a page before displaying the above-the-fold content, it will only load the ones that are immediately visible.
Less loading before the page becomes visible means better performance, which is why Google recommends this method:

There are several WordPress plugins made specifically for lazy loading, including a3 Lazy Load and Lazy Load by WP Rocket. Various image and performance optimization plugins such as Autoptimize also have lazy loading features. Check out our complete guide on Lazy Loading Images and Videos on WordPress.
12. Efficiently Encode Images
As we mentioned earlier in this post, images have a significant impact on your site’s performance. One of the most basic optimization best practices you may want to consider is compression, which can help reduce your file sizes so they’ll load faster. It’s also the primary method for following Google’s recommendation to Efficiently encode images:

The key is achieving the smallest possible file sizes, without sacrificing the quality of the images themselves. Plugins such as Imagify and Smush can help with this task. You can learn more about them in our guide to image optimization.
Other recommendations that influence whether you ‘pass’ or ‘fail’ the Efficiently encode images audit include:
- Serving images at the correct size
- Implementing lazy loading (deferring offscreen images)
- Converting images to next-gen file formats, such as WebP
- Using video formats for animated content, such as GIFs
In addition to compressing your images, you can follow the steps for fulfilling these suggestions as described elsewhere in this post.
13. Serve Image in Next-Gen Formats
There are some image file formats that load more quickly than others. Unfortunately, they’re not your commonly-seen PNG or JPEG formats. WebP images are becoming the new standard, and Google PageSpeed will inform you if your images aren’t adhering to it:

This may seem like a hard recommendation to meet, since you likely already have plenty images on your site. Fortunately, there are plugins that can help. For example, Imagify and Smush both offer a WebP conversion feature.
14. Use Video Formats for Animated Content
GIFs can be an effective form of visual content in a variety of situations. Tutorial walkthroughs, feature reviews, and even humorous animations can all elevate your posts and make them more enjoyable and valuable to readers.
Unfortunately, those benefits come at a cost to your performance. GIFs are demanding to load, which is why PageSpeed Insights recommends serving video content instead:

Unfortunately, converting GIFs to video formats isn’t the most straightforward of processes. First, you’ll have to decide which type of video you want to use:
- MP4: Produces slightly larger files, but is compatible with most major browsers.
- WebM: The most highly-optimized video format, although it has limited browser compatibility.
Once you’ve made the choice that makes the most sense for your site, you’ll need to convert the file formats. The best way to do this is via the command line. To get started, install FFmpeg. This is an open-source tool for converting file formats:

Then, open your command line interface and run the following command:
ffmpeg -i input.gif output.mp4This will convert the GIF with the file name input.gif into an MP4 video with the file name output.mp4. Changing the format is just the beginning, however. You now need to embed the resulting video on your site in a way that makes it appear like an animated GIF.
Embedding Video Content for Animations
As you’ve likely noticed if you’ve ever seen a GIF before, they’re slightly different from normal videos. They usually autoplay and run on a loop, and they’re always without sound. Embedding your new MP4 or WebM file on your site won’t produce these features.
However, you can recreate them with some very simple code. Upload your video to your media library, and then add the following to the page or post where you want to include your GIF:
<video autoplay loop muted playsinline>
<source src="output.mp4" type="video/mp4">
</video>
This will apply the specified attributes to your video, making it appear more ‘GIF-like’. Simply adapt the file name and type to match that of your resource. For more details on this subject, we suggest reading Google’s guide on converting GIFs to videos.
15. Ensure Text Remains Visible During Webfont Load
Like images, fonts tend to be large files that take a long time to load. In some cases, browsers may hide your text until the font you’re using loads completely, which will result in this recommendation from Google PageSpeed Insights:

Google advises you resolve this issue by applying the Font Display API swap directive in your @font-face style. To do this, access your stylesheet (style.css) and add the following after the src attribute under @font-face:
font-display: swap
You can learn more about optimizing web fonts in our post “How to Change Fonts In WordPress” and our in-depth guide to hosting local fonts.
16. Enable Text Compression
Google PageSpeed Insights’ Enable text compression recommendation refers to the use of GZIP compression:

In some cases (as you can see in the image above) text compression will be enabled on your server automatically. If this is not the case for your site, you have a couple of options for following this recommendation.
The first is to install a plugin with a GZIP compression feature. WP Rocket is a viable solution if you’re willing to pay for it.
You can also compress your text manually. This involves editing your .htaccess file, which can be risky, so make sure you have a recent backup on hand.
Most WordPress sites run on Apache servers. The code for enabling GZIP compression looks like this:
<IfModule mod_deflate.c>
  # Compress HTML, CSS, JavaScript, Text, XML and fonts
  AddOutputFilterByType DEFLATE application/javascript
  AddOutputFilterByType DEFLATE application/rss+xml
  AddOutputFilterByType DEFLATE application/vnd.ms-fontobject
  AddOutputFilterByType DEFLATE application/x-font
  AddOutputFilterByType DEFLATE application/x-font-opentype
  AddOutputFilterByType DEFLATE application/x-font-otf
  AddOutputFilterByType DEFLATE application/x-font-truetype
  AddOutputFilterByType DEFLATE application/x-font-ttf
  AddOutputFilterByType DEFLATE application/x-javascript
  AddOutputFilterByType DEFLATE application/xhtml+xml
  AddOutputFilterByType DEFLATE application/xml
  AddOutputFilterByType DEFLATE font/opentype
  AddOutputFilterByType DEFLATE font/otf
  AddOutputFilterByType DEFLATE font/ttf
  AddOutputFilterByType DEFLATE image/svg+xml
  AddOutputFilterByType DEFLATE image/x-icon
  AddOutputFilterByType DEFLATE text/css
  AddOutputFilterByType DEFLATE text/html
  AddOutputFilterByType DEFLATE text/javascript
  AddOutputFilterByType DEFLATE text/plain
  AddOutputFilterByType DEFLATE text/xml

  # Remove browser bugs (only needed for really old browsers)
  BrowserMatch ^Mozilla/4 gzip-only-text/html
  BrowserMatch ^Mozilla/4\.0[678] no-gzip
  BrowserMatch \bMSIE !no-gzip !gzip-only-text/html
  Header append Vary User-Agent
</IfModule>
You should add it after #END in your .htaccess file. If you happen to have your WordPress site on an Nginx server, you should add the following code to your nginx.conf file instead:
36 gzip on;
37 gzip_disable "MSIE [1-6]\.(?!.*SV1)";
38 gzip_vary on;
39 gzip_types text/plain text/css text/javascript application/javascript application/x-javascript;
If you’d like to check your site’s text compression, we suggest using a tool such as GiftOfSpeed:

This will let you know if GZIP compression has been successfully implemented, as well as what type of server your site is running on and a few other key details.
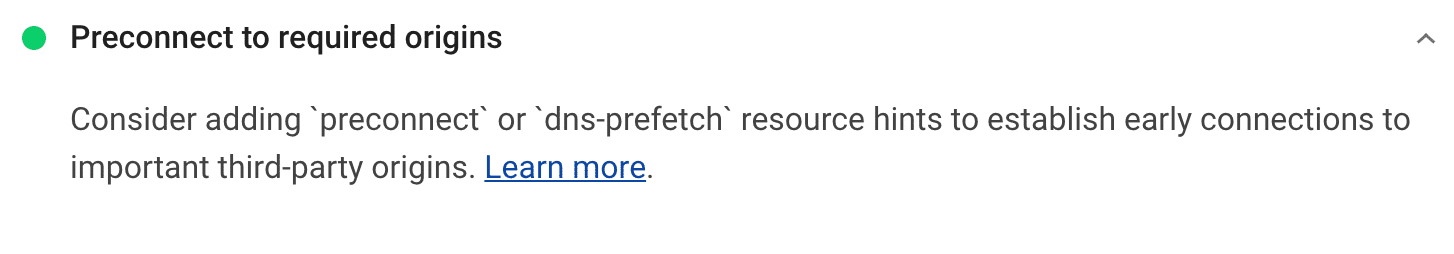
17. Preconnect to Required Origins
Chances are high that you probably have at least one third-party resource on your site – Google Analytics is a common example. It can take time for browsers to establish a connection to these resources, slowing down your loading speeds.
Using preconnect attributes can tell browsers right away that there are third-party scripts on your page that need to be loaded. The process of requesting them can then initiate as soon as possible, improving your performance.
If Google feels that your page could benefit from this technique, you’ll see the Preconnect to required origins suggestion:
There are a few ways to go about implementing this optimization strategy. If you’re comfortable with editing your WordPress theme files, you can add a link tag to your header.php file. Here’s an example:
<link rel=“preconnect” href=“example.com”>In this case, the tag tells browsers that they need to establish a connection to example.com as quickly as possible. Google PageSpeed Insights will list any relevant resources for which you should add link tags with preconnect attributes.
The other option is to use a plugin to achieve the same effect. Perfmatters includes a preconnect feature (disclaimer: I’m one of the founders of Perfmatters). WP Rocket and Pre* Party Resource Hints include similar functionality.
18. Preload Key Requests
Similar to the Preconnect to required origins recommendation, following this suggestion enables you to minimize the number of requests browsers must make to your site’s server. Rather than connecting to third-party resources, however, Preload key requests refers to loading critical assets on your own server:

Implementing this technique is very similar to the previous recommendation as well. You can add link tags specifying the resources listed in PageSpeed Insights to your header.php file:
<link rel=“preload” href=“example.com”>You can also incorporate this tag using Perfmatters, WP Rocket, or Pre* Party Resource Hints.
19. Avoid Multiple Page Redirects
Redirects are used when you want one URL to point to another. They’re commonly employed when you move or delete a page on your site. While there’s nothing wrong with using redirects in general, they do cause additional delays in loading time.
If you have too many redirects on your site, you may see this recommendation in Google PageSpeed Insights:

The only thing you can do in response to this recommendation is to make sure you’re only using redirects when you absolutely have to. You can learn more about the process of creating them in our post, “WordPress Redirect – Best Practices for Better Performance”.
20. Serve Static Assets With an Efficient Cache Policy
If you’ve been using Google PageSpeed Insights for a while, you might know this recommendation better as the Leverage browser caching warning. In Version 5, it’s now labeled as Serve Static Assets With an Efficient Cache Policy:

This suggestion has a few layers we need to piece through. The first is what ‘caching’ means. In short, it’s a process in which browsers save copies of your pages, so they can be loaded faster on future visits.
The most common way WordPress sites implement caching is with plugins. WP Rocket and W3 Total Cache are popular options.
However, some hosting providers – including us here at Kinsta – enable caching via their servers. In fact, all of our clients can enable Edge Caching for free, a feature that reduces the time it takes to deliver the HTML in their web pages to site visitors by an average of over 50%.
Make sure to check and see if this is the case for your host before you install a caching plugin.
Once you’ve enabled caching for your site, you can worry about the second part of this recommendation, which is your cache policy’s ‘efficiency’. Browsers clear their caches periodically to refresh them with updated copies.
Ideally, you want this time period to be higher rather than lower. If you’re clearing your site from browser caches every couple of hours, that defeats the purpose of using this technique in the first place. You can optimize your cache expiration period using Cache-Control and Expires headers.
Adding Cache-Control Headers
Use the following code to add Cache-Control headers in Nginx:
location ~* \.(js|css|png|jpg|jpeg|gif|svg|ico)$ {
 expires 30d;
 add_header Cache-Control "public, no-transform";
}
You should add this to your server’s configuration file. In the above example, the specified file types are set to expire after 30 days.
Those with Apache servers should use this snippet in their .htaccess files instead:
<filesMatch ".(ico|pdf|flv|jpg|jpeg|png|gif|svg|js|css|swf)$">
Header set Cache-Control "max-age=84600, public"
</filesMatch>
Add this code before #BEGIN WordPress or after #END WordPress. In this example, the cache expiration period is set to 84,600 seconds.
Adding Expires Headers
Cache-Control headers are pretty much the standard now. However, there are some tools (including GTMetrix) that still check for Expires headers.
You can add expires headers to a Nginx server by incorporating the following into your server block:
location ~*  \.(jpg|jpeg|gif|png|svg)$ {
        expires 365d;
    }

    location ~*  \.(pdf|css|html|js|swf)$ {
        expires 2d;
    }
You should set different expiration times based on file types. Apache servers will produce the same results if you add this code to your .htaccess file:
## EXPIRES HEADER CACHING ##
<IfModule mod_expires.c>
ExpiresActive On
ExpiresByType image/jpg "access 1 year"
ExpiresByType image/jpeg "access 1 year"
ExpiresByType image/gif "access 1 year"
ExpiresByType image/png "access 1 year"
ExpiresByType image/svg "access 1 year"
ExpiresByType text/css "access 1 month"
ExpiresByType application/pdf "access 1 month"
ExpiresByType application/javascript "access 1 month"
ExpiresByType application/x-javascript "access 1 month"
ExpiresByType application/x-shockwave-flash "access 1 month"
ExpiresByType image/x-icon "access 1 year"
ExpiresDefault "access 2 days"
</IfModule>
## EXPIRES HEADER CACHING ##
Once again, you should add this code either before #BEGIN WordPress or after #END WordPress.
Efficient Caching of Google Analytics
Ironically, the Google Analytics script you may have added to your pages’ headers in order to track user behavior has a cache expiration period of just two hours. This is likely so that, if updates are made to the platform, users will have access to the changes quickly.
This script will appear in the list of resources requiring your attention under the Serve static assets with an efficient cache policy recommendation. Since it belongs to a third party, you can’t change the expiration period with Cache-Control or Expires headers.
If this is the only script listed under this recommendation, you can still pass the audit:

However, as we’ve noted throughout this post, your PageSpeed score matters less than your actual and perceived performance. In order to serve this resource efficiently, you may consider hosting Google Analytics locally.
Plugins like Complete Analytics Optimization Suite (CAOS) and Perfmatters will enable you to do this. You can read more about the process in our complete guide to this PageSpeed suggestion.
21. Reduce the Impact of Third-Party Code
We’ve now mentioned a few different ways in which third-party scripts can negatively impact your performance, and result in failed audits from PageSpeed Insights. Ideally, it’s best to limit your reliance on these tools in order to prevent adverse effects.
However, in some cases the best solution to a need your site has is to incorporate a third-party script. Google Analytics is an excellent example. Others include:
- Social media sharing buttons and feeds
- YouTube video embeds
- iFrames for ads and other content
- Libraries for JavaScript, fonts, and other elements
In cases where you deem the use of a third-party script necessary, it’s important to still reduce its impact on your site’s performance, as your PageSpeed analysis results will tell you:

To load third-party code more efficiently, you can consider one of the techniques we’ve already mentioned in this post:
- Defer the loading of JavaScript
- Use link tags with preconnect attributes
- Self-host third-party scripts (as we described with Google Analytics above)
These methods should minimize the impact on your site’s performance.
22. Avoid Enormous Network Payloads
This recommendation is particularly relevant to your mobile visitors. Large payloads can require the use of more cellular data, thereby costing your users money. Minimizing the number of network requests needed to reach your pages can prevent this:

Google recommends keeping your total byte size to 1,600 KB or less. The methods most commonly used to achieve this goal are found throughout this post, including:
- Deferring CSS, JavaScript, and images that are below the fold
- Minifying code
- Compressing image files
- Using the WebP format for images
- Implementing caching
Follow the relevant steps for these strategies, and you should pass this audit without any additional effort.
23. User Timing Marks and Measures
This recommendation is only relevant if you’re using the User Timing API. This tool creates timestamps to help you evaluate your JavaScript’s performance. If you’ve set up the API for your site, you’ll see your marks and measures under this heading in PageSpeed Insights:

As you can see, this is another suggestion from Google that doesn’t result in a ‘pass’ or ‘fail’. PageSpeed Insights simply makes this information easily retrievable, so you can use it to assess areas that may require optimization.
If you’re interested in incorporating the User Timing API into your WordPress site, you can learn more in the Mozilla guide on the topic.
24. Avoid an Excessive Document Object Model (DOM) Size
In simplest terms, the DOM is how browsers turn HTML into objects. It involves the use of a tree-structure made up of individual nodes that each represent an object. Naturally, the larger your page’s DOM is, the longer it will take to load.
If your page exceeds certain standards regarding DOM size, it will recommend reducing the number of nodes as well as the complexity of your CSS styling:

A common culprit if you’ve ‘failed’ this audit in PageSpeed Insights is your WordPress theme. Heavy themes often add large volumes of elements to the DOM, and may also include convoluted styling that slows your site down. If this is the case, you may need to switch themes.
Why Hosting Is the Hidden Variable in Your PageSpeed Score
Most WordPress performance guides treat hosting as a given. Pick something reasonable, then optimize everything else. That framing makes sense if you assume all hosts perform similarly at the infrastructure level (they don’t).
TTFB is where hosting shows up in your PageSpeed score most directly. When the tool measures server response time, it’s measuring how fast your stack responds before a single line of your theme or plugin code runs.
You can compress every image, defer every script, and lazy load everything below the fold, and a slow server response will still hold your score down.
A few things about Kinsta’s setup matter directly for PageSpeed:
- Server-level caching via Nginx. Full-page caching runs at the server, not the application layer. Cached responses typically serve in under 50ms. No plugin required.
- Cloudflare Enterprise CDN, included by default. Your site is served from edge locations close to your visitors. A visitor in Sydney loading a site on a distant data center will always face latency that proper edge coverage reduces.
- HTTP/3 enabled by default. Older protocol versions add connection overhead that compounds on mobile. HTTP/3 handles it better, and it shows in lab data.
- Built-in APM in MyKinsta. You can see exactly where server-side time goes: PHP execution, database queries, external calls. If something is dragging your TTFB down at the application level, you can find it without guessing.
If your TTFB is already under 200ms, your infrastructure is doing its job. But if you’ve worked through the recommendations in this guide and your score is still lower than expected, another plugin probably won’t fix it. The bottleneck is likely happening before the browser enters the picture.
Summary
Google PageSpeed Insights should be a staple in your webmaster toolbox. However, fixating on your score and obsessing over reaching the coveted 100/100 probably isn’t the best use of your time. It may take you away from other important tasks that could provide more significant benefits.
In this post, we covered the ways in which your Google PageSpeed Score does and doesn’t matter. We also shared some brief guidelines for putting the platform’s recommendations to work on your site, in order to improve its performance.
If you want to see how your site performs on infrastructure built for speed, take a look at Kinsta’s managed WordPress hosting plans.

Brian has a huge passion for WordPress, has been using it for over a decade, and even develops a couple of premium plugins. Brian enjoys blogging, movies, and hiking. Connect with Brian on Twitter.

