
Google is on a mission to improve web performance with Core Web Vitals. Why? Because Google’s business is predominantly web-based — slow sites and web applications push users back to native apps.
Your placement in Google search results is largely determined by the search term’s keywords, use of those keywords within your page, and the popularity of your page according to the number (and quality) of links from elsewhere. From August 2021, Google is making efforts also to assess pages based on performance.
This article will show you how you can optimize your site for Google’s Core Web Vitals metrics.
Why Core Web Vitals?
Content remains crucial. But if you compare two sites with similar text and popularity, the one that offers the best web experience will be given a higher priority in Google search results.
As well as an improved page rank, high-performance sites are eligible for inclusion in the mobile search carousel. This was previously reserved for Accelerated Mobile Pages (AMP), which required you to port content into a separate Google-hosted site. AMP has attracted criticism, especially since the pages are not always faster than a well-optimized WordPress or static site. However, that’s not a requirement anymore.
No matter what you chose, the faster and more responsive your site, the better chance it has for ranking higher in Google search results.
When you consider the average page is around 2 MB, makes more than 60 HTTP requests, and takes 16 seconds to render on a mobile device fully, you’ll see there’s some scope for improving your site. We’ll show you the best ways to achieve those improvements.
Google’s Key Ranking Factors
There are four key ranking factors to examine before you start to assess performance:
- HTTPS: HTTPS is essential. Does your site establish a secure connection between the user’s browser and the webserver?
- Mobile-friendliness: Your site must work well on a mobile device. Is your site usable on small-screen devices? Does it render without content overflows? Is the text large enough? Are clickable areas course enough for touch control?
- No interstitials: Avoid intrusive interstitials which require an unreasonable amount of screen space. Is your content always readable? Is it partially obscured by pop-up interstitials or banners? Is your advertising or marketing promotions making the site difficult to use?
- Safe browsing: Your site should be free from malware, viruses, phishing, fraud, and other scams.
Once you satisfy these requirements, your site will be assessed for performance.
How Does Google Assess Web Performance?
Making your site load fast, render quickly, and be responsive sooner is vital. But does it feel fast to users?
Performance measurement applications like browser DevTools report technical measurements such as:
- Blocking time: The time spent waiting for a download to start, typically because other assets such as stylesheets and scripts have a higher priority.
- DNS resolution: The time to resolve a hostname to an IP address to retrieve an asset.
- Connect time: The time to initialize a TCP connection.
- Time to First Byte (TTFB): The total time between the request and the first byte of the response.
- Receive time: The time to retrieve the entire asset.
- DOM load time: The time to download and render the HTML Document Object Model. This is typically the first point at which scripts that analyze or modify the DOM can run reliably.
- Page load time: The time to download the page and all assets such as images, stylesheets, scripts, and so forth.
- Total page weight: The total size of all assets. It is often reported at both a compressed (download) size and an uncompressed size.
- The number of DOM elements: The total number of HTML elements on the page. The more elements, the longer the page takes to process.
- First Contentful Paint (FCP): The time taken before the browser renders the first content pixel.
- First Meaningful Paint (FMP): The time taken before the primary page content becomes visible to the user.
- Time to Interactive (TTI): The time taken before a page is fully interactive and can reliably respond to user input.
- First CPU Idle: The time for the CPU to render the page and run all initialization scripts, waiting for further input.
- CPU usage: The processing activity required while rendering the page and responding to user input.
- Layouts per second: The rate at which the browser has to recalculate styles and page layouts.
These can be used to determine specific bottlenecks such as server load, CMS caching, browser caching, download speeds, and JavaScript efficiency. But they cannot determine whether a page provides a good or bad user experience. For example:
- An app could download and appear quickly but become unresponsive after the first interaction because it’s executing a large quantity of unoptimized JavaScript code.
- A chat application could continually download data as users post messages. An assessment tool may presume it had never completed loading, despite the page feeling responsive.
Core Web Vitals is Google’s attempt to resolve these dilemmas.
What Are Core Web Vitals?
Google’s Core Web Vitals (CWV) are three performance metrics that assess real-world user experience:
- Largest Contentful Paint (LCP): Loading performance
- First Input Delay (FID): Interactivity performance (This has been replaced by INP, more below)
- Cumulative Layout Shift (CLS): Visual stability performance
- Interaction to Next Paint (INP): This is Google’s newest metric, recently replacing First Input Delay (FID). This metric is used to measure how fast your website reacts to user interactions.
This new Google algorithm update has started to roll out globally by the end of August 2021. The Core Web Vitals metrics primarily affect mobile search results, but desktop equivalents will follow if the experiment is successful.
A page’s LCP, FID, and CLS scores are based on the last 28 days of real user metrics collected anonymously through the Chrome browser. These measurements can vary due to the user’s device, connection, and other concurrent activities, so the 75th percentile is calculated rather than an average.
In other words, metrics from all users are sorted from best to worst, and the figure at the three-quarters point is taken. Three out of four site visitors will therefore experience that level of performance or better.
Any page that achieves a good (green) score for all three Core Web Vitals metrics will receive a higher ranking in search results and be included in the “Top Stories” carousel in the Google News app.
In the following sections, we’ll describe the algorithm used to calculate a metric, the tools you can use to identify a page’s score, typical causes of low scores, and the steps you can take to resolve performance issues.
Largest Contentful Paint (LCP)
Largest Contentful Paint measures loading performance. In essence, how quickly is usable content rendered on the page?
LCP analyzes how long it takes for the largest image or block of text to become visible within the browser viewport (above the fold). In most cases, the most prominent item will be a hero image, banner, heading, or large text block.
Any of the following elements are eligible for Largest Contentful Paint analysis:
- images (
<img>element) - images inside vector graphics (an
<image>embedded into a<svg>) - video thumbnails (a poster attribute set to an image URL within a
<video>element) - elements with background images (typically loaded with the CSS
background-image url()property) - block-level elements containing text
Pages where the Largest Contentful Paint is completed within the first 2.5 seconds of the page load are considered good (green). Pages that exceed 4.0 seconds are considered poor (red):
Largest Contentful Paint Analysis Tools
LCP is the easiest Core Web Vital metric to comprehend, but it may not be obvious which element will be chosen for analysis.
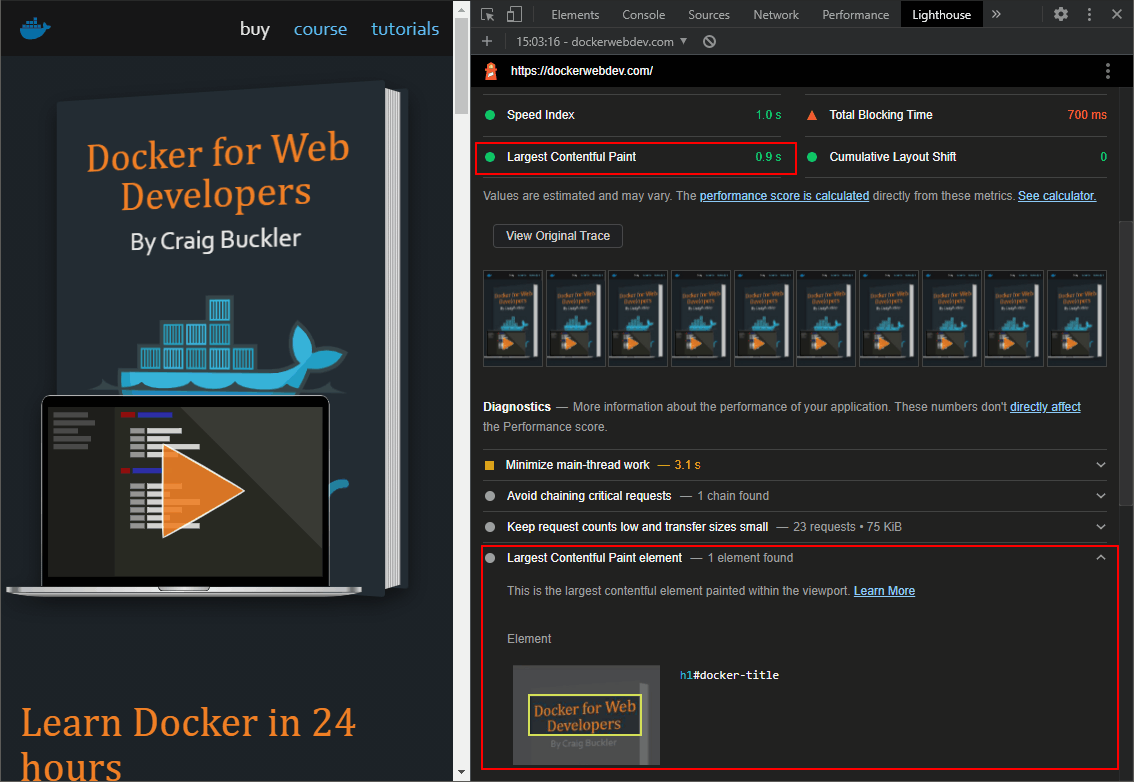
The DevTools Lighthouse panel is provided in Chromium-based browsers such as Chrome, Edge, Brave, Opera, and Vivaldi. Open DevTools from the browser menu – usually at More tools > Developer tools or the keyboard shortcuts Ctrl | Cmd + Shift + i or F12 – then navigate to the Lighthouse tab (older editions may name it Audit).
Generate a Mobile Performance report, then examine the resulting Performance section. The Largest Contentful Paint time is shown with an expandable section, which identifies the chosen element:
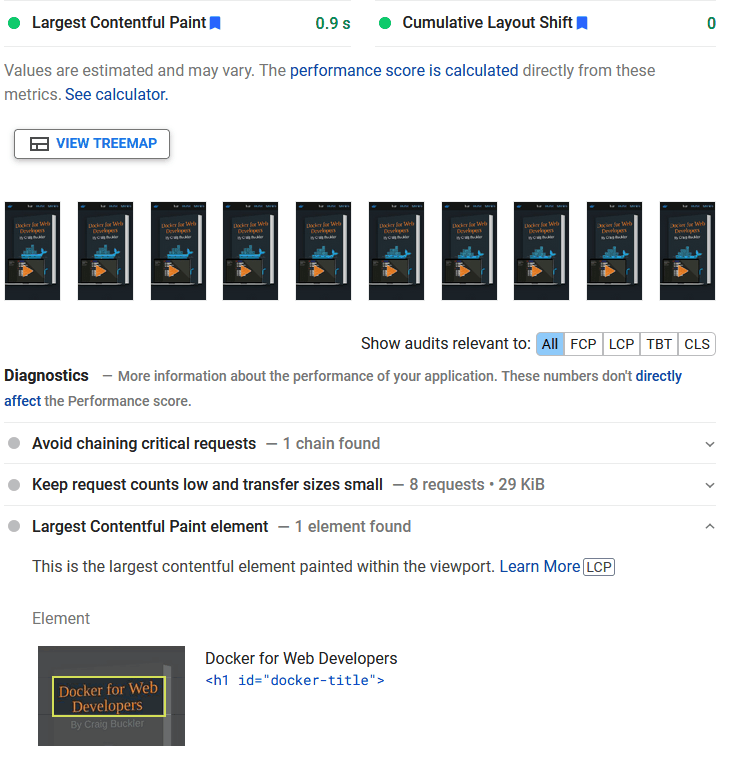
You can generate identical information in the online PageSpeed Insights and web.dev Measure tools if you don’t have access to a Chromium-based browser:
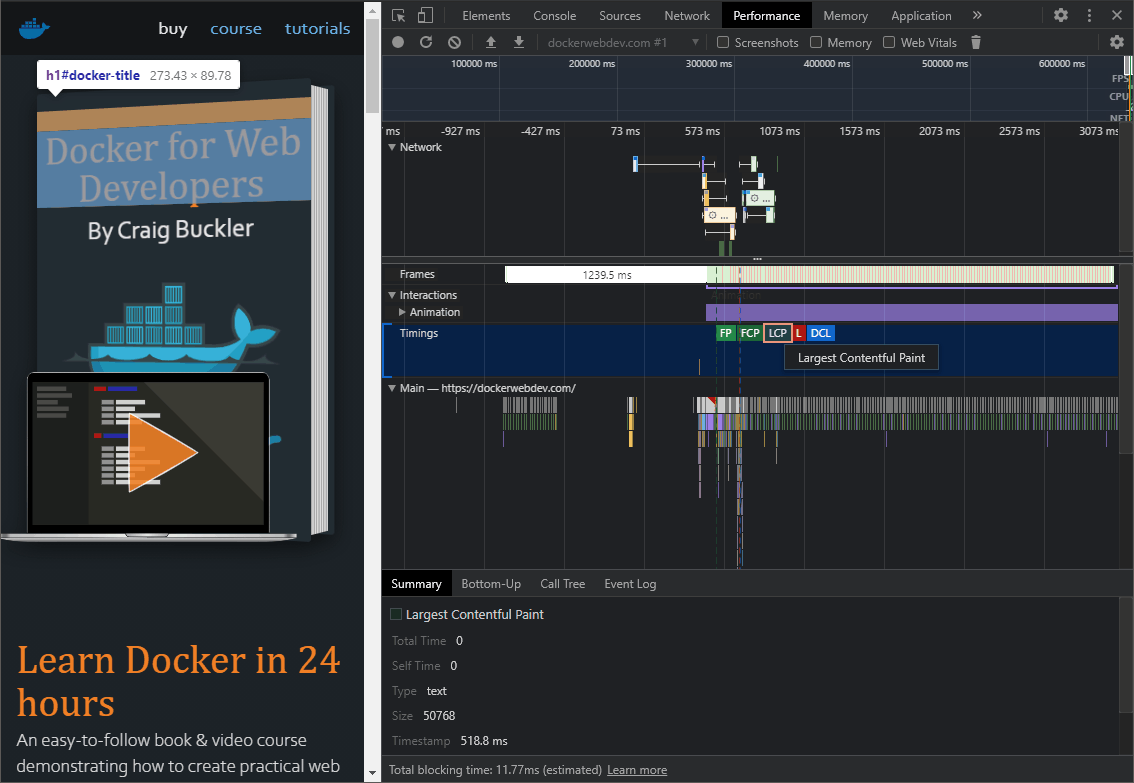
The DevTools Performance panel also displays an LCP indicator. To start, click the circular Record icon, reload your page, then click the Stop button to view the report. Click the LCP icon in the Timings section to identify the element and view a summary of statistics.
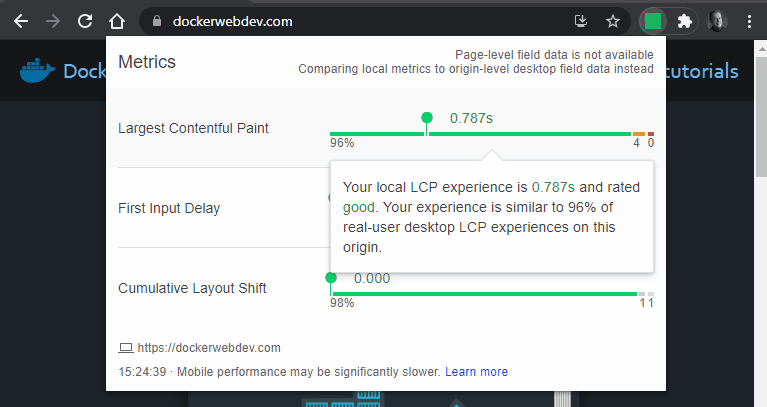
The Web Vitals extension is available for Google Chrome but can be installed on most Chromium-based browsers. It calculates Core Web Vitals metrics for each site you visit, and its icon turns green, orange, or red depending on the result. You can also click the extension icon to view more LCP details:
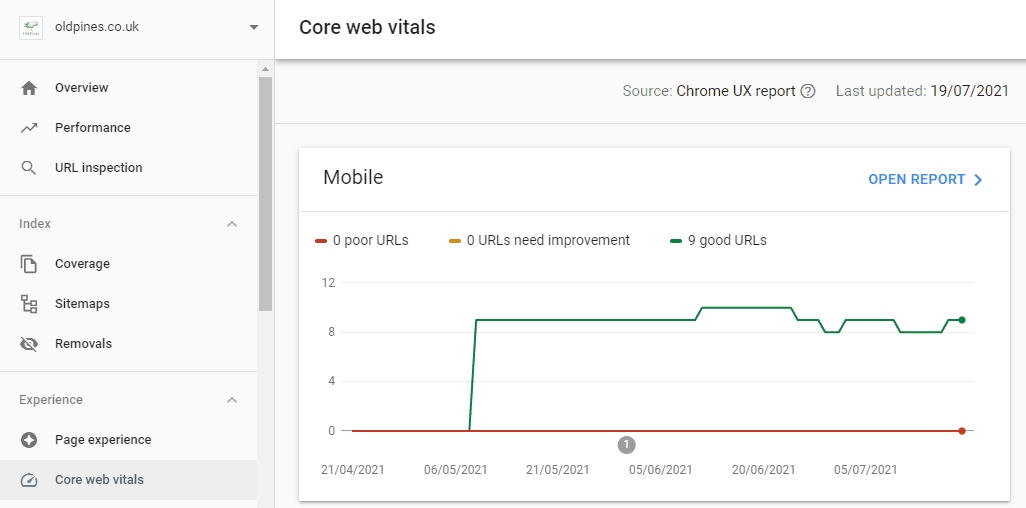
Google’s Search Console now offers a Core Web Vitals section if your site is added as a property. The report illustrates how CWV metrics have changed over time. Note that it doesn’t identify specific LCP metrics, and only sites with reasonably high traffic are available:
The Chrome User Experience Report allows you to query real usage statistics, including LCP across different countries, connections, and devices, for a specific URL. It’s a public project on Google BigQuery, so you must sign up for a Google Cloud Platform account and provide billing details. Again, the report will only be useful when a URL has a reasonably high level of traffic.
Finally, the web-vitals JavaScript library is a small 1 kB script that can calculate LCP and other Core Web Vital metrics for real users on your live site. As it can be downloaded from a CDN, you can add the following script to your HTML <head>:
<!DOCTYPE html>
<html lang="en">
<head>
<meta charset="UTF-8">
<title>My page</title>
<script type="module">
import { getLCP } from 'https://unpkg.com/web-vitals?module';
getLCP(console.log);
</script>
<!-- rest of page -->
getLCP() is an asynchronous function that is passed a callback triggered when the LCP value has been calculated (though it may never trigger if the page loads in a background tab). The callback function is passed an object containing:
name: the name of the metric (“LCP” in this case)value: the calculated valueid: a unique ID representing this metric for the current pagedelta: the delta between the current value and the last-reported valueentries: an array of entries used in the value calculation
The script above outputs the object to the console, although it’s more practical to send the data to a server or Google Analytics for further analysis.
Common Causes of Poor Largest Contentful Paint Scores
Poor LCP scores are typically caused by slow-loading pages that prevent the largest block from appearing quickly:
- The server response could be slow because it’s overloaded or doing too much work to render a page. This may not necessarily be your site’s fault – it could be due to server constraints if you’re using a shared hosting service.
- Render-blocking CSS and JavaScript can delay page loading if they’re referenced in the HTML above the primary content.
- Other resources like large images and videos can reduce available bandwidth and take longer to render.
- Page content generated on the client rather than the server also takes longer to appear.
How To Improve Largest Contentful Paint Scores
A thorough audit can identify loading issues, but it’s generally a matter of reducing the quantity of data sent to the browser. The following tips will help toward a healthier LCP score:
- Upgrade your server and/or hosting service. Ensure download speeds remain fast even at times of high usage.
- Activate server compression and HTTP/2+. There’s no reason not to!
- Reduce server effort. Remove unused code and CMS plugins, then enable effective caching.
- Ensure the browser can cache files effectively. Set appropriate Expires, Last-Modified, and/or ETag hashes in the HTTP header, so files aren’t requested again.
- Use a Content Delivery Network (CDN) to split the load and host assets on servers geographically closer to users.
- Optimize your images. Reduce them to their smallest dimensions and use an appropriate format to minimize file sizes. Ensure any image in the largest content block is requested as early as possible; a preload could help.
- Lazy-load images by adding a
loading="lazy"attribute. Add width and height attributes to ensure appropriate space is reserved on the page before the image completes loading. - Minimize third-party requests, and consider moving assets to your primary domain to avoid extraneous DNS lookups.
- Minimize the number and size of requested files, especially at the top of your HTML.
- Ensure you load required web fonts only. Switch to web-safe fonts for maximum performance.
- Remove unused JavaScript and CSS files.
- Concatenate and minify your JavaScript and CSS files.
- Avoid CSS @import statements — they’re render-blocking and load styles in series.
- Avoid Base64 encoding — it increases file sizes and requires additional processing.
- Consider critical inline CSS. Embed essential “above-the-fold” CSS in a
<link>block at the top of the page, then load further stylesheets asynchronously. - Use asynchronous, deferred, or ES module JavaScript to run scripts later. Execute long-running JavaScript processes in a service worker.
First Input Delay (FID)
First Input Delay measures the responsiveness of your page. In essence, how quickly does it respond to user actions such as clicking, tapping, and scrolling?
The FID metric is calculated as the time between user interaction and the browser processing their request. It does not measure the time to run the handler function, which would typically process the input and update the DOM.
Pages with an FID time of 100 milliseconds or less are considered good (green). Pages exceeding 300 milliseconds are considered poor (red):
First Input Delay Analysis Tools
First Input Delay is impossible to simulate because it can only be measured when the page is served to an actual user who interacts with the page. The result is therefore dependent on each device’s processor speed and capabilities.
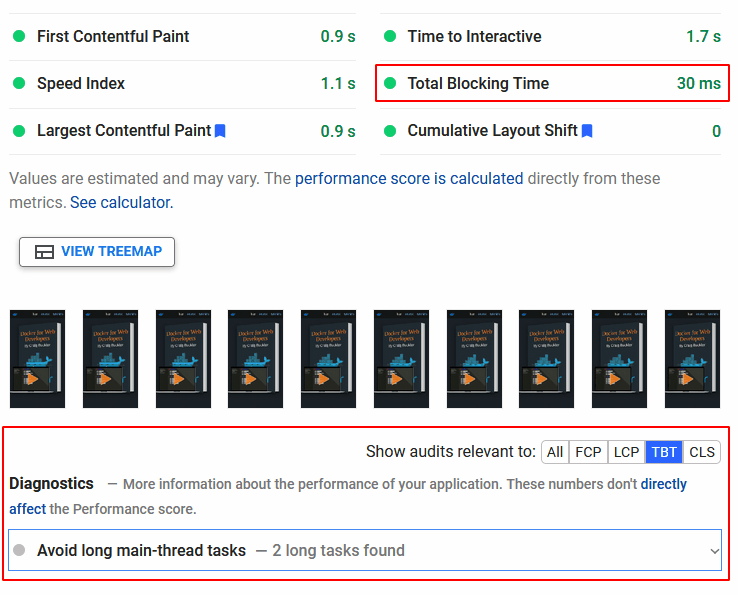
FID is not calculated in the DevTools Lighthouse panel or PageSpeed Insights. However, they can determine the Total Blocking Time (TBT). This is a reasonable approximation for the First Input Delay. It measures the difference in time between:
- The First Contentful Paint (FCP), or the time at which page content starts to render, and
- The Time to Interactive (TTI), or the time at which the page can respond to user input. TTI is presumed when no long-running tasks are active and fewer than three HTTP requests have yet to complete.
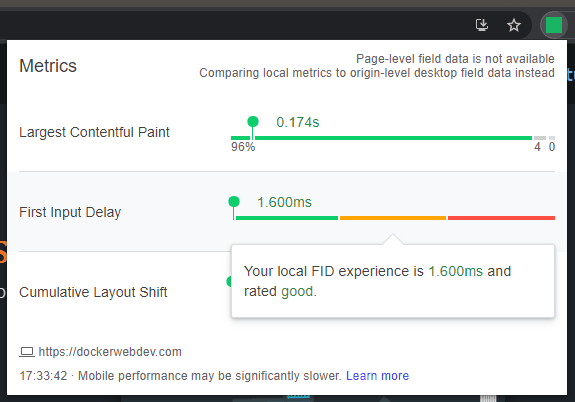
The Web Vitals extension for Google Chrome can also show an FID metric after interacting with the page by scrolling or clicking. Click the extension’s icon to reveal more information:
Like LCP, the Chrome User Experience Report allows you to query real FID statistics recorded across different countries, connections, and devices for a specific URL.
The web-vitals JavaScript library can also calculate FID metrics for real users on your live site. You can add the following script to your HTML <head> to output FID metrics to a callback function:
<!DOCTYPE html>
<html lang="en">
<head>
<meta charset="UTF-8">
<title>My page</title>
<script type="module">
import { getFID } from 'https://unpkg.com/web-vitals?module';
getFID(console.log);
</script>
<!-- rest of page -->
Common Causes of Poor First Input Delay Scores
Poor FID and TBT scores are usually caused by client-side code that hogs the processor, such as:
- Significant quantities of render-blocking CSS and JavaScript, which halt page loading as the code is downloaded and parsed
- Large, process-intensive scripts that run immediately when the page loads
- Long-running or poorly optimized JavaScript tasks
By default, browsers run on a single thread, which can only process one task at a time. If a JavaScript function takes one second to execute, all other rendering processes are blocked during that second. The page cannot react to user input, update the DOM, show animations, or so forth. Even GIF animations can be blocked in older browsers.
How to Improve First Input Delay Scores
A client-side JavaScript audit can identify issues, but it’s generally a matter of removing redundant code and ensuring tasks are executed quickly.
The following tips will help toward a healthier FID score:
- Generate and cache as much static HTML content on the server as possible. Try not to rely on client-side JavaScript frameworks to render the same HTML for everyone.
- Ensure the browser can cache files effectively. Set appropriate Expires, Last-Modified, and/or ETag hashes in the HTTP header, so files are not requested again.
- Adopt progressive enhancement techniques, so the interface is usable in HTML and CSS before JavaScript runs.
- Remove unused JavaScript and CSS files.
- Concatenate and minify your JavaScript and CSS files.
- Avoid excessive use of expensive CSS properties such as box-shadow and filter.
- Use asynchronous, deferred, or ES module JavaScript to run scripts later.
- Minimize third-party JavaScript requests for analytics, social media widgets, discussion forums, etc. These can quickly mount up to several megabytes of JavaScript.
- Lazy-load JavaScript components on demand, e.g. chat widgets, video players, etc.
- Delay loading of less critical scripts such as analytics, advertisements, and social media tools.
- Break up long-running JavaScript tasks into a series of smaller jobs that execute after a short requestIdleCallback, setTimeout, or requestAnimationFrame delay.
- Consider executing long-running JavaScript processes in a web worker, which uses a background thread.
Cumulative Layout Shift (CLS)
CLS measures the page’s visual stability. In essence, does page content move or jump unexpectedly, especially during the initial load?
CLS calculates a score when elements move without warning or user interaction. You have probably experienced this when reading an article on a mobile device – the text suddenly jumps off-screen, and you lose your place. The worst examples could cause you to click an incorrect link.
CLS problems are most prominent when a large image or advertisement loads above the current scroll position and a zero-height space instantly grows by several hundred pixels.
Cumulative Layout Shift scores are calculated by multiplying the following metrics together:
- The impact fraction: This is the total area of all unstable elements in the viewport, i.e. those that will “jump.” If elements covering 60% of the viewport are displaced during the page load, the impact fraction is 0.6. Note that the elements that caused that shift, such as an image or advertisement, are considered stable because they do not necessarily move after being rendered.
- The distance fraction: This is the greatest distance moved by any single unstable element in the viewport. If the greatest displacement occurs on an element that moves from 0,100 to 0,800, it has shifted by 700 vertical pixels. If the device viewport is 1,000 px in height, the distance fraction is 700 px / 1000 px = 0.7. The calculated Cumulative Layout Shift score is therefore 0.6 x 0.7 = 0.42.
Google has made changes to the CLS metric to accommodate the following situations:
- Layout shifts are grouped into “sessions” that last for five seconds but close after one second if no further layout shifts occur. If two or more shifts occur within one second, their scores are added.
- Layout shifts are not recorded for 500 ms after user interaction, such as a click. In some cases, this triggers DOM updates (e.g. opening a menu, showing an error message, displaying a modal dialog, etc.).
- Single-page applications which remain open for more extended periods and make numerous DOM updates are not adversely affected.
Pages sporting a CLS score of 0.1 or less are considered good (green). Pages that exceed 0.25 are considered poor (red):
Cumulative Layout Shift Analysis Tools
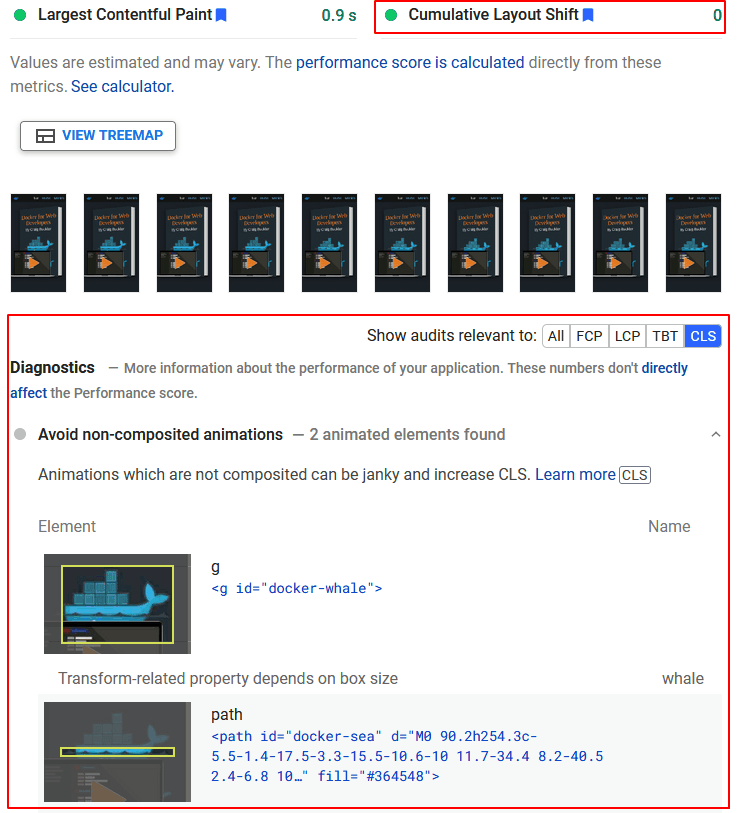
CLS metrics are calculated in the DevTools Lighthouse panel, PageSpeed Insights, and web.dev Measure tools:
The Web Vitals extension for Google Chrome also shows the CLS metric:
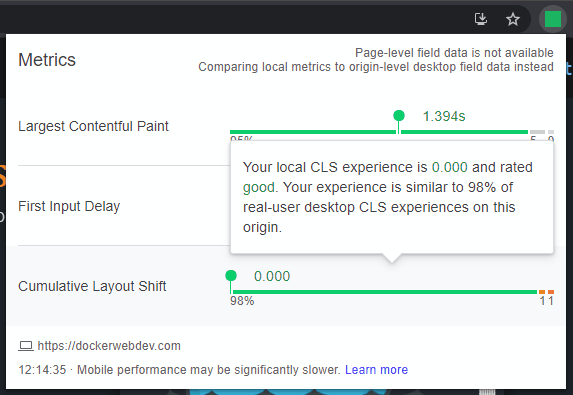
Like LCP and FID, the Chrome User Experience Report allows you to query real CLS statistics recorded across different countries, connections, and devices for a specific URL.
The web-vitals JavaScript library can also calculate CLS metrics for real users on your live site, just as it does with LCP and FID. The following script could be added to your HTML <head> to output CLS metrics to a callback function:
<!DOCTYPE html>
<html lang="en">
<head>
<meta charset="UTF-8">
<title>My page</title>
<script type="module">
import { getCLS } from 'https://unpkg.com/web-vitals?module';
getCLS(console.log);
</script>
<!-- rest of page -->
Common Causes of Poor Cumulative Layout Shift Scores
Poor CLS scores are typically caused by slow-loading page assets and dynamic or unsized DOM elements:
- Space on the page is not reserved for images, iframes, advertisements, etc.
- Content is dynamically injected into the DOM, typically after a network request for advertisements, social media widgets, etc.
- Web font loading causes a noticeable Flash of Invisible Text (FOIT) or Flash of Unstyled Text (FOUT).
How To Improve Cumulative Layout Shift Scores
A client-side audit can identify issues, but it’s generally a matter of ensuring that space is reserved for content before it downloads. The server optimization tips suggested for Largest Contentful Paint will have some benefit, but further improvements are possible:
- Add width and height attributes to HTML
<img>and<iframe>tags or use the new CSS aspect-ratio property to ensure appropriate space is reserved on the page before asset downloads. - Set appropriate dimensions for container elements enclosing slower-loading third-party content like advertisements and widgets.
- Ensure images and other assets appearing toward the top of the page are requested as early as possible — a preload could prove helpful.
- Minimize web font usage, and consider using commonly available OS fonts when possible.
- Load web fonts and set CSS font-display to optional or swap. Ensure you use a similarly-sized fallback font to minimize the layout shift.
- Avoid inserting elements toward the top of the page unless it responds to a user action such as a click.
- Make sure user interactions are complete within 500 milliseconds of the input trigger.
- Use CSS transform and opacity for more efficient animations that don’t incur a re-layout.
- Consider critical inline CSS. Embed essential “above-the-fold” CSS in a
<link>block at the top of the page, then load additional stylesheets asynchronously. - Where necessary, consider containment, a new CSS feature that allows you to identify isolated subtrees of a page. The browser can optimize processing by rendering — or not rendering — specific DOM content blocks.
Summary
Developers are not always keen to dance to Google’s tune. The company has considerable power, and minor search engine updates can adversely affect the productivity and profitability of web-based organizations.
That said, Core Web Vitals takes a “carrot” rather than a “stick” approach. Well-optimized, usable sites which forgo dark patterns have a better chance of success than bloated, pop-up-intensive sites offering a poor mobile UI.
Core Web Vitals provides a measurable way to assess user experience to help you focus on the most critical improvements. The changes to your vitals may not increase revenues, but your users will be happier and more loyal.
Do you have any other tips about improving Core Web Vitals? Share them in the comments section!