
Even with limited capital, it’s easy to set up a business nowadays thanks to ecommerce growth. With consumers increasingly relying on online shopping — it is estimated that 95% of purchases will be made online by 2040 — ecommerce is opening the doors of opportunity to countless entrepreneurs.
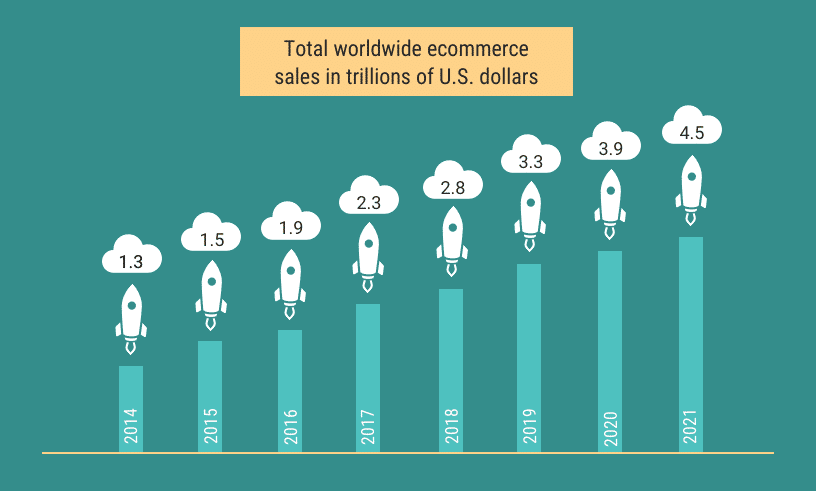
And, those ecommerce sales opportunities are rapidly growing. In 2017, ecommerce was responsible for $2.3 trillion in sales, which is expected to more than double to $5.5 trillion by 2022. In the U.S. alone, online shopping already accounts for 10% of retail sales and is expected to grow at a year-on-year rate of 15%.
Knowing key ecommerce statistics and facts, from demographics and shopping behavior, to shopping cart abandonment and trends, will provide you with a deeper understanding of what’s going on in ecommerce now — and where it’s headed.
Digging into Ecommerce Demographics
Millennials and Gen Xers are the biggest online shoppers, with 67% of millennials and 56% of Gen Xers preferring to shop online versus in a brick-and-mortar store. Part of the reason you see these two segments of the population spending more money online is that they spend more time shopping online. Millennials and Gen Xers spend 50% more time shopping online than their older counterparts: 6 hours versus 4 hours.
Though women are stereotypically pinned as shoppers, when it comes to online shopping, men dominate the stats, spending 28% more than women shopping online.
Breaking Down Ecommerce Shopping Behavior
The statistics about ecommerce shopping behaviors are incredibly revealing: 43% of online shoppers have reported making purchases while in bed, 23% at the office, and 20% from the bathroom or while in the car.
It turns out that alcohol boosts sales for ecommerce businesses, with 10% of customers reporting that they made purchase drunk. Men ended up being more than twice as likely to make purchases under such conditions, with 14% reporting to have done so, while only 6% of woman reported doing so.
Given the role that booze plays in making online purchases, it should be no surprise to find out that 42% of online shoppers have made a purchase that they regretted, and 21% have accidentally bought something they didn’t want.
Though 48% of online shoppers have overspent or bought something unplanned while shopping online, the purchase path is not straight: 85% of customers start a purchase on one device and finish it on another.
Ecommerce Market Share: US vs Global Trends
Though the United States is often thought of as the largest market for ecommerce, it isn’t. However, it does make the list of the top 10 largest ecommerce markets in the world:
- China: $672 billion
- USA: $340 billion
- United Kingdom: $99 billion
- Japan: $79 billion
- Germany: $73 billion
- France: $43 billion
- South Korea: $37 billion
- Canada: $30 billion
- Russia: $20 billion
- Brazil: $19 billion
Nielsen’s Global Connected Commerce report provides a detailed breakdown of the most lucrative industries by country, with South Korea taking the cake in fashion (77%) and beauty products (66%), as well as non-food household groceries (52%), packaged grocery food (51%) and fresh groceries (37%).

However, when it comes to books, stationery, and music purchases, Japan leads the charge at 79%. Spain tops the charts for travel with 67%, and Brazil takes the highest spot on the podium with consumer electronics at 57%.
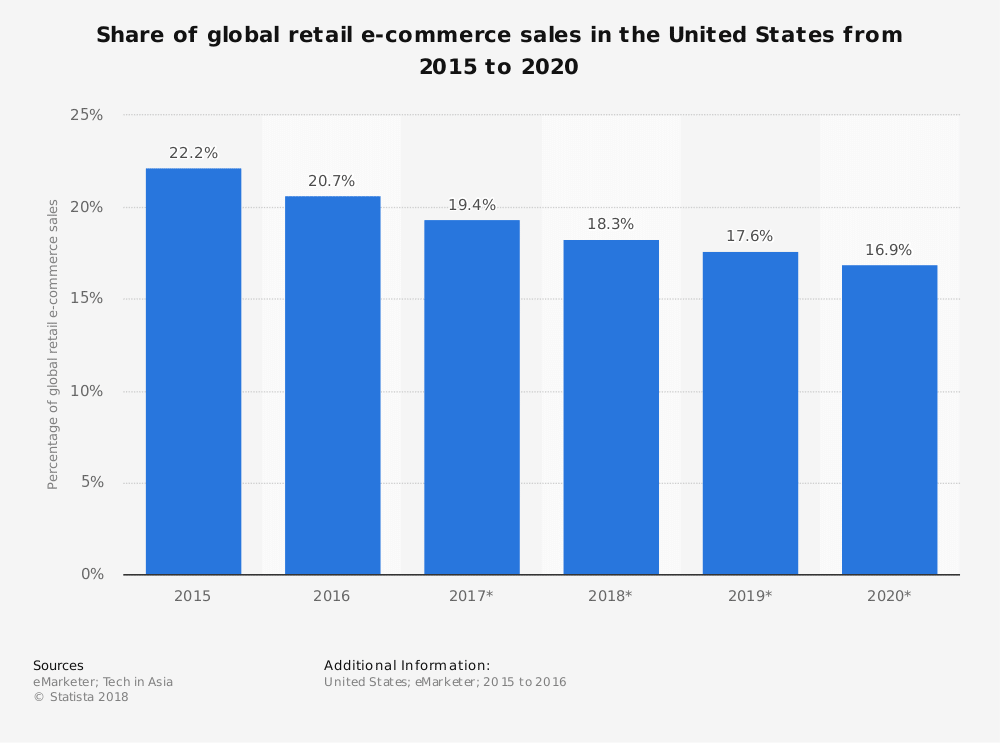
As more global markets are developed, the US’s share of ecommerce market sales is steadily decreasing. From a global share of 22.2% in 2015, the US is expected to be down to 16.9% by 2020. On the other hand, there is a rise in B2B ecommerce global sales in Eastern markets.
The ecommerce marketplace is also bolstering globalism with 57% of online shoppers having made a purchase from an overseas retailer. The preferred payment method used by these shoppers varies around the world. Globally, credit cards are the preferred method of payment, being used in 53% of transactions, followed by digital payment systems (43%) and debit cards (38%). However, digital payment systems are the most preferred method in China and Western Europe, while cash-on-delivery is the go-to method for Eastern Europe, Africa, and the Middle East.

Payment method aside, more Americans already prefer online shopping than shopping in a physical store, with 51% percent clicking their way to making purchases. A total of 96% of Americans have made at least one online purchase in their life, with 80% doing so in the last month alone. However, Americans actually spend 64% of their budget in physical stores and only 36% online.
With Amazon accounting for 44% of all ecommerce sales in the US in 2017 and a year-on-year growth rate of 23% in the US, it’s shocking that 46% of American businesses still do not have a website.

Business-to-Consumer Ecommerce
B2C ecommerce refers to a transaction between a business and consumer conducted online. It can also refer to paid online services or content that directly services consumers. Amazon is a great example of the expansiveness of B2C options, as it started as an online retailer but eventually branched out into services, such as cloud storage, and paid content, such as apps and media.
China accounts for the largest B2C ecommerce market. However, if you think that the B2C ecommerce market is large, prepare to have your mind blown by the volume of transactions through the business-to-business ecommerce market.
Business-to-Business Ecommerce
B2B ecommerce refers to the marketing, selling, and distribution of products from one business to another online. This includes software as a service (SaaS) companies, web hosting, wholesalers, and so on. It also includes the buying and selling of companies.
With nearly half of American B2B businesses offering their full product line online, it’s no surprise that the worldwide B2B eCommerce sector reached a value of US$20.4 trillion in 2022, which is more than 5x the size of the B2C market.
Research conducted by Frost and Sullivan predicts B2B ecommerce sales to reach $12 trillion globally by 2020, with China and the US leading the global market. A year before that, by 2019, it’s estimated that B2B firms will spend more on ecommerce technology than online retailers.
Though the growth of B2B ecommerce is attractive, the business model faces myriad challenges. Prices are often volatile and volume in sales are high, which means B2B businesses require flexible shipping and logistics solutions. Additionally, there are issues with taxes, as well as regulatory concerns, especially when dealing with businesses overseas. Another challenge faced by B2B, especially those dealing in software, is determining how the product can be integrated with other existing systems in place.
Important Metrics: Conversion Rate
Conversion rate, the percentage of visitors to your website that complete a desired goal, is one of the most important metrics to track in online retail. A high conversion rate shows that you are able to get more value from the customers you already have. This means lower customer acquisition costs. Also, it means that when you put in more effort, it can result in more customers and higher revenue.

Average ecommerce conversion rates range from 3% to 4%, with 43% of ecommerce traffic coming from organic Google searches. This means that it’s still essential to build your ecommerce site with SEO in mind.

Several factors play a large role in increasing your business conversion rate. Top among them is a good user experience. This boils down to good visuals, fast website loading time, and ease of payment; PayPal transactions have 70% higher checkout rates than non-Paypal transactions.

Quality customer service, as well as strong reviews, recommendations, and testimonials also play roles in boosting your business’s conversion rate.
Creating the Customer Experience
Customer experience encapsulates everything throughout the duration of the relationship between a customer and your business. This includes customer service, user experience (UX), and pricing strategies, as well as shipping and logistics.
When it comes to making a purchase, 64% of customers find customer experience more important than price. According to the Guardian, by 2020, the quality of customer experience provided by a brand will be more important than price and product as a key differentiator.
Customer Service
Americans tell an average of 15 people about poor customer service, and 11 people about a good one, which backs up the old adage about bad news spreading faster than good news. More worrisome for businesses that don’t focus on customer service is that 33% of Americans say they would consider switching companies after having dealt with poor customer service.
U.S. companies lose an average of $62 billion annually due to poor customer service. However, not all is lost for companies with weak customer service, as it has been found that a moderate increase in customer service can yield an average of an $823 million increase over a 3 year period for a company with $1 billion in annual revenues.

Digging into the ecommerce statistics, the key to good customer service is making everything as easy as possible for people. It turns out that an inconvenient return policy deters 80% of shoppers, while 74% of people are likely to switch brands if they find the purchasing process too cumbersome.
User Experience
UX refers to a person’s emotions and attitudes about using your system, service, or product. Your website’s design and loading speed can play a huge role in UX.
A total of 57% of customers will abandon your site if they have to wait 3 seconds or longer for a page to load. More detrimental, however, is search capability. Once on your website, 60% of customers will leave your site if they can’t find what they were looking for in the first place.
Reviews, Recommendations, and Testimonials
Users are more likely to purchase a product if they know how to use it or know that it works for others. This often ends up meaning that businesses need to provide additional information beyond product descriptions.
If a potential customer can watch a video explaining a product or service beforehand, 73% of them are more likely to make a purchase.
According to BigCommerce, 46% of consumers want product comparisons from ecommerce sites and 42% of customers want more testimonials from ecommerce sites. Along those same lines, 69% of online shoppers want more reviews from ecommerce sites. In fact, 77% of customers read product reviews before making a purchase.
Moving Forward with Mobile
Failing to take mobile devices into account when developing your ecommerce strategy can be detrimental to your business.
According to ReadyCloud, 44% of internet retail minutes were spent on a smartphone, 11% on a tablet, and 45% on a desktop. Those numbers appear to be supported by eMarketer’s claims that 59% of ecommerce sales were made through mobile.

The world is witnessing an increase in mobile shopping for various reasons. These include the fact that most people bring their mobile devices everywhere they go, from the office to the bathroom. Additionally, seamless shopping experiences through apps are making it easier to shop on mobile devices, as is the proliferation of mobile wallet solutions, such as Apple Pay and Google Wallet.
Cyber Monday 2017 saw mobile claim its first $2 billion in a day, accounting for a third of the total amount spent online. Smartphones accounted for 37.6% of retail visits and 21% of revenue for that day. Additionally, it was found that conversion rates on mobile phones increased by 10% compared to the year before.
For entrepreneurs just starting out, mobile is especially important, as it’s been found that smaller retailers have up to 30% higher mobile conversion rates compared to larger retailers.

Making your Mobile Shopping Experience Seamless
It is important to make your mobile shopping experience as easy as possible for users, as 52% of people say they’re less likely to re-engage with a brand when they’ve had a bad mobile experience.
Though the ship might have already sailed for converting those customers, there are a number of ways to improve your mobile shopping experience.
The first step is having a mobile-responsive website, which means that it will automatically change to fit the device a customer is accessing it on. The next thing you’ll need to take care of is streamlining the process, which should include auto filling as much information as you can—anything to make a customer’s life easier and checkout faster.
Social Media and Social Shopping
Social shopping is what happens when ecommerce meets social media. It involves aspects of social networking, such as groups, communities, recommendations, and discussions, as well as the core function of ecommerce—selling products and services online.
You don’t want to underestimate the importance of social media with regards to ecommerce, as 74% of consumers rely on their social networks to make purchasing decisions. Additionally, 56% of users that follow brands on social media do so to view products.
In emerging markets, such as Southeast Asia, social shopping accounts for 30% of all online sales. A variety of trends are starting to emerge in social shopping. One of them is group shopping through the proliferation of websites such as Groupon and LivingSocial. These sites were built on the idea of securing people group discounts by selling in bulk. Another major trend is the integration of ecommerce with social networks.
There has been a shift from the “like” buttons to “buy” buttons, and these platforms make it easier for users to shop on the platform. You can see this via Instagram’s Shoppable Feed and Pinterest Buyable pins, as well as Instagram Stories and Snapchat ‘Swipe Up’ external linking.
Brands are discovering that people don’t have to look for their products; the products just need to reach the right people, which can be done through very focused targeted marketing via social media.
No brand is alone in targeting people through social media. However, it doesn’t matter if you have to work extra hard to stand out from the crowd, because the costs pay off: mobile shoppers who read product reviews on social media channels show conversion rates of up to 133%, which represents billions of dollars worldwide.
Shopping Cart Abandonment
About 70% of shopping carts are abandoned, which occurs when a potential client selects products or services to be bought but never follows through with the check-out process.

For every three successful purchases in an ecommerce shop, there are about seven that ended up in an abandoned cart. This results in about an $18 billion loss in revenue each year.
The problem of shopping cart abandonment is only growing. In 2006, the average cart abandonment rate was 59.8%. The rate had increased to 69.23% by 2017.

More than 60% of consumers who abandoned their carts did so because of shipping costs, while 57% of people who abandon their shopping carts say that they were “window shopping.”
One way businesses are reducing the rate of this problem is by sending abandoned shopping cart emails. According to Adobe, 71% of mobile purchases are influenced by emails from the retailer, while Salecycle found that 28.3% of ecommerce revenue comes from abandoned cart emails.

Top Ecommerce Trends
A number of trends in ecommerce took hold in 2018 and will continue to do so in 2019. These included chatbots, voice assistants, and omnichannel marketing, as well as personalization and localization.
Here are some of the most interesting ecommerce statistics we know so far:
Chatbots
More than 60% of customers say that they prefer digital self-serve tools, such as websites, apps, or chatbots to answer their simple inquiries. For millennials, who are increasingly wielding a dominant purchasing power, chat is the preferred support channel.
The primary reason chatbots are so popular is that it often takes far too long to speak to a real person when a customer calls a company. Despite this, customers will still wait an average of 11 minutes before hanging up. That’s nearly twice as long as 75% percent of online customers expect it to take; they want to be assisted within 5 minutes. However, chatbots are much faster, which means that inquiries are being dealt with significantly more quickly, with the average wait time to access a chat session being 45 seconds.
According to a study analyzing the top 1,000 Shopify stores, 36% of businesses already offer AI-powered chatbots to users. Experts predict that by 2028, the chatbot market will reach $15.5 billion.
Would you like to learn more about chatbots? Take a look at our detailed guide: What Is a Chatbot – Should You Add One to Your WordPress Site?
Voice Assistants & Voice Search
Voice searches are rapidly increasing, especially with the growing popularity of voice assistants — software agents that can perform tasks or services. Already, 20% of Google searches on mobile devices are voice searches. It’s predicted that by 2020, voice searches will make up 50% of all searches.
It’s also estimated that there will be 21.4 million smart speakers by 2020. These devices create yet another way for consumers to make online purchases. Already, 22% of US smart speaker owners have purchased something using their devices.

These devices rely on voice assistants to allow people to make purchases. It turns out that almost 60% of people who own a virtual assistant have used it to make a purchase through voice command. Voice commerce sales reached $1.8 billion last year, with the potential to reach $40 billion in 2022.
It is predicted that by 2021, early adopters of the technology who have redesigned their websites to support voice search capability will increase revenue by 30%.
Personalization and Localization
Personalization is the practice of creating a personal experience for each customer through tailored recommendations based on data such as search queries, browsing behavior, purchase history, and geolocation.
Personalization is growing in importance with mobile voice-related searches, as they are three times more likely to be local-based searches, such as “pharmacy near me”. Overall, 22% of consumers say they are satisfied with the level of personalization that they are currently receiving.
One of the major benefits of personalization is that it can help increase a businesses’ profits by 15%. This is partly because 75% of customers are most likely to buy from a retailer that recognizes them by name and recommends products based on previous purchases. After implementing personalization, 93% of companies see a rise in conversion rates.
Though all forms of personalization are important, localization is especially important. Localization is a type of personalization where content is specifically altered to a customer’s IP address.
A study by Common Sense Advisory found that 75% of people want to buy products in their native language and 92.2% prefer to shop and make purchases on sites that price in their local currency.
Omni-Channel Marketing
Omni-channel marketing develops a multichannel approach to sales, allowing customers to make purchases through nearly all possible developed avenues. At this point, most brands are not just selling solely on their website; they are selling on various ecommerce platforms, as well as social media and in brick-and-mortar shops.
According to a 2017 survey by Square and Mercury Analytics on US business owners, common channels where brands sell their products and services include:
- Brick-and-mortar shop (56%)
- Website (34%)
- Pop-up shops, events, and markets (26%)
- Facebook (25%, but 40% as a whole on social media, including platforms such as Twitter and Instagram)
- Amazon (16%)
- Others (22%; includes eBay, Alibaba, Etsy)
It’s particularly important for your company to target multi-channel shoppers, as they spend three times more than single-channel shoppers.
Summary
By understanding the demographics of who is using ecommerce, as well as the trends driving increased revenue for ecommerce companies, it’s possible to start tapping into the multi-trillion dollar marketplace.
Strong estimated growth in ecommerce means that even if your brick-and-mortar business is able to ignore it now, by 2021, you’re going to be struggling if you refuse to adapt to the evolving purchasing behaviors in a world increasingly dependent on mobile devices.
Did you not see your favorite ecommerce statistics or facts? Share them with us in the comment section below!

Maddy Osman creates engaging content with SEO best practices for marketing thought leaders and agencies that have their hands full with clients and projects. Learn more about her process and experience on her website, The Blogsmith and read her latest articles on Twitter: @MaddyOsman.

