
In a perfect world, you’d never have a single issue that required debugging. But in the real world, you’ll almost certainly run into issues on your WordPress site that require a look under the hood.
To help you do that, WordPress includes its own built-in debug mode and you can also find useful third-party tools to help you debug WordPress.
In this post, we’ll dig into the built-in WordPress debug mode and show you how to enable it. Then, we’ll also share some of the other ways in which you can debug your WordPress site.
Here’s everything that we’ll cover:
- An introduction to WordPress debug mode and the debug log
- How to enable WordPress debug mode (three methods)
- Some other ways to debug WordPress
What Does WP Debug Do?
The core WordPress software is written in PHP, as are plugins and themes.
If you’re having issues with your site, WordPress debug mode can help you find out what’s going wrong by displaying all PHP errors, notices, and warnings.
Once you enable debug mode, you’ll see messages like this whenever there’s an issue (even if it’s not causing immediate problems):
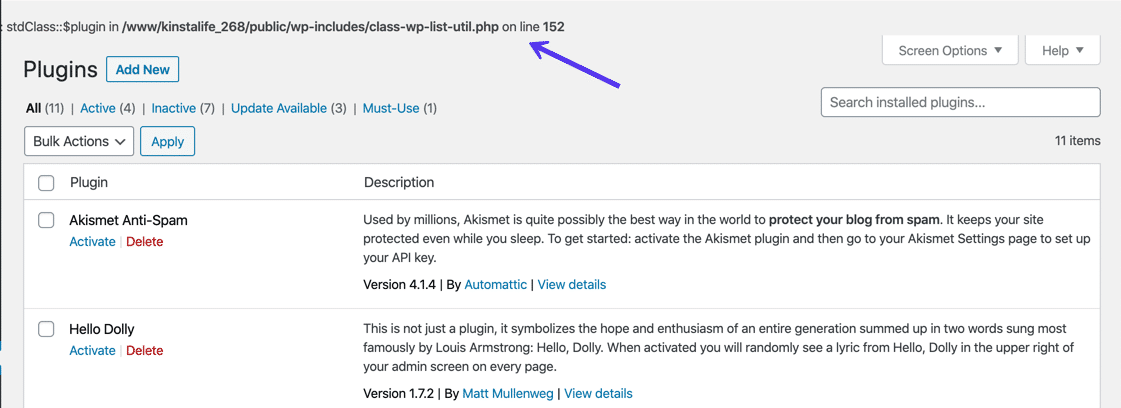
You can then fix the problem or report it to your developer or the theme/plugin’s developer.
What Is the WordPress Debug Log?
When you enable WordPress debug mode by itself, you’ll see messages like the example above on your site in the moment – but those messages won’t be saved anywhere.
If you want to save them, you can also enable the WordPress debug log to save all of those messages and errors to a file on your server.
When enabled by setting the WP_DEBUG_LOG constant to true, WordPress will write all issues to the following file:
wp-content/debug.log
However, you can also specify a custom file path to write the log to a different location on your server.
If you want to save problems to the log but not publicly display them within the HTML of your pages (like the example screenshot above), you can also use the WP_DEBUG_DISPLAY constant to keep debug mode enabled but not display messages on your site.
Typically, you’ll want to combine WP_DEBUG_DISPLAY with WP_DEBUG_LOG.
How to Enable WordPress Debug Mode
To enable WordPress debug mode, you have several options. We’ll cover three methods to enable it:
How to Enable WordPress Debug Mode in MyKinsta
If you host your WordPress site at Kinsta, we built an easy tool that lets you enable the WordPress debug mode without needing to edit your wp-config.php file.
This tool is convenient for being able to quickly enable debug mode and display messages on your site, but it doesn’t let you control the WordPress debug log or whether or not to display messages on live pages. If you want to use just the debug log, you might prefer the plugin method in the next section.
To get started:
- Open your MyKinsta dashboard.
- Select the site where you want to enable debugging from the Sites list.
- Go to the Tools tab in that site’s dashboard.
- Click Enable under WordPress debugging.

You can use the tool on both your live and staging environments. Whenever possible, though, we’d recommend using it with your staging environment because enabling WordPress debug mode might display details about your site’s PHP code to visitors (which is confusing for visitors and also a security risk).
When you’re finished, you can disable debug mode by clicking the Disable button in your Kinsta dashboard:

How to Use a WordPress Debug Plugin
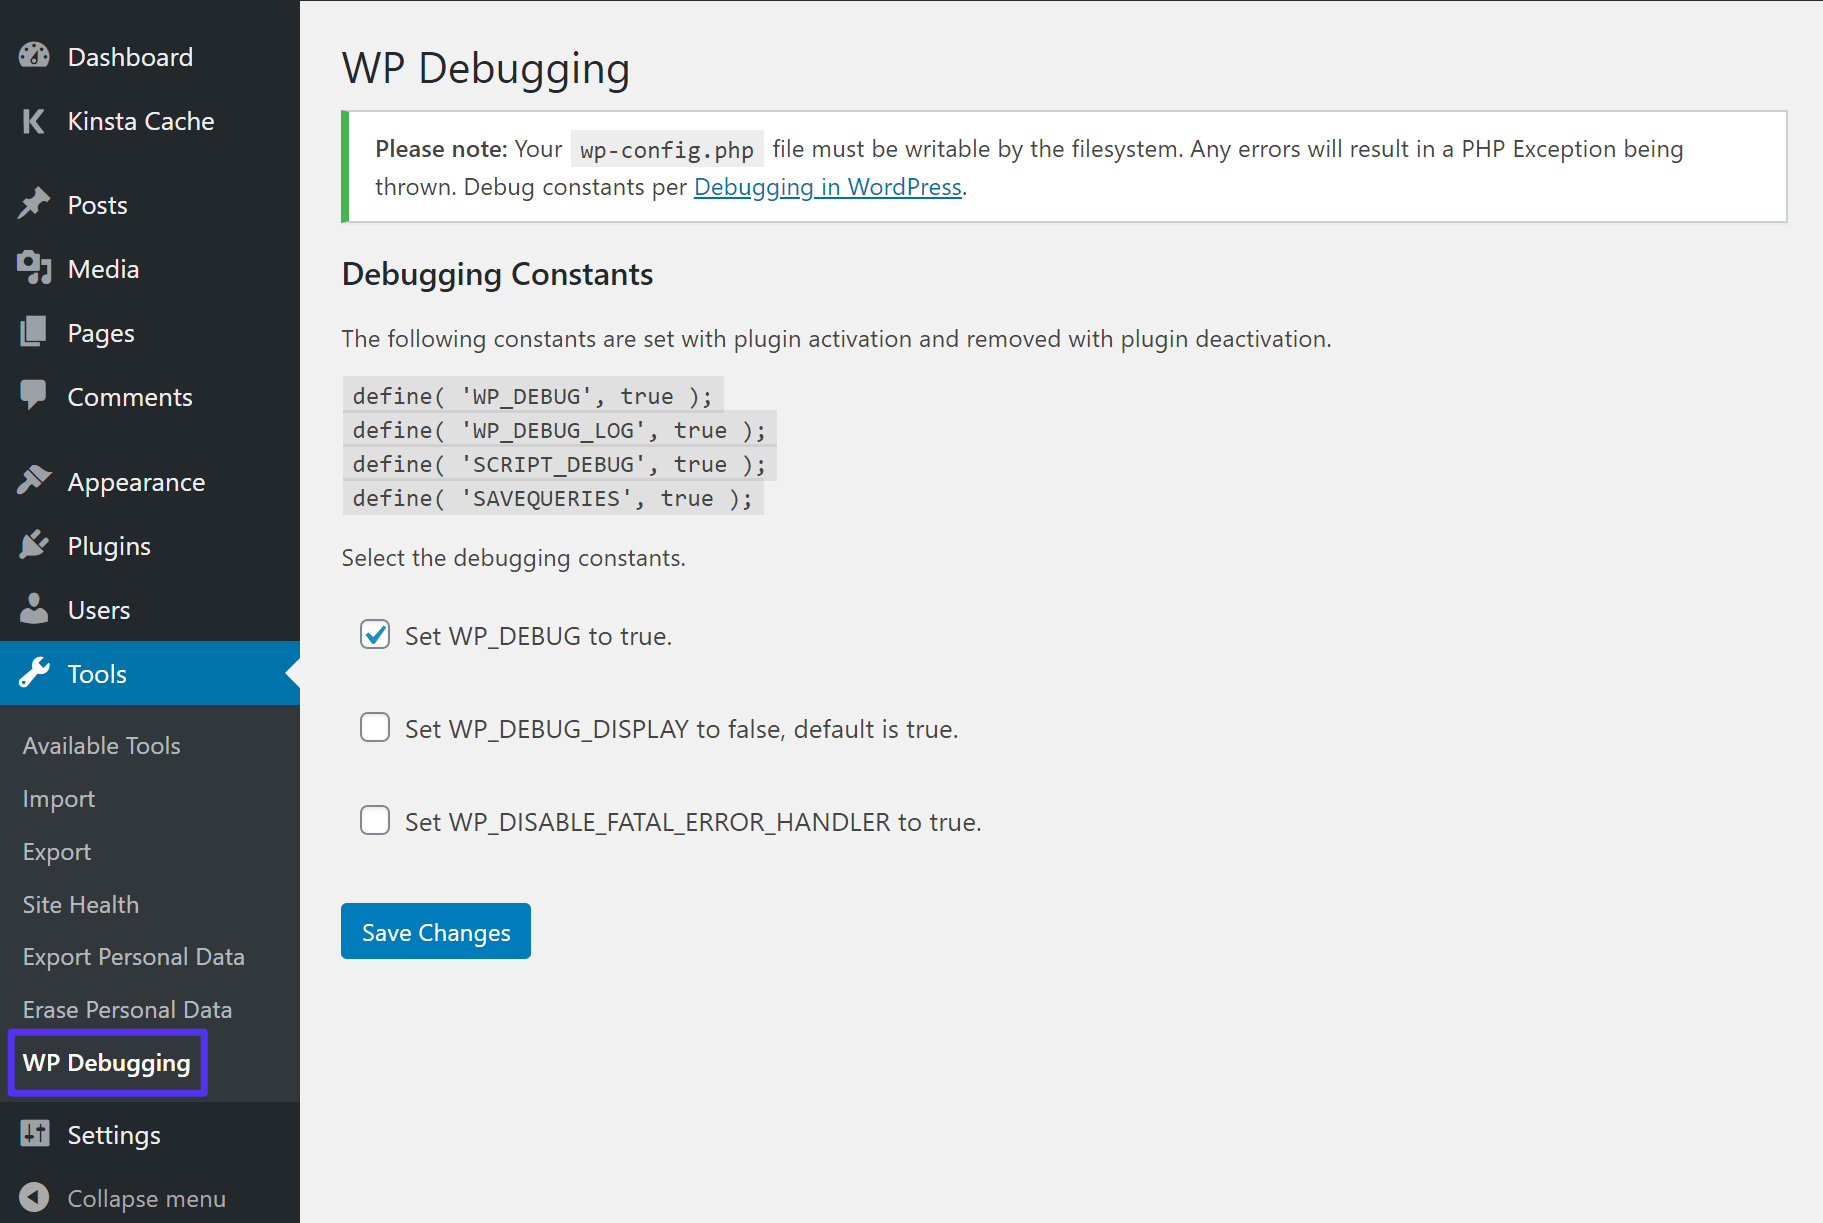
If you’re not hosting at Kinsta, you can also find free WordPress debug plugins that make it easy to enable debug mode. There are several options at WordPress.org, but we recommend the free WP Debugging plugin from Andy Fragen.

Once you install and activate the plugin, it starts working right away. By default, it sets the following constants to true (that is, it enables the following features):
WP_DEBUG– enables debug mode.WP_DEBUG_LOG– saves messages to a log file.SCRIPT_DEBUGSAVEQUERIES
We’ll cover what the last two constants do a little later on in this post.
To configure a few options, you can go to Tools → WP Debugging:
Once you’re finished, make sure to disable the plugin to disable debug mode.
How to Manually Enable WordPress Debug Mode
Finally, you can also enable WordPress debug mode by manually adding the constants to your wp-config.php file.
To get started, connect to your server via FTP and edit the wp-config.php file. By default, this file is in the root folder of your site (unless you moved it for security reasons).
To enable just the basic WordPress debug mode, add the following code snippet above the line that says /* That’s all, stop editing! Happy blogging. */:
// Enable WP_DEBUG mode

define( 'WP_DEBUG', true );
You can also use some of the following constants according to your preferences:
// Enable Debug logging to the /wp-content/debug.log file

define( 'WP_DEBUG_LOG', true );

// Disable display of errors and warnings

define( 'WP_DEBUG_DISPLAY', false );

@ini_set( 'display_errors', 0 );
Once you’re finished, you can either set the constants to false or just remove the snippet to disable debug mode.
Make Sure to Disable Debug Mode in WordPress When You’re Finished
The debug mode is useful when you’re trying to troubleshoot problems with WordPress, but you shouldn’t leave it enabled 24/7 because it can reveal text from your PHP code to website visitors.
We mentioned this above – but this is just a reminder to always disable debug mode when you’re finished troubleshooting.
Other Ways to Debug WordPress
Beyond the built-in debug tool that we featured above, there are several other built-in and third-party tools to help you debug your WordPress site.
Script Debug
SCRIPT_DEBUG is another built-in constant that forces WordPress to use the dev versions of core CSS and JavaScript files instead of the minified versions that it usually loads.
This can be helpful if you’re testing changes to the built-in .js or .css files.
To enable SCRIPT_DEBUG, you can either:
- Use the free WP Debugging plugin from above, which enables it by default.
- Add the following constant to your wp-config.php file –
define( 'SCRIPT_DEBUG', true );
Database Query Debugging
If you’re having issues with your site’s database, you can enable database query logging using the SAVEQUERIES constant to track:
- Each database query.
- The function that called the database query.
- How long the query took.
To enable query logging, you can either:
- Use the free WP Debugging plugin from above, which enables it by default.
- Add the following constant to your wp-config.php file –
define( 'SAVEQUERIES', true );
Note: this will impact your site’s performance so try to use it on a staging site whenever possible and disable it as soon as you’re finished.
Query Monitor Plugin
The Query Monitor plugin is a free plugin that’s helpful for debugging a number of different areas in WordPress including:
- Database queries.
- PHP errors.
- Hooks and actions.
- Block editor blocks.
- Enqueued scripts and stylesheets.
- HTTP API calls.
- User capabilities.
Overall, it’s one of the best WordPress debug tools that you’ll find, which is why it has almost a perfect 5-star rating on over 320 reviews.
Once you install and activate the plugin, you’ll get some new options on the WordPress toolbar that display debug information. When clicked, those options will open a new Query Monitor box that gives you more information:

For a more detailed look, we have an entire post on how to use the Query Monitor plugin.
New Relic
New Relic is a premium tool for analyzing and debugging your site’s performance. It can help you discover bottlenecks and issues that are affecting your site’s performance.
Kinsta already includes the built-in APM tool. However, you can still use New Relic in the MyKinsta dashboard, provided you have your own license.
Server Logs
Finally, your server logs can also be a useful tool in debugging WordPress.
If you host at Kinsta, you can view all of your server logs from the Logs tab in a site’s dashboard:

If you host elsewhere, you’ll need to consult your host’s documentation to learn where you can access your server logs.
Summary
If you need to debug WordPress, the built-in WordPress debug mode provides a useful way to view PHP errors and notices.
If you host at Kinsta, you can enable it right from your dashboard. Otherwise, you can enable it with plugins or by adding code snippets to your site’s wp-config.php file.
For more help, you can also use other built-in tools or third-party tools like New Relic (your own license is required) and the free Query Monitor plugin.
Do you have any other questions about how to debug WordPress? Leave a comment and let us know!

Jon is the Chief Operating Officer at Kinsta and is involved with Kinsta's sales, customer service, and technical support teams on a daily basis. Jon's a family man. So when he isn't feverishly tapping the keys of his laptop he's usually helping one of his kids fix a bike or setting up Netflix for an impatient preschooler.

