
Scaling problems rarely appear out of nowhere. They usually build quietly until a campaign launch, a traffic spike, a seasonal rush, or a slow checkout experience forces everyone to pay attention.
Some teams optimize early based on assumptions. Others wait until slowdowns, complaints, or rising costs make action unavoidable. Both approaches create risk. One can waste your budget. The other can leave your site underprepared when growth arrives.
Analytics gives teams a better way to decide when to act. In this article, we explain how analytics can be used as a planning tool to reveal thresholds, constraints, and usage patterns before they become bigger problems.
Why scaling decisions often happen too late
Scaling decisions often happen at the worst possible moment, after something has already started to break.
A site slows down during a campaign. The checkout flow begins to lag under peak traffic. Internal teams start reporting issues they can’t fully explain. What could have been a planned adjustment turns into an urgent overnight fix.
This reactive pattern is common because many teams don’t have a clear view of when their infrastructure is approaching its limits. They may see traffic growing, but not understand how that growth affects server resources, cache performance, bandwidth, or database activity. So they wait until the signs become impossible to ignore.
The opposite happens too. Some teams upgrade early out of concern for future growth, even when the data doesn’t show consistent pressure. That leads to unnecessary spending, especially when the real issue could have been solved through better caching, code cleanup, or workflow changes.
Reactive scaling creates several problems that make growth harder to manage:
Decisions happen under pressure
When scaling is triggered by a slowdown, outage, or traffic spike, teams are forced to diagnose issues while the business is already feeling the impact. That pressure leads to rushed choices and temporary fixes that don’t address the real cause.
Planning becomes guesswork
Instead of using trends to guide budgets and timelines, teams tie infrastructure decisions to emergencies. That makes it harder to predict when capacity will be needed or justify the cost.
Confidence erodes over time
When every scaling decision feels urgent, teams start to question their judgment. They’re unsure whether they acted too late, too early, or for the wrong reason. Over time, infrastructure starts to feel like a recurring risk instead of something they can control.
Reporting tells you what happened, but operational analytics tell you what to do next
Most teams already have access to reporting. They can see traffic trends, page views, conversions, and referral sources. That information is useful, but it only tells part of the story.
Surface-level reporting shows outcomes. It tells you how many people visited your site, what they did, and whether they converted. What it doesn’t show is how your infrastructure handled that activity behind the scenes. That gap matters more as you grow.
A spike in traffic might look like a win in a reporting dashboard, but it doesn’t explain whether your server was under strain, whether PHP threads were maxed out, or whether caching kept things running smoothly. Two sites can see the same increase in visits and have completely different performance outcomes depending on how their resources are being used.
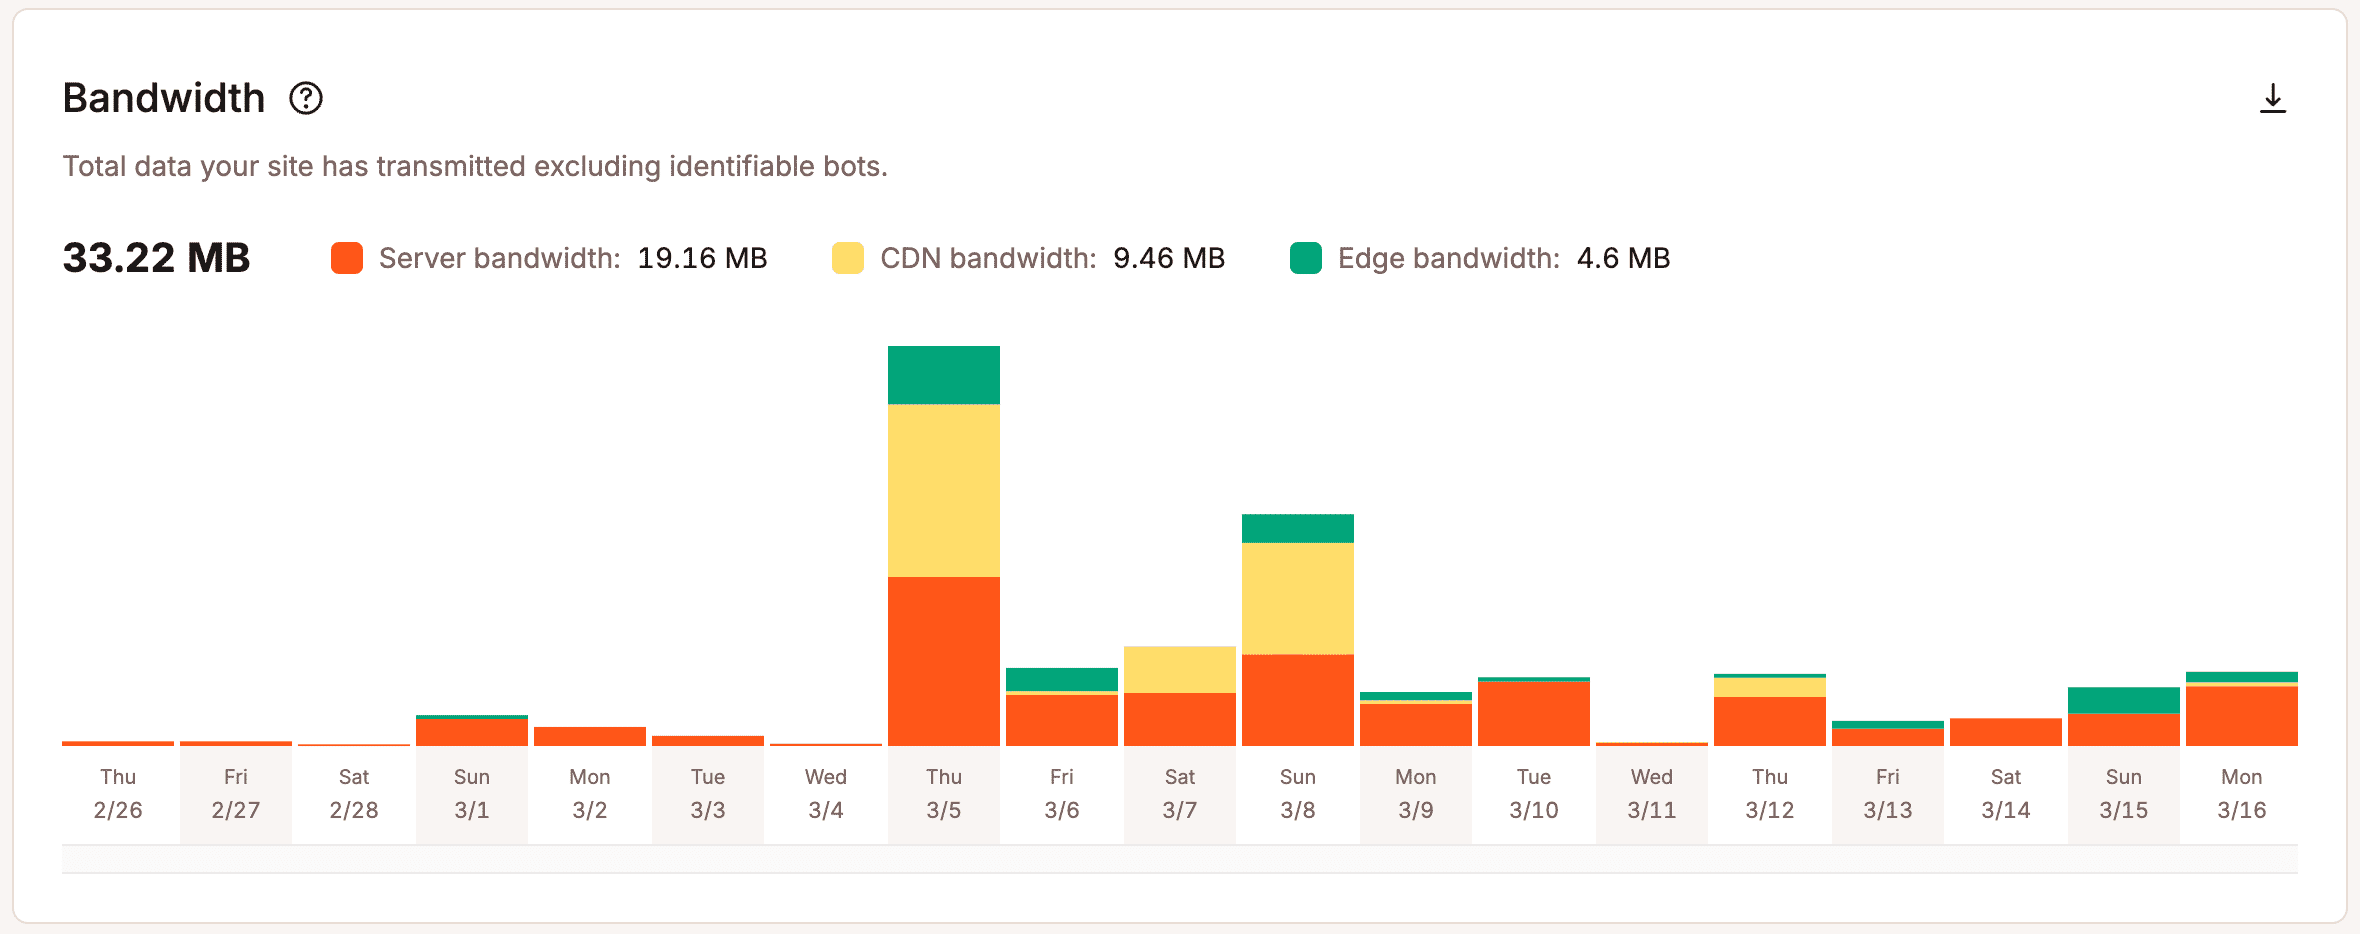
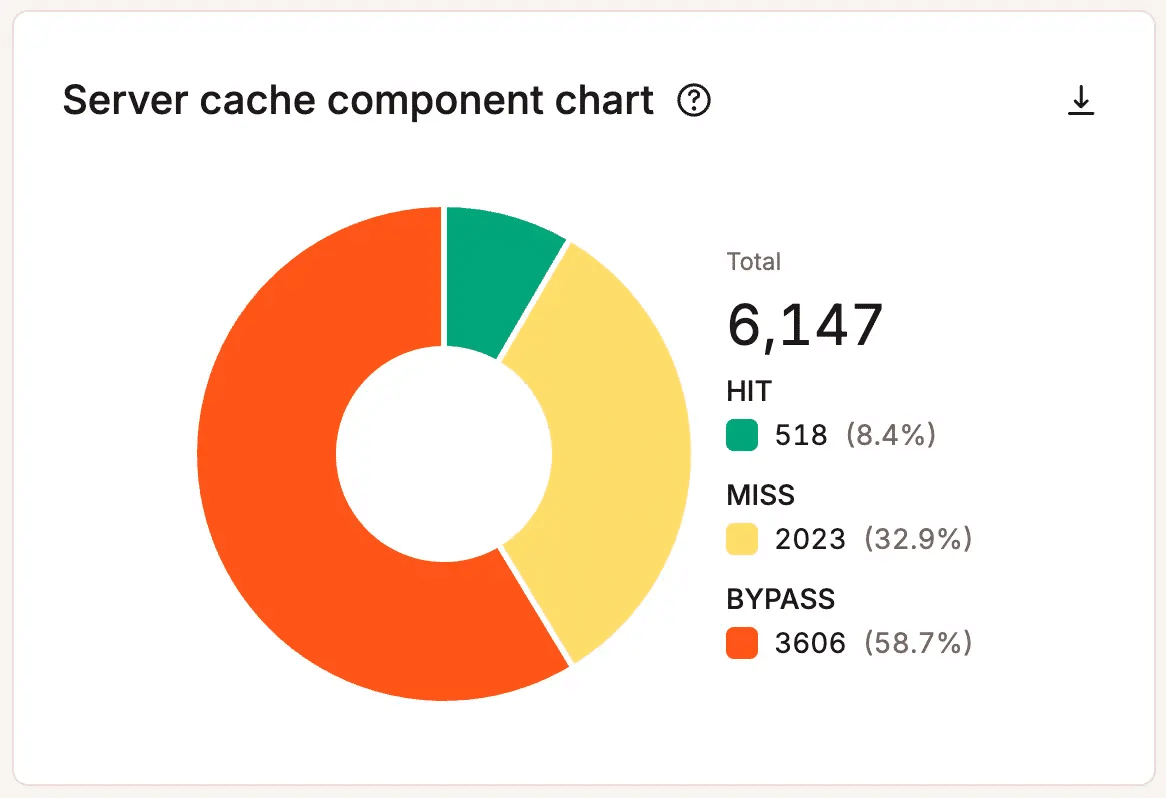
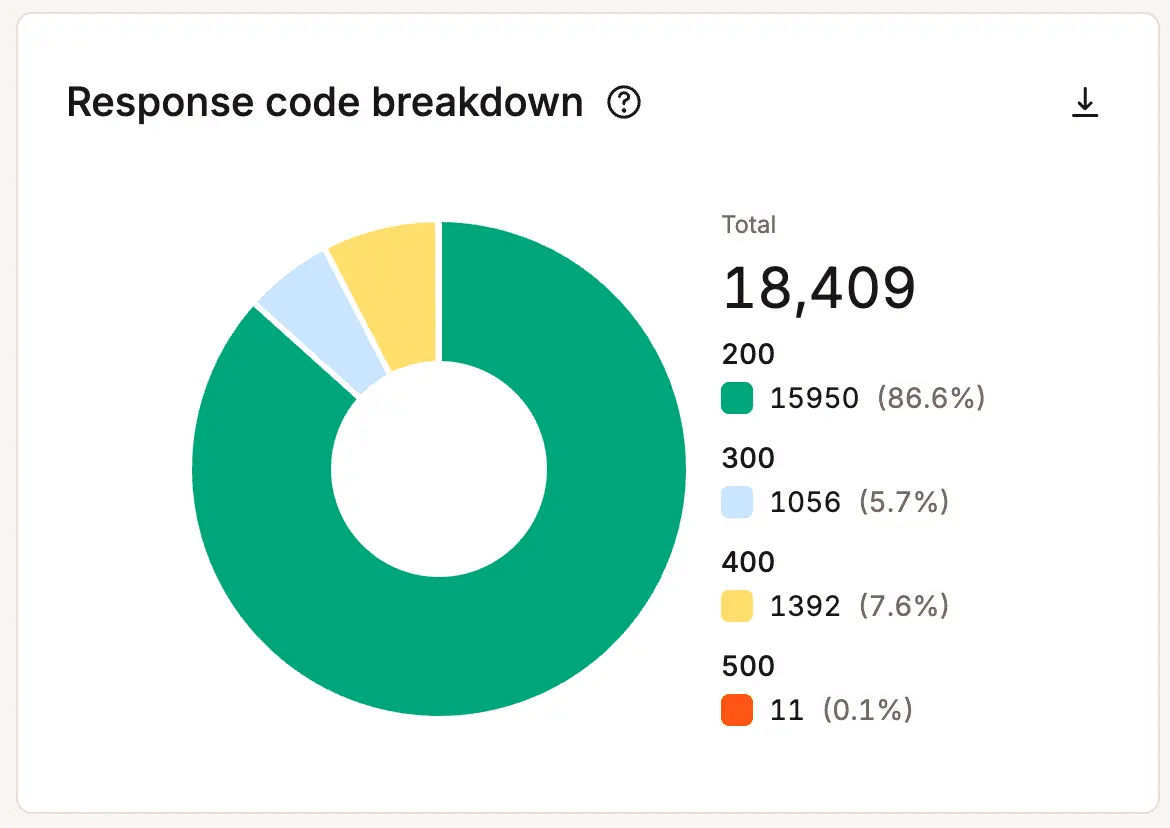
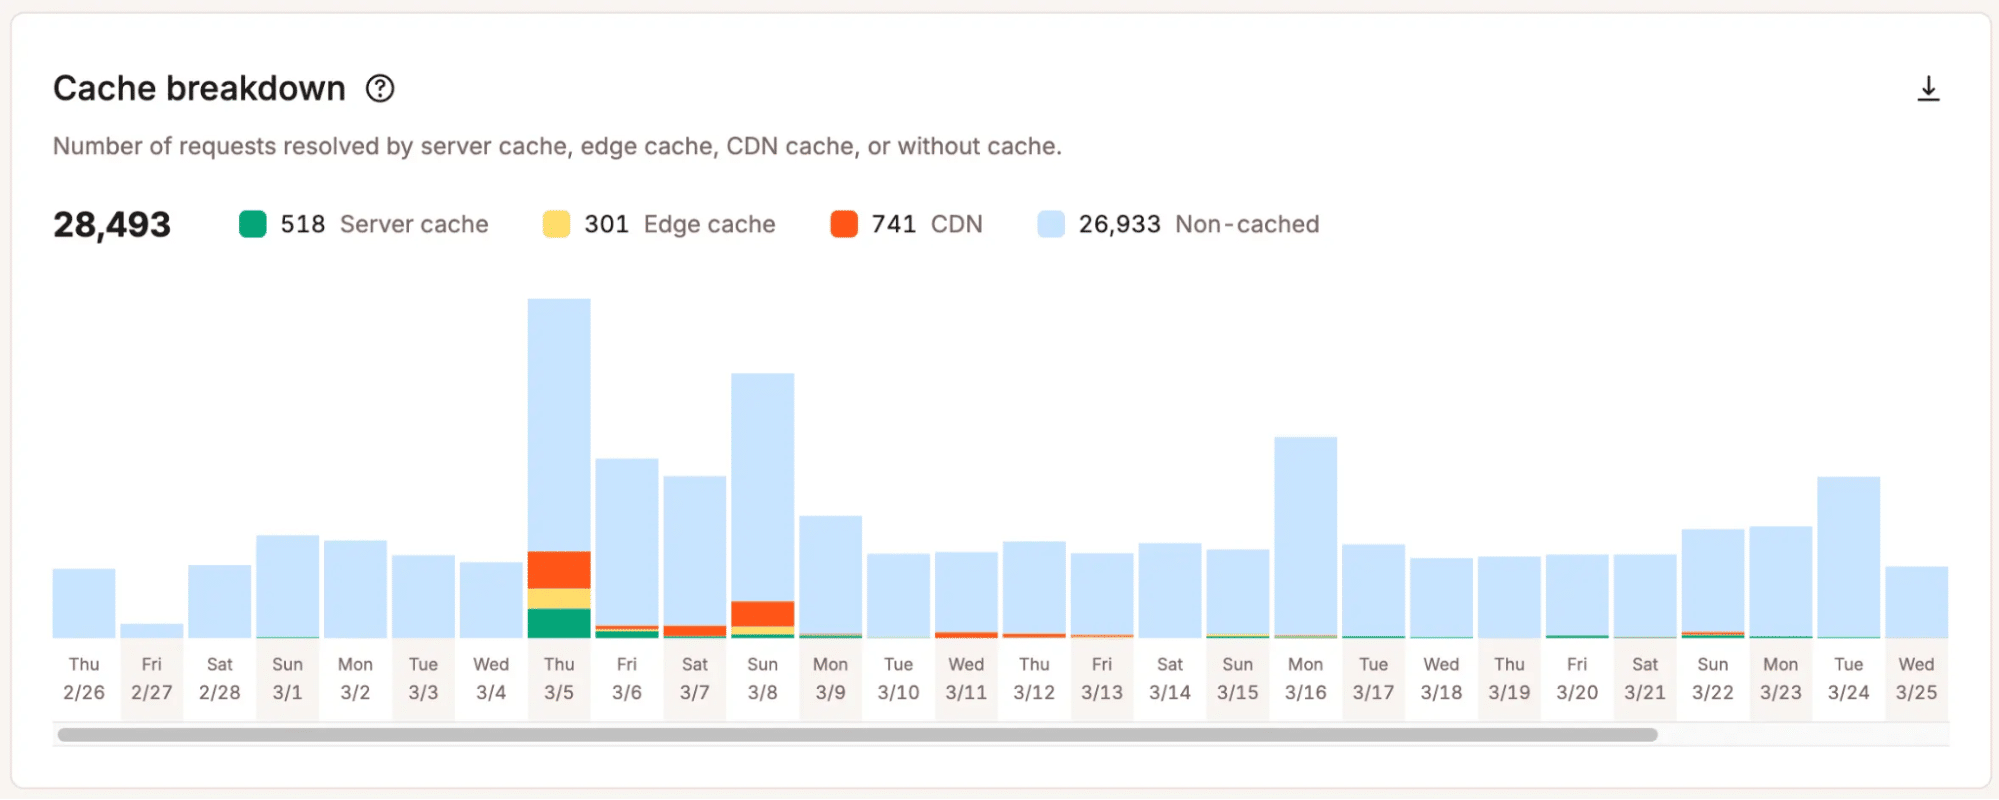
Operational analytics provides a deeper look. Instead of focusing only on outcomes, they show what’s happening beneath the surface. Teams can see how requests are handled, how resources are used, and where pressure starts to build. Metrics like bandwidth usage, cache efficiency, PHP thread activity, and response behavior give teams a clearer picture of how their infrastructure handles real-world demand.
Without that visibility, scaling decisions turn subjective. Teams react to isolated incidents, rely on instinct, or plan for worst-case scenarios without knowing how likely those scenarios are.
The signals that show it’s time to optimize or scale
The real question is not, “Can we make the site faster?” Most teams can always find something to tune, clean up, or improve.
The better question is, “What does the data tell us to do next?”
Analytics helps teams distinguish between a temporary blip and a real capacity issue. Instead of acting on vague concern, they can look at measurable signals that show when optimization or scaling needs attention.
Traffic trends that keep climbing
A single traffic spike does not always mean a site needs more resources. It may come from a one-time email campaign, a social mention, a PR hit, or a seasonal event. Those moments are worth reviewing, but they do not always point to a long-term scaling need.
Sustained growth tells a different story. If visits, requests, or logged-in activity keep rising over time, your current setup may need a closer look. Repeated increases can gradually add pressure to server resources, database activity, caching layers, and bandwidth.
Trend data helps teams plan ahead. When they see traffic climbing month after month, they can test performance, identify weak spots, and make improvements before growth slows.
Resource usage patterns that point to strain
Traffic alone doesn’t show how hard your site works. Even a modest number of visitors can strain the site when dynamic pages, heavy database queries, weak caching, or background processes consume excessive resources.
Hosting-level analytics show where pressure builds. Teams can review PHP thread usage, bandwidth consumption, cache hit and miss rates, database activity, response codes, and request volume.
Look for patterns, not one-off peaks. A brief PHP thread surge during a busy hour may not matter. But repeated peaks, rising bandwidth demands, or consistently weak cache performance can show that your site needs optimization, a workflow review, or more capacity.
Performance issues that appear under specific conditions
Some performance issues only appear when your site comes under pressure. A site may feel fast on a normal day, then slow down during a product launch, fundraising push, enrollment period, Black Friday sale, or major content campaign.
Those moments often reveal the real limits of your current setup.
Analytics helps teams determine whether the issue is temporary, recurring, or likely to worsen. If performance dips only during rare traffic surges, the team may need to improve campaign preparation. If slowdowns occur whenever demand rises, the site likely needs deeper optimization or a more scalable hosting setup.
Errors and anomalies that become early warning signs
Errors, failed requests, and unusual activity can warn teams before visitors feel the full impact.
Rising error rates may indicate infrastructure strain, application issues, resource bottlenecks, or failed processes. Unusual traffic patterns may reveal bots, abusive requests, or unexpected demand that uses resources without creating business value.
These signals give teams a chance to act early. When they see errors and anomalies in context, they can investigate the cause, reduce unnecessary strain, and protect the customer experience before small warning signs turn into visible problems.
How analytics support smarter scaling decisions
Analytics helps teams move from “something feels off” to “here’s what the data shows.” That shift makes scaling decisions more practical, less reactive, and easier to defend.
It also helps teams choose the right next step. Not every slowdown or spike calls for a bigger hosting plan. Sometimes optimization makes more sense. Other times, the data points to a workflow issue, a resource-heavy process, or a broader infrastructure change.
Knowing whether to optimize before upgrading
More capacity isn’t always the best first move. If analytics shows poor cache efficiency, unusually heavy requests, inefficient code, or resource-heavy background tasks, the team may improve performance before changing plans.
That may mean refining caching rules, cleaning up plugins or custom code, reviewing database queries, or adjusting processes that create avoidable load. In these cases, analytics helps teams avoid paying for more capacity when better efficiency solves the issue.
Knowing when an upgrade is justified
At some point, optimization may not be enough. If the data shows consistent resource pressure, recurring slowdowns during normal growth, rising bandwidth needs, or clear usage ceilings, the team can more easily justify an upgrade.
For example, the chart below shows that this site reached the maximum number of allocated PHP threads, 69, 69 times in less than 30 days.
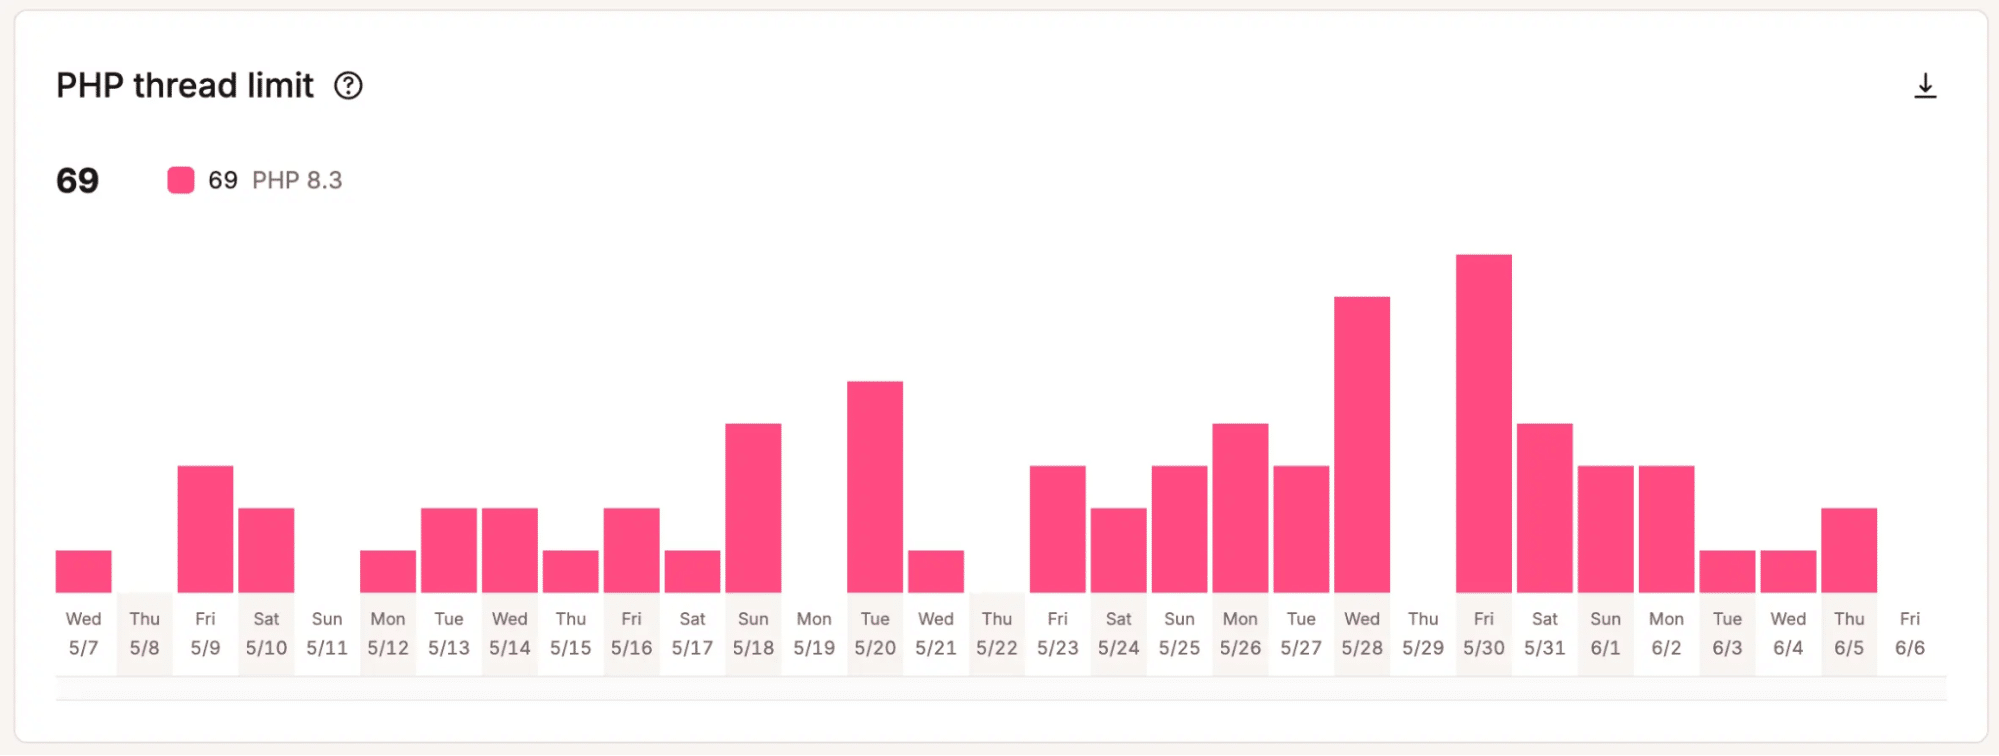
That matters when teams need to decide whether added capacity is worth the cost. Instead of relying on a hunch, they can point to patterns that show the current setup is reaching its limits.
Knowing how to explain the decision internally
Scaling decisions rarely stay within the technical team. Leadership, finance, marketing, and operations all want to understand why the change matters and why now.
Analytics helps teams build a clear business case. Instead of relying on opinion, they can point to real data and connect infrastructure spend to site reliability, campaign readiness, customer experience, and revenue protection. That shifts the conversation from technical preference to measurable risk, timing, and expected impact.
Why reactive hosting makes scaling harder
Reactive hosting makes growth harder to manage because teams don’t see the limits until they already feel the impact.
Many hosting environments give teams only a limited view of actual capacity thresholds. Teams may know their plan limits, but they can’t always see how close the site is to strain or which parts of the stack create the most pressure.
That creates a frustrating pattern. The site slows down, a campaign underperforms, or support tickets start coming in. Then the team investigates, contacts the host, and considers an upgrade after the issue has already affected the business.
This model adds uncertainty. It makes infrastructure harder to forecast, justify, and trust. For growing teams, that lack of clarity turns scaling into a reaction instead of a planned part of growth.
How Kinsta helps teams scale with more confidence
Kinsta gives teams a clearer view of how their WordPress sites perform under real demand. With MyKinsta analytics, teams can track traffic patterns, resource usage, performance signals, and emerging pressure points without treating hosting like a black box.
That visibility makes scaling less reactive. Teams spot trends earlier, plan for growth with more confidence, and make infrastructure decisions backed by real data.
Analytics that reveal actual constraints
Kinsta helps teams see where limits start to emerge. MyKinsta analytics shows signals like traffic trends, bandwidth usage, cache performance, response codes, and resource activity, giving teams a more practical view of how their site handles demand.
That clarity matters because scaling decisions should not depend on vague assumptions. When teams see where pressure builds, they can decide whether to optimize, adjust their plan, or take a deeper technical look.
A platform built for informed decisions
Growth often brings budget questions, launch planning, and pressure to justify new spend. Kinsta supports those conversations with clearer data around site usage and performance.
That makes infrastructure planning easier to explain. Instead of asking for more capacity because the site “feels slow,” teams can connect the decision to measurable trends, recurring strain, or specific growth needs.
Predictability as a growth advantage
Scaling feels less stressful when teams see what’s changing before it becomes urgent. With better visibility into usage patterns and performance signals, teams can prepare for campaigns, seasonal demand, and long-term growth with more confidence.
That predictability gives teams a hosting platform they can understand, plan around, and trust as growth continues.
Stop treating analytics like a reporting add-on
Analytics works best when it shapes how you plan, not just how you review performance after the fact.
When you can see trends, usage patterns, and early signs of strain, you can time scaling decisions better and justify them more clearly. You don’t have to guess when to act or react under pressure. You can make informed choices based on what your site actually does.
This makes growth feel more predictable and far less stressful.
Explore MyKinsta to better understand your usage patterns, performance signals, and scaling needs before they become urgent.