Add as a preferred source on Google
When a WordPress site breaks on a Friday afternoon, the clock starts on two separate problems: fixing the site and agreeing on who caused it.
The second problem almost always takes longer. A developer points at the campaign that just went live. The marketer points at the server. The agency fields calls from both and has no data of its own to work from. By the time everyone agrees on where to look, the outage has already cost real money, and so has the argument.
The root cause isn’t that teams disagree. It’s that each team is working from a different slice of the data. The developer sees the code. The marketer sees traffic. The agency sees the support ticket queue. Nobody sees the same thing at the same time, so no one can rule anything out.
Kinsta’s approach is to put every team on the same diagnostic footing. The data Kinsta’s support engineers use to investigate an issue, such as response codes, PHP performance, cache ratios, and request logs, is the same data available to every MyKinsta user with analytics access. When everyone reads the same signals, a broken site becomes something a team diagnoses together rather than argues about.
It also changes how teams interact with support. This guide walks through the diagnostic tools available in MyKinsta, what each one shows, when to use them, and how to use them as part of a shared workflow rather than a solo debugging session.
Why performance problems become blame problems
A modern WordPress site rarely gives one person responsibility for everything. Developers manage the codebase. Marketers run campaigns. Agencies or freelancers handle the hosting relationship. Each team is doing their job; the problem is that their visibility doesn’t overlap.
When a site breaks, that gap in visibility quietly converts a technical problem into a personal one:
- Developers inspect the code but not the server. Their view stops at the application layer, so a server-side cause stays invisible to them.
- Marketers see traffic but not the database. A campaign spike looks like the obvious trigger because it’s the only variable they can measure.
- Agencies field the complaint but hold none of the data. They become a relay between parties rather than a source of answers.
With no shared reference point, each party assumes the cause sits with someone else. Many hosting platforms quietly reinforce this pattern by keeping diagnostic data inside the support team. You open a ticket and wait while someone else reads the logs you don’t have access to.
Kinsta takes the opposite approach. Let’s now see which tools to reach for first, and how to use them as a shared workflow, not a solo one.
What the MyKinsta analytics dashboard shows when something goes wrong
When a site misbehaves, the first job is to determine what kind of problem you’re dealing with. Slow, broken, and overloaded sites each call for a different response. Getting that diagnosis wrong, like treating a caching problem like a server problem, or an error spike like a traffic problem, wastes everyone’s time.
MyKinsta’s Analytics section is where that diagnosis starts.
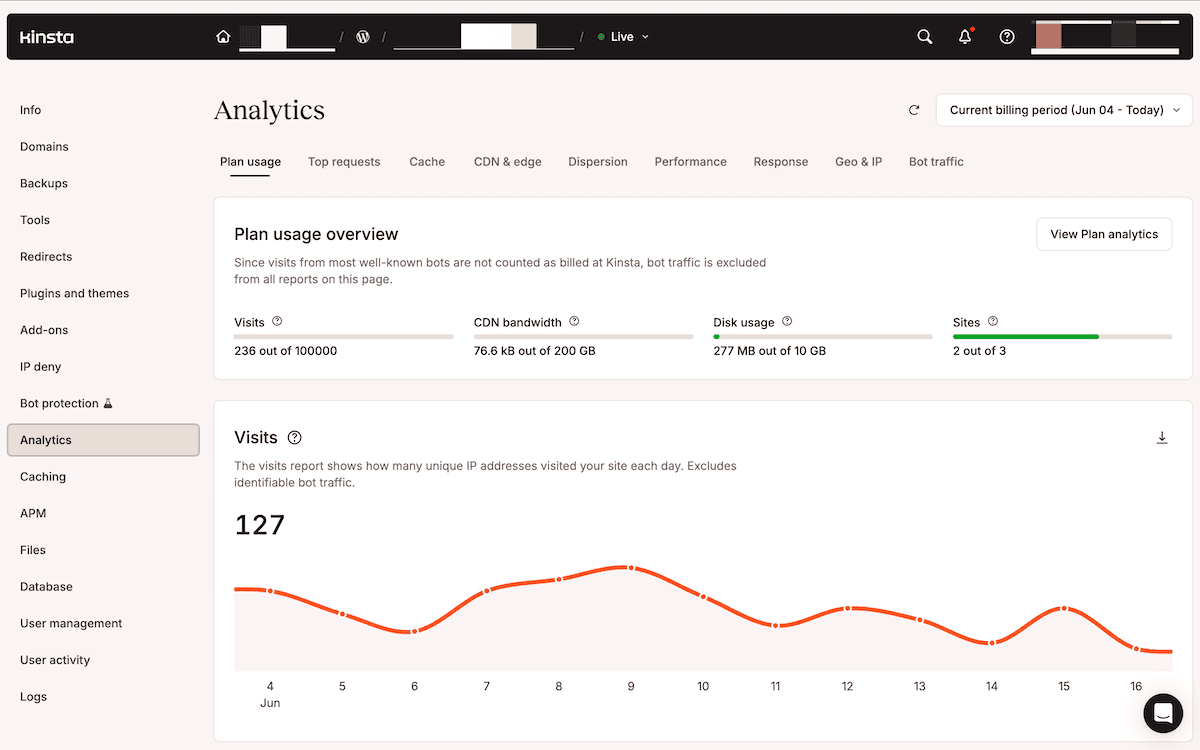
There’s company-level data under the Analytics section of MyKinsta. For a single site, you head to Sites > sitename > Analytics. Regardless, the same reports are open to every user with analytics access.
Confirm whether the site is actually returning errors
Before anything else, establish whether the site is genuinely failing or just slow. These have different causes and different fixes, and mixing them up is where the blame conversations start.
The Response tab answers this question. Its central chart, the Response code breakdown, shows the distribution of HTTP status codes your site served over the selected time period.
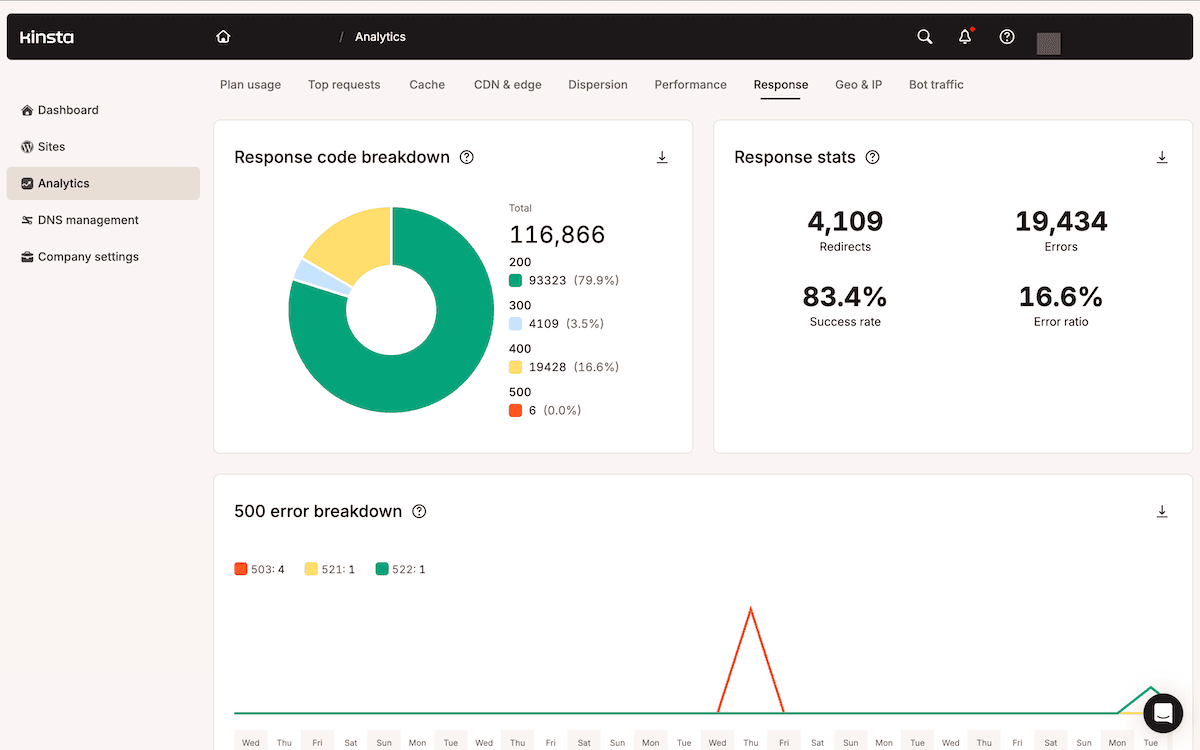
As such, a cluster of 5xx codes points at the server or the application, while 4xx codes point at resource access issues. Two further charts let you drill down further:
- The 500 error breakdown separates a generic 500 from a 502 bad gateway or a 503 service unavailable, which point at different causes.
- The 400 error breakdown splits the client-side codes apart, distinguishing a flood of 404s from the other responses that signal authentication, permission, or rate-limiting problems.
Because every user with analytics access reads the same breakdown, you can start to work on the specific failure rather than deliberate.
Tell a slow site apart from a failing one
A site that loads in six seconds and one returning 500 errors will feel similar to a frustrated visitor, but they have completely different causes. The Performance tab is where you separate them.
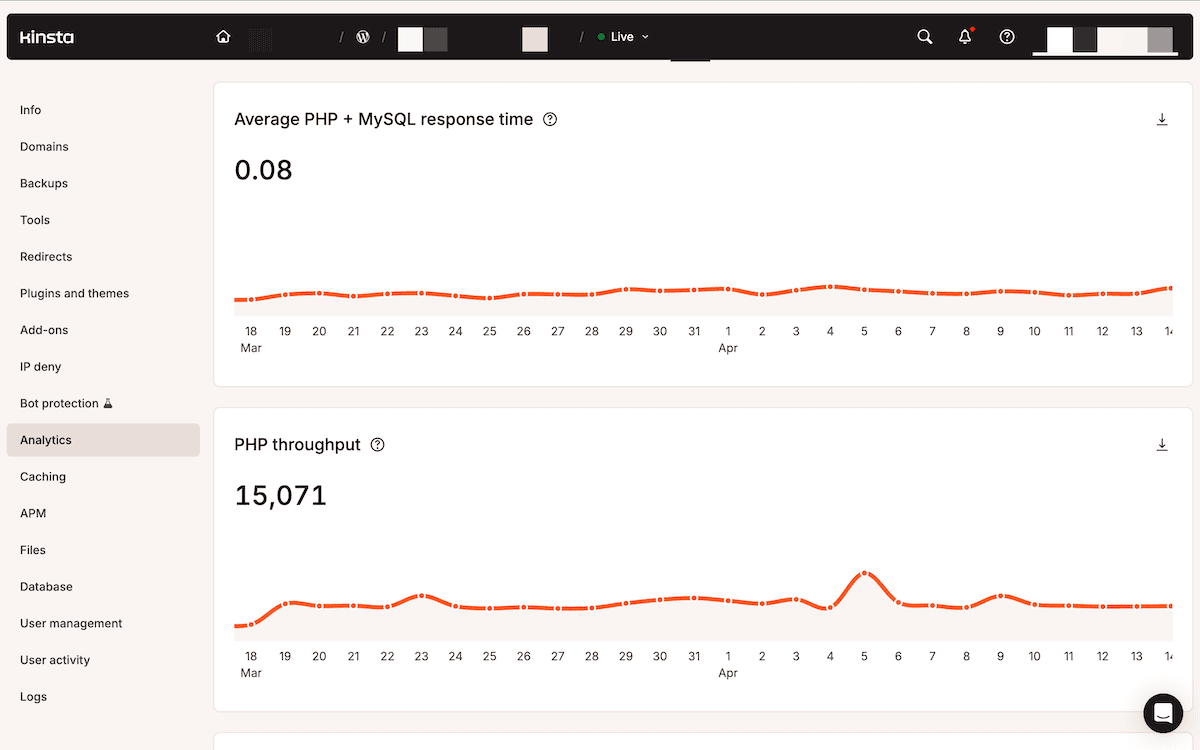
Several reports here are worth checking on any slow-site investigation:
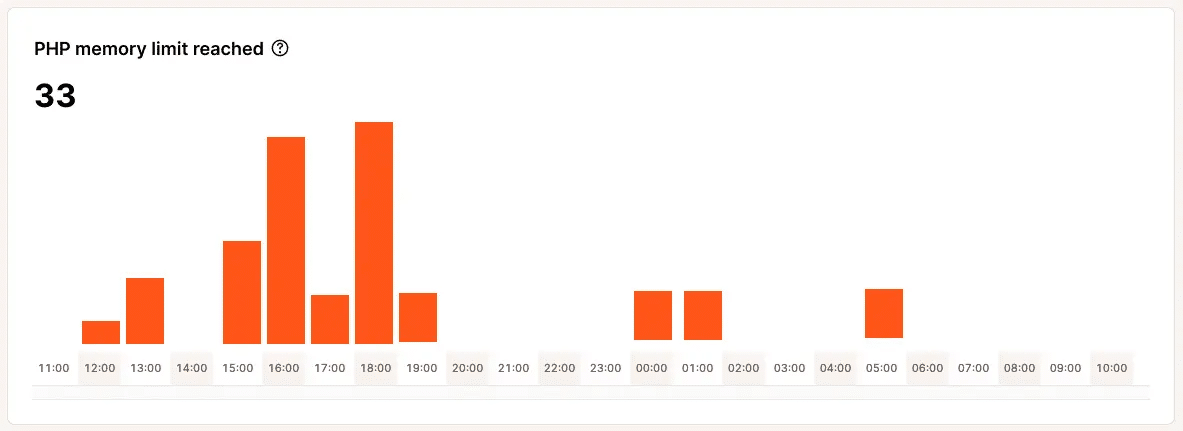
- Average PHP + MySQL response time shows how long the application takes to build and query each uncached request. A sudden spike is usually the first signal of a performance degradation rather than an infrastructure issue.
- PHP throughput shows how many requests executed in the period. If a slowdown lines up with a throughput spike rather than a code change, the likely cause is load, not a bug.
- AJAX usage surfaces spikes in admin-ajax.php activity, a common and easily missed drain on back-end resources caused by plugins and logged-in users running background tasks.
- Top maximum upstream time lists the slowest individual paths, so you can point straight at the page or endpoint dragging the site average up rather than guessing.
Together, these tell you whether the next move is to optimize the application or escalate an outage.
Check how much of the site is being cached
A site can feel slow for reasons unrelated to code or infrastructure: too little of it is being served from cache. When the cache ratio drops, the server processes requests it shouldn’t have to, thereby increasing response times. This is one of the most common causes of an “is it the host?” conversation, and it’s almost never the host.
The Cache section shows how requests are handled across Kinsta’s caching layers.
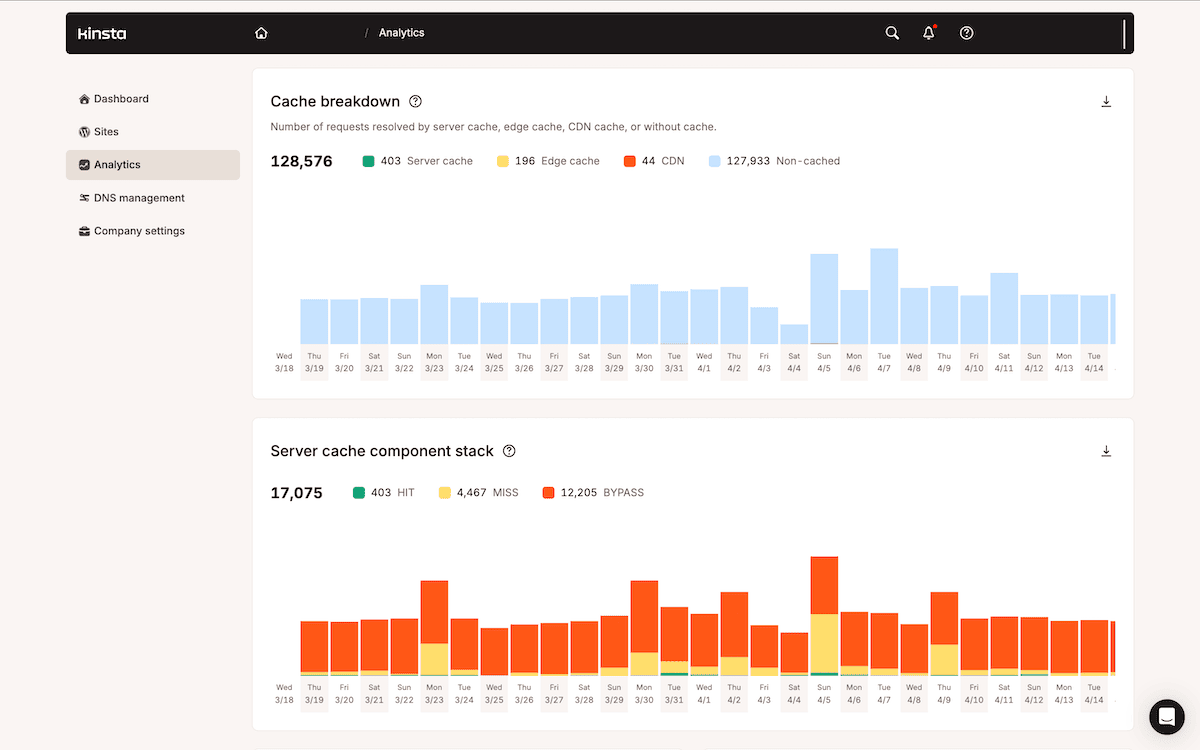
Each request resolves to one of three states:
HITmeans Kinsta serves the request from cache, which is what you want for most traffic.BYPASSmeans a rule or conflict keeps the request out of the cache.MISSmeans the content isn’t cached yet but will be after the first request.
A healthy site’s Cache chart leans heavily on HITs. When the BYPASS rate climbs, the Top server cache bypasses report names the specific paths skipping cache.
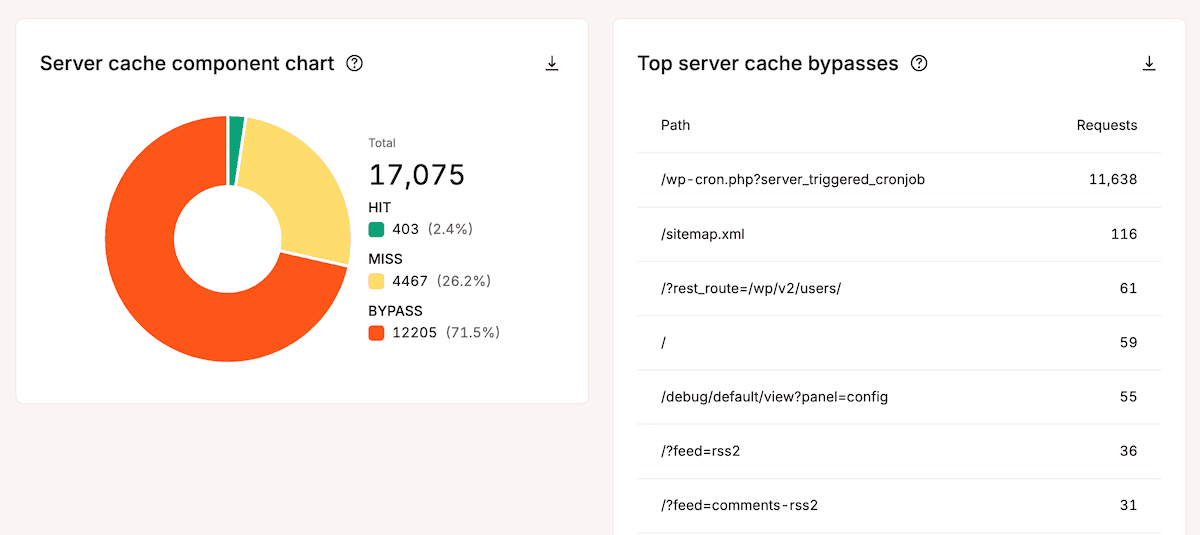
Some bypasses aren’t a problem (such as the WordPress login page never being cached). However, a cacheable page sitting in that list points to a plugin conflict or a caching rule issue. Reading these reports while watching a slow page lets you see whether the page is cached, rather than assuming the host is the problem.
Isolate what’s consuming resources
If a site isn’t returning errors but draws more bandwidth or capacity than it should, you find the source in the Top requests report. Resource problems are the hardest to pin down: a bandwidth overage or a slowdown under load typically carries no error code.
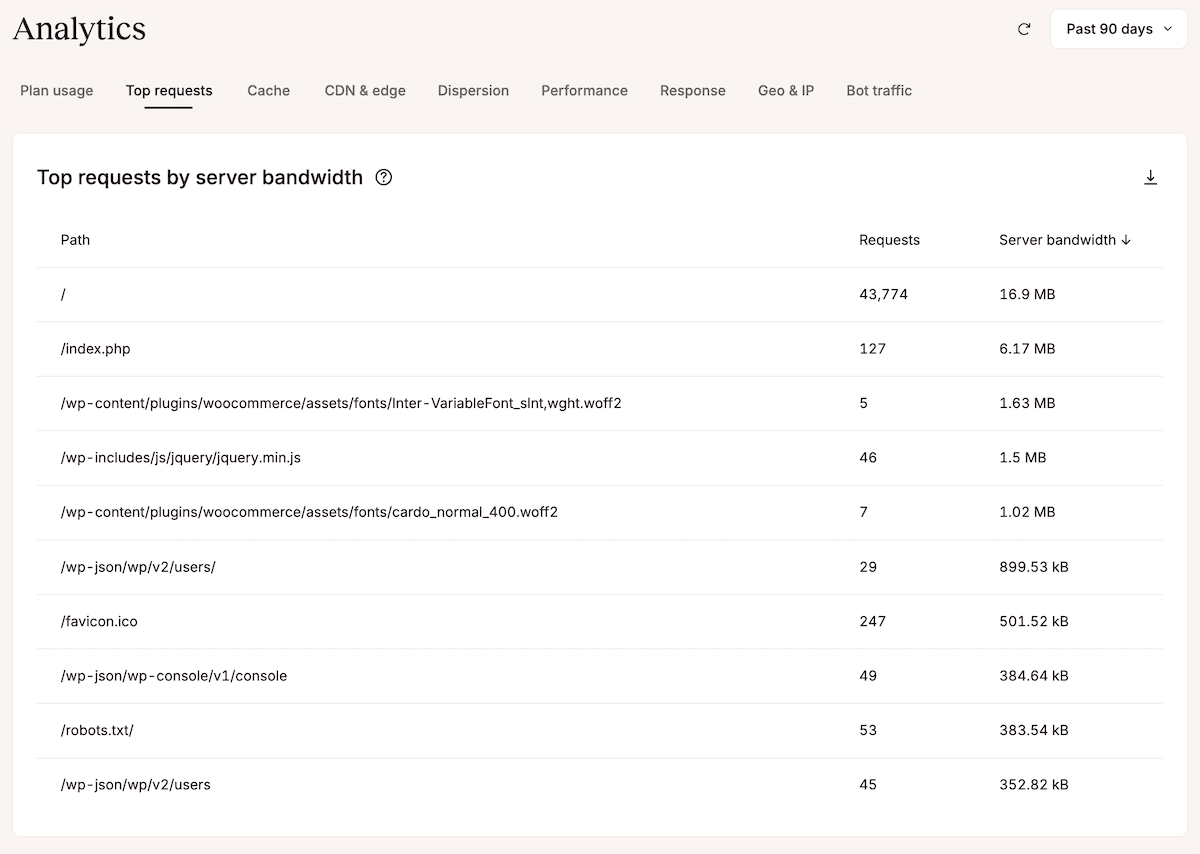
Three reports turn that guesswork into a name:
- Server bandwidth shows which URLs pull the most data straight from your origin server.
- Total bandwidth adds the data served by the CDN and edge cache, so you see the full weight of each request.
- Views show the most-requested resources regardless of size, which surfaces an endpoint under constant load rather than a single heavy file.
Together, they reveal whether a resource spike is due to an oversized media file, a runaway endpoint, or a crawler hitting the same path thousands of times. From there, the fix is typically to optimize the asset, route it through a CDN, or address the endpoint.
If crawler or bot traffic is behind the spike, Kinsta’s Bot Protection lets you identify, classify, and block non-human traffic directly from MyKinsta, without touching a plugin or opening a support ticket.
How APM traces a performance problem to its source
The Analytics reports tell you what is happening on a site. Kinsta’s APM tool tells you why. Where analytics shows you that PHP response time spiked at 2pm, APM shows you which plugin function, database query, or external API call caused it.
APM is included on every Kinsta plan and runs inside MyKinsta.
Run APM as a session, not a constant
Unlike the Analytics dashboard, which records continuously in the background, the APM agent adds load to your server’s CPU and memory while it collects data. Kinsta recommends only running it while actively diagnosing a problem.
To start a session, go to Sites > sitename > APM, click Enable APM, then select a monitoring window — 2, 4, 12, or 24 hours. APM disables itself automatically at the end of the window.
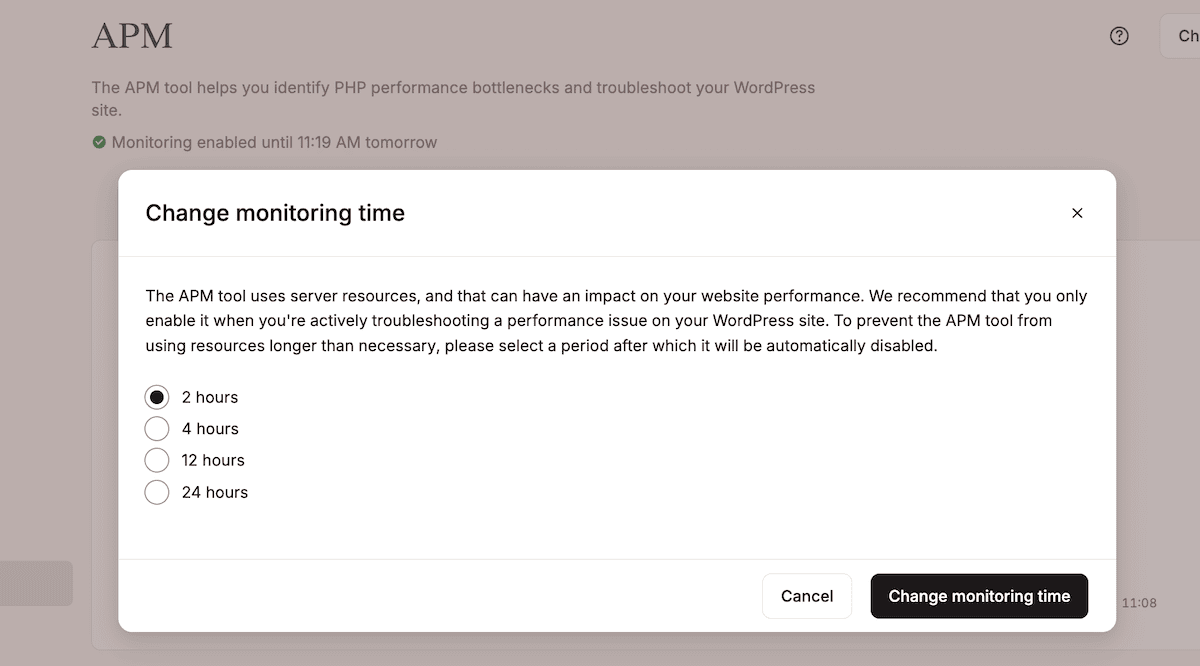
It means you have a simple workflow:
- Start APM when you suspect an issue or can reproduce one, so the overhead stays off your site during normal operation.
- Pick a window that covers the problem, then reproduce the issue or wait for it to recur so the tool captures it with live data.
- Read the results once data accumulates, then turn APM off when you’re done.
Reading APM results
APM organizes collected data across four tabs: Transactions, WordPress, Database, and External.
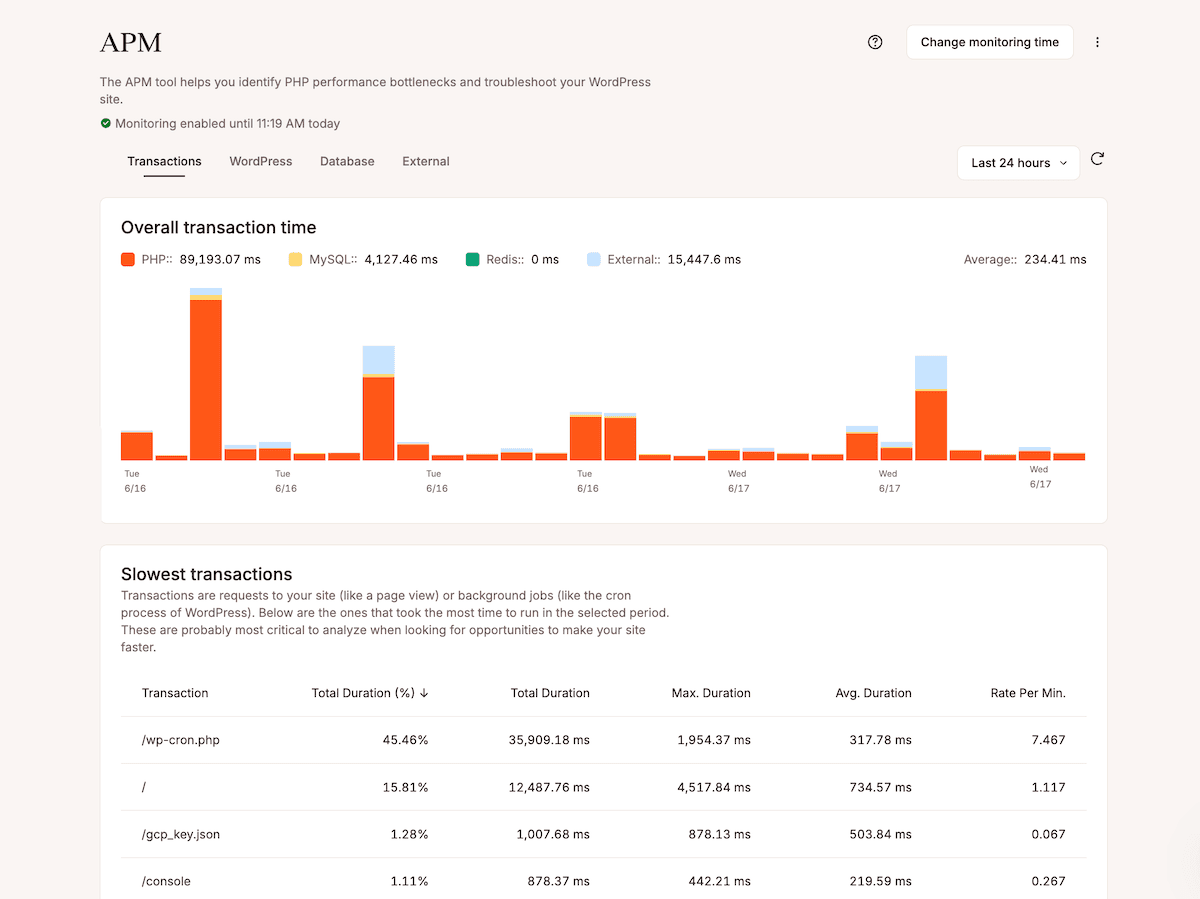
Start with Transactions to find the slowest requests. Clicking into any transaction opens a timeline of every process involved in that request and flags the heaviest spans. This tells you whether to focus optimization effort on a slow database query, a specific plugin function, or a third-party API.
The External tab is particularly useful for ruling out the host. If a transaction’s slowdown comes from an external API call, the APM data shows this explicitly. That’s the difference between a support ticket that says “the site is slow” and one that says “the slowdown is in our email service provider’s API, not the server.”
How the log viewer and activity log reconstruct a timeline
Resolving an incident typically depends on knowing what happened and in what order. Two records in MyKinsta help you reconstruct the timeline: the log viewer captures what the site does and the activity log captures what people do.
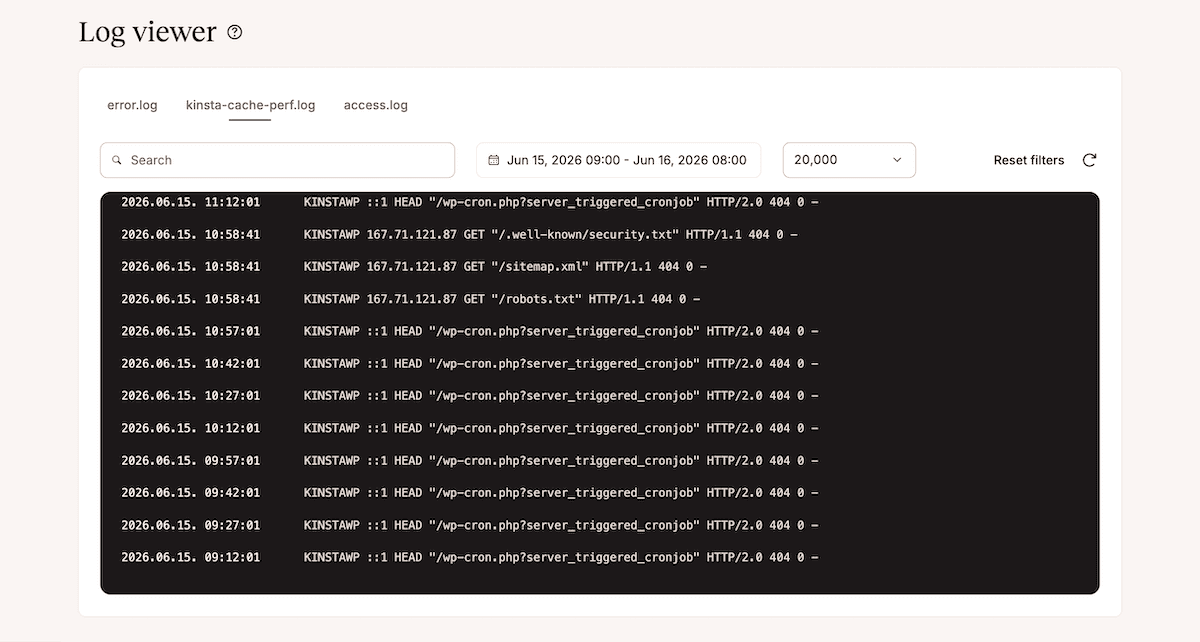
The log viewer shows you what the site reports, not how it performs. There are three files available on the Logs screen for any site in MyKinsta:
error.logrecords PHP errors and warnings, which is the first place to look for the cause of a broken page.kinsta-cache-perf.logrecords cache performance and shows whether pages serve from cache or bypass it.access.logrecords every HTTP request that reaches the site, which is where you trace traffic patterns and recurring 404s.
The built-in viewer loads up to 20,000 lines with a search field for filtering by any text string. Logs can also be downloaded via the File Manager within MyKinsta if you need to work with them in an external tool.
The activity log: what people did
The activity log captures every action taken in MyKinsta for a site by any user, in chronological order.
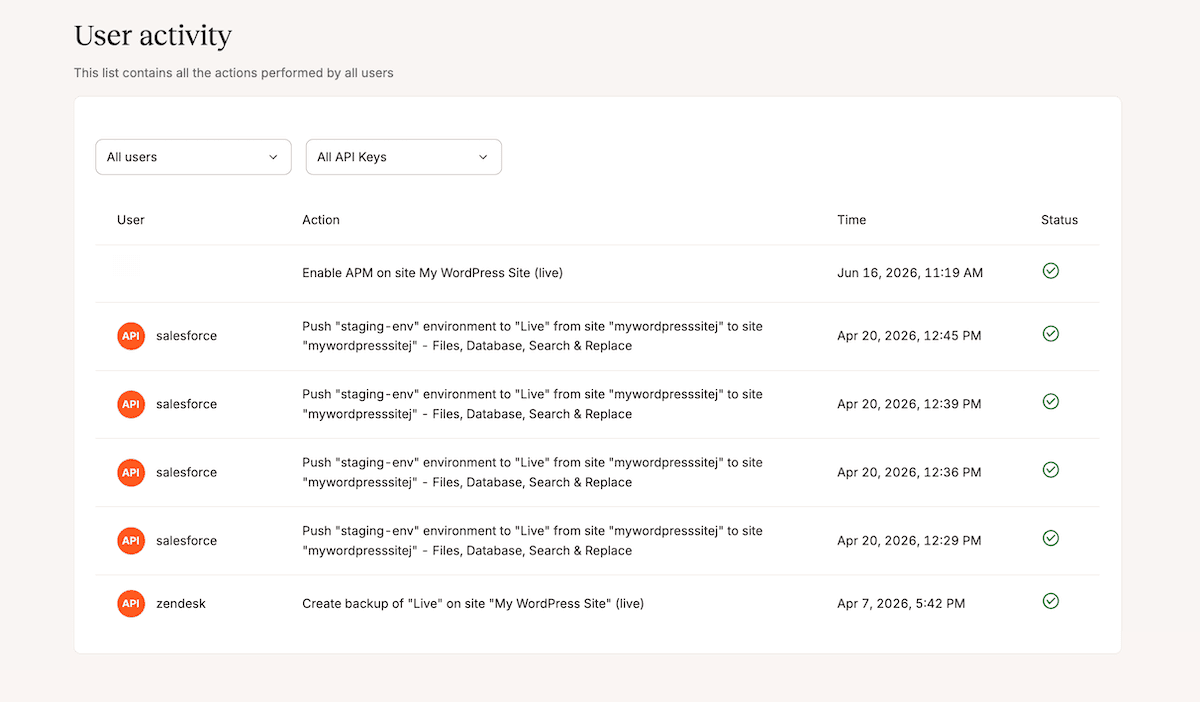
You find the activity logs under Sites > sitename > User activity. Each entry lets you see the action described in plain language, the user, a timestamp, and a status icon. Here, a green check marks success and a red exclamation marks a failure.
It helps you diagnose issues when paired with other logs. For instance, with a populated error.log file you can open the activity log, narrow it to the same window, and find any associated actions.
How uptime monitoring creates shared awareness
The tools above are reactive. Uptime monitoring makes detection proactive: instead of learning about a problem from a client complaint, you and Kinsta learn about it simultaneously.
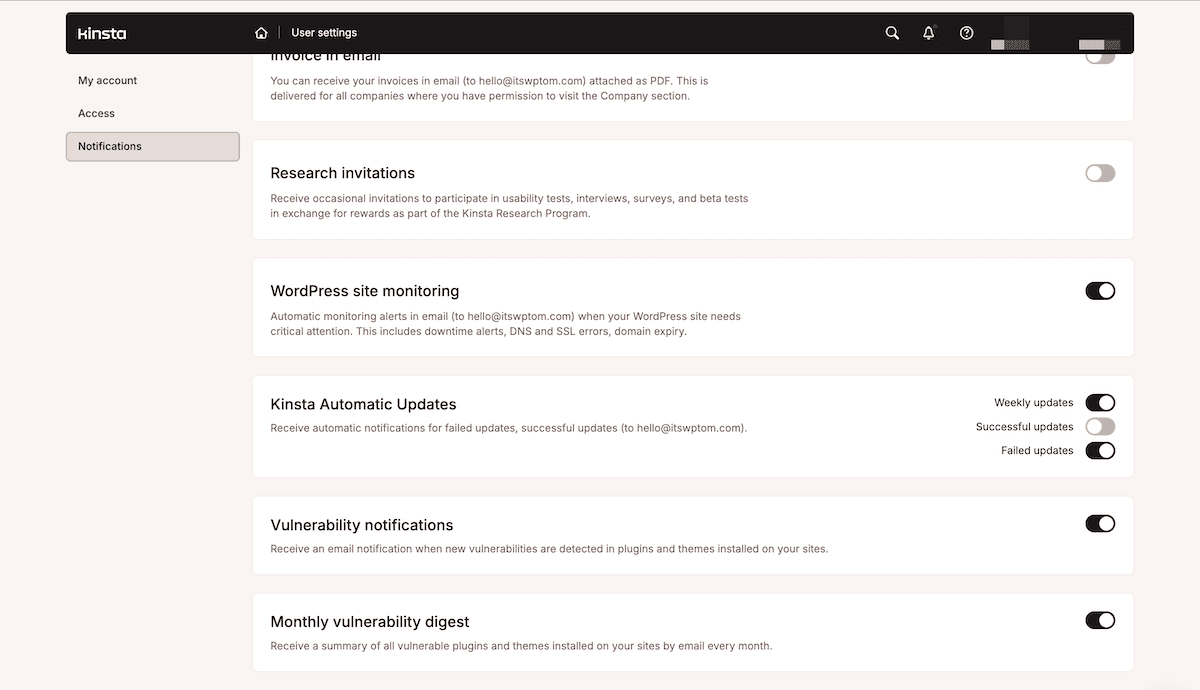
Kinsta monitors every site on the platform around 480 times a day. With monitoring notifications enabled under User Settings > Notifications, you receive an email based on areas of critical attention:
- Site Errors flag a problem detected on the site itself.
- SSL Errors flag a certificate or configuration issue before it turns visitors away.
- Domain Expiration flags an expiring domain before it lapses.
Emails trigger after three consecutive failed checks rather than the first, which filters out the momentary blips that would otherwise flood you with false alarms.
SIX15 Solutions runs more than 30 client sites on this monitoring, where the value is less the check itself than how often issues resolve before a client notices.
I am currently hosting over 30 client websites on my Agency plan, from small marketing sites to full-blown membership sites with thousands of users, with zero issues or downtime.
However, not every warning is a failure. Plan limit alerts notify you when you’re reaching the limits of your plan’s usage, which is an effective early-warning layer. This gives you a way to see why you’re hitting a limit through your analytics, such as a campaign sending more traffic than forecast or crawler or bot activity.
Shared data is what ends the blame conversation
A broken site costs the most time through figuring out responsibility and accountability rather than the fix. MyKinsta’s Analytics shows whether a site is slow, broken, or overloaded. Between the APM tool, log viewer, activity log, uptime monitoring, and more, you can make sure everyone learns of an issue and gets to work without sitting in a ticket queue.
The goal is to treat these views as a shared workflow. With every team member having the right analytics access, you can agree on the reports to work from before anyone opens a ticket. This way, the conversation stays a diagnosis instead of becoming an argument.
If you’re managing sites where multiple teams share responsibility, Kinsta’s managed WordPress hosting gives every one of those teams a seat at the diagnostic table. If you’re managing client sites at scale, the Agency Partner Program is worth exploring for the shared-access and co-management tools it brings.