
We’ll be the first to admit it, most of us at Kinsta are data junkies. We love looking at large data sets to see if we can spot a new trend, or gain any additional insights into changes that might impact the hosting industry or our business. Hosting thousands of sites allows us to have an almost unlimited source of data to continuously track and pull queries from.
Our sysadmin and development teams regularly dig into log files to see if we can improve certain aspects of our MyKinsta tools and services for clients. For example, one way we use this data is to implement better filters against bad bot traffic and crawlers. What we learn goes directly into our MyKinsta Analytics tool. Therefore, this data can actually help save you money on your hosting plan as we improve the quality and accuracy of our filtering and visits measurements.
We analyzed 13 billion (that’s right billion) log entries, and this time around we’ve decided to share all of our findings with you! We split the stats into three different sections: access logs, cache performance, and PHP engine.
The data below is compiled from thousands of WordPress sites hosted on Kinsta servers. Most of the percentages in the charts are rounded to the nearest point. None of the data shared is PII.
Access Log Stats
Out of the total 13 billion entries (rows in a log file), we analyzed 8 billion access logs.
The log entries contain what we call “requests.” This is different than visits, as our raw access logs are tracking the IP addresses that request resources from a website. For example, Google Analytics automatically filters out a lot of bad traffic, trying to show you the best estimation of real human visits to your website. Log stats include every type of request that directly hit the server, from browsers requests to bad bots and search engine crawlers.
Desktop vs Mobile vs Everything Else
We first analyzed all of the requests from desktop browsers, mobile browsers, and everything else. To do this, we looked at the HTTP header known as the user-agent. A user-agent is basically a string of text that identifies the browser and or operating system when it connects to the web server.
It will typically look something like this: user-agent: Mozilla/5.0 (Macintosh; Intel Mac OS X 10_14_3) AppleWebKit/537.36 (KHTML, like Gecko) Chrome/72.0.3626.109 Safari/537.36. You can see the user-agent in the response header in a tool like Pingdom or Chrome DevTools.
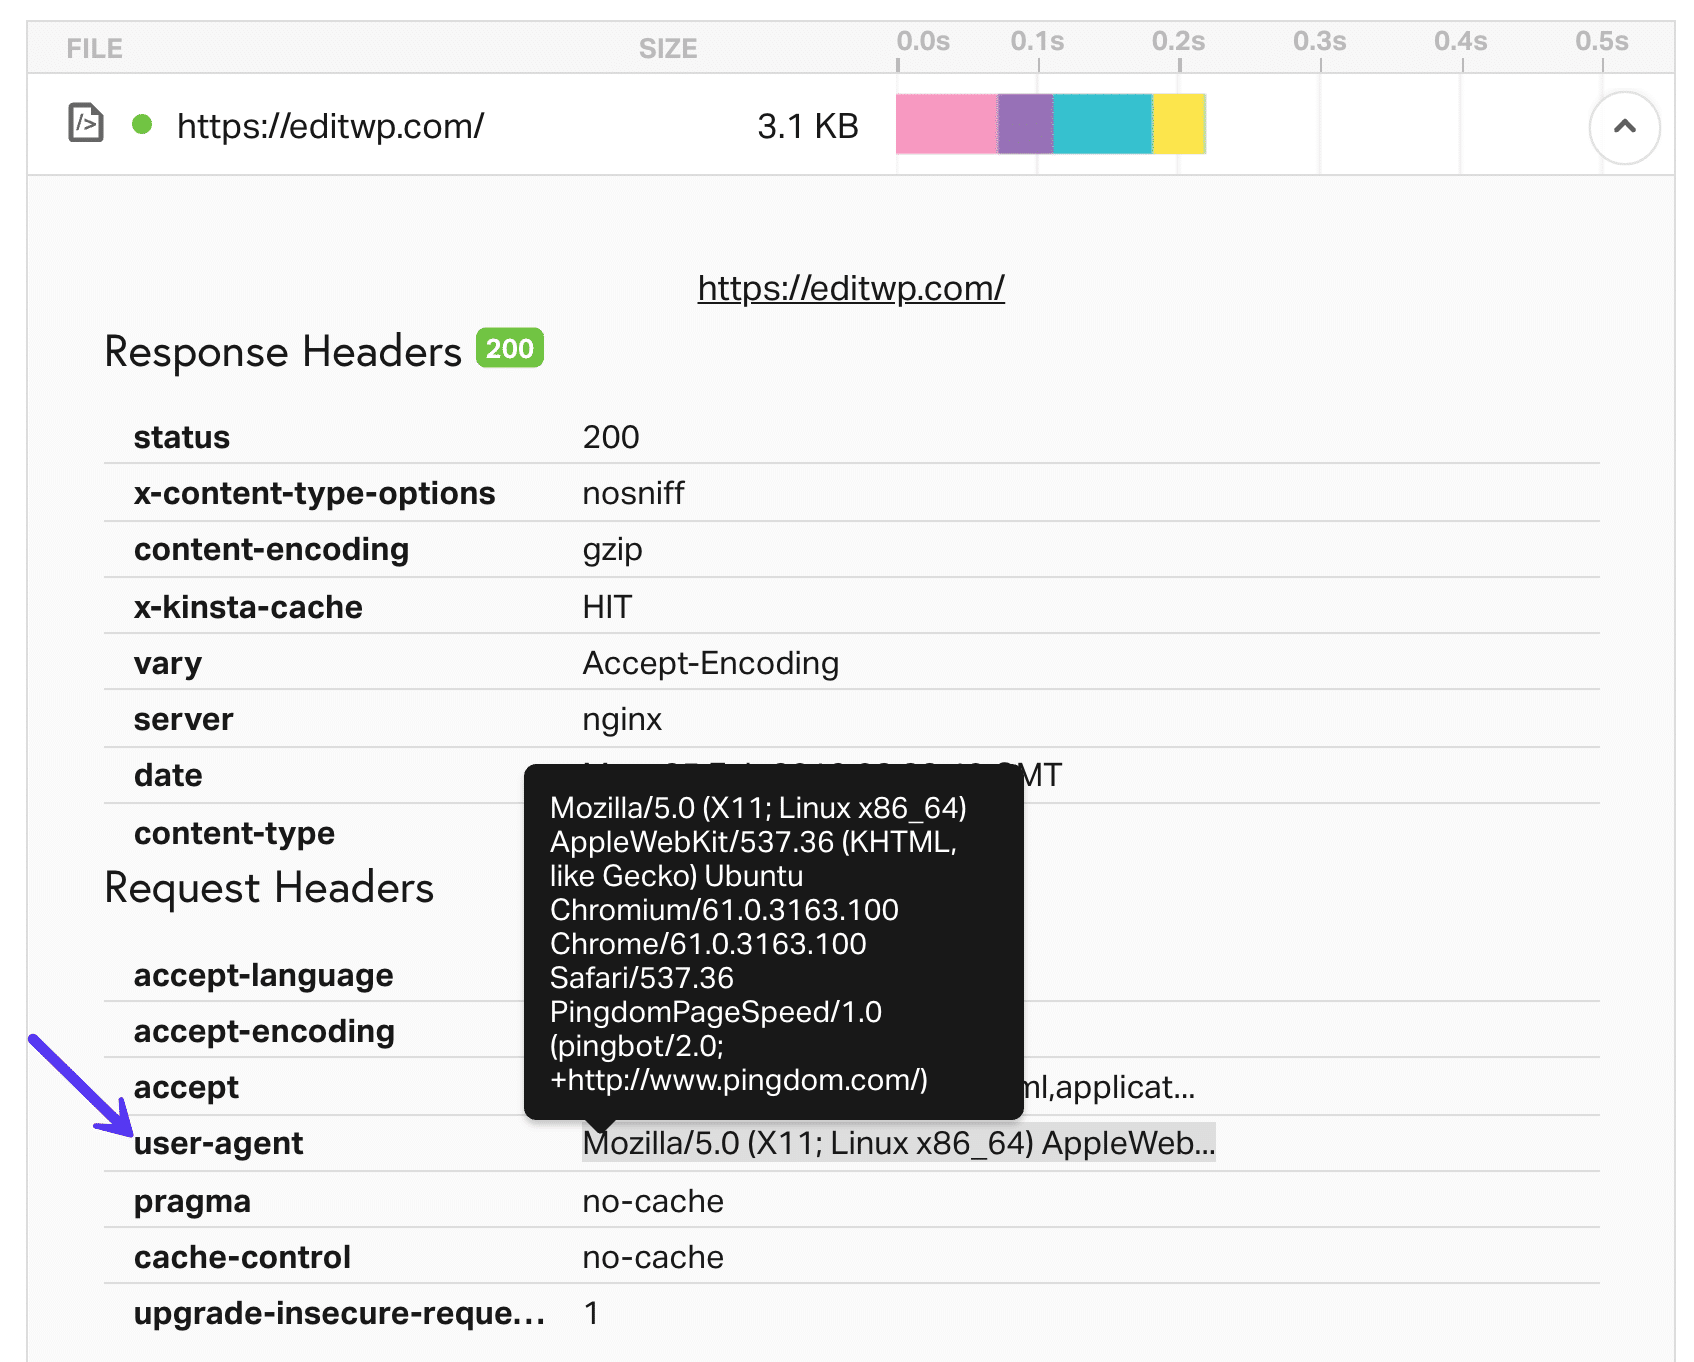
The one downfall in regards to the user-agent in log files is that it can easily be spoofed. This is one reason why you might see “Other” in some of the stats below.
Just like with Google Analytics, where you probably aren’t seeing all of your data due to ad blockers and GDPR cookies (some have reported not being able to see upwards of 60%!), you simply have to use the data you can see and make strategic decisions based off of it.
In our logs, we saw the following number of requests:
- 3,395,000,000 requests from desktop browsers
- 3,100,000,000 requests from mobile browsers
- 1,505,000,000 requests from everything else (API calls, search engines, crawlers, bots, uptime bots, etc. It’s important to note that for Kinsta clients, these types of requests are excluded from billable visits. We exclude any type of bot where we can identify it has “bot” in its name. Or if we identify something trying to brute force “wp-login.php,” we ban it from our infrastructure.)
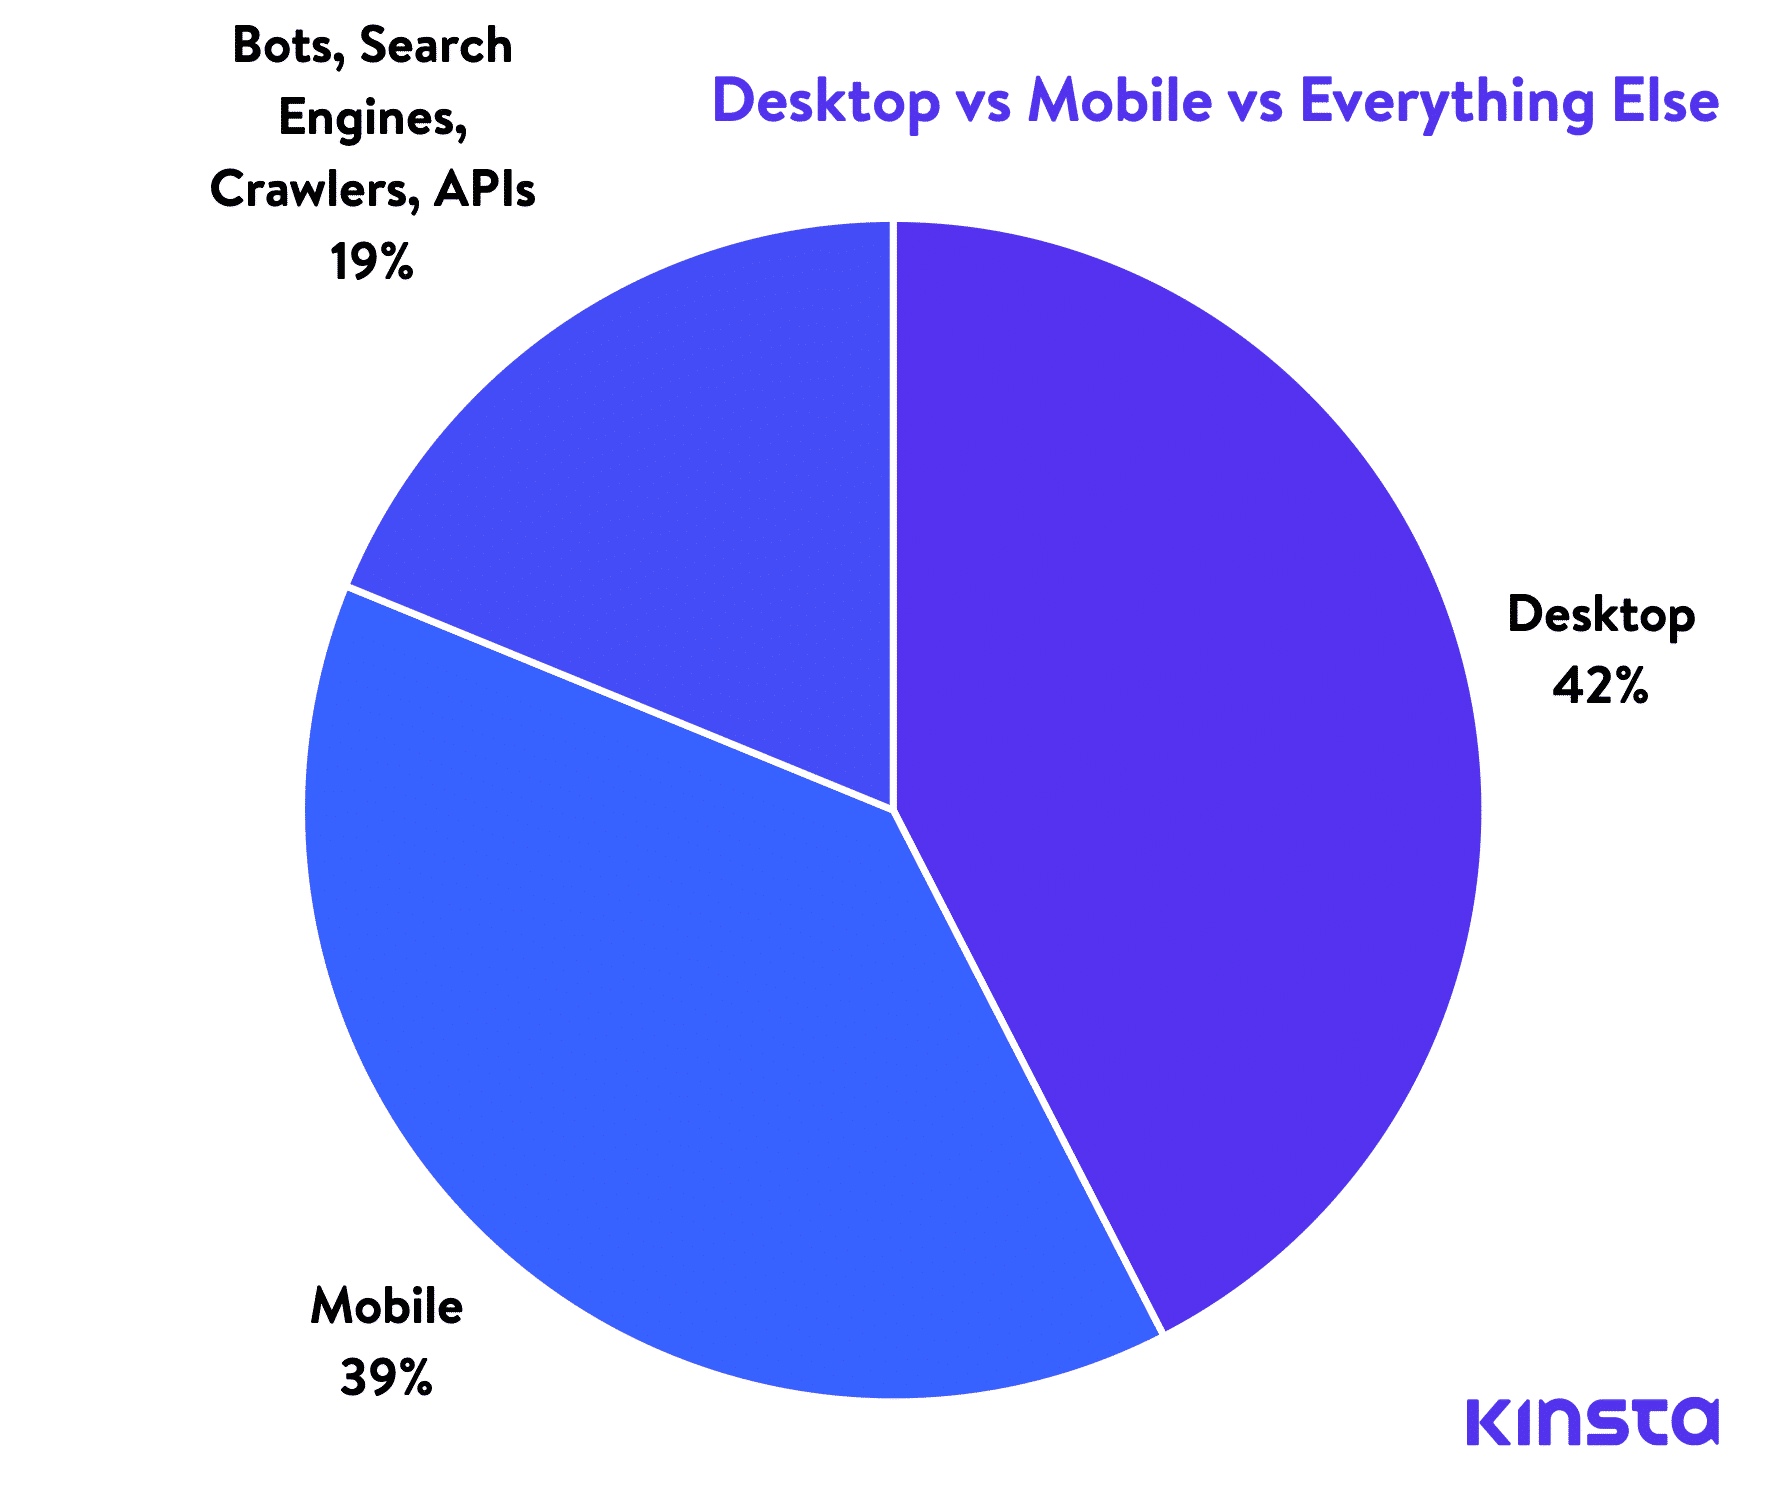
It’s interesting to see that desktop is still number one in terms of the most requests to sites hosted at Kinsta. While mobile is growing fast, it still definitely varies based on the industry you’re in.
For example, over 80% of visits to our Kinsta site is from desktops. Our site is fully responsive and fast on mobile, but when it comes to looking for application, database, and managed WordPress hosting, people don’t want to do it on their phones. Hosting is one of those commitments most people prefer to still sit at their desktops.
So by all means, you can hop on the mobile bandwagon, but don’t forget to consider how your customers actually purchase your product.
Desktop 🖥️
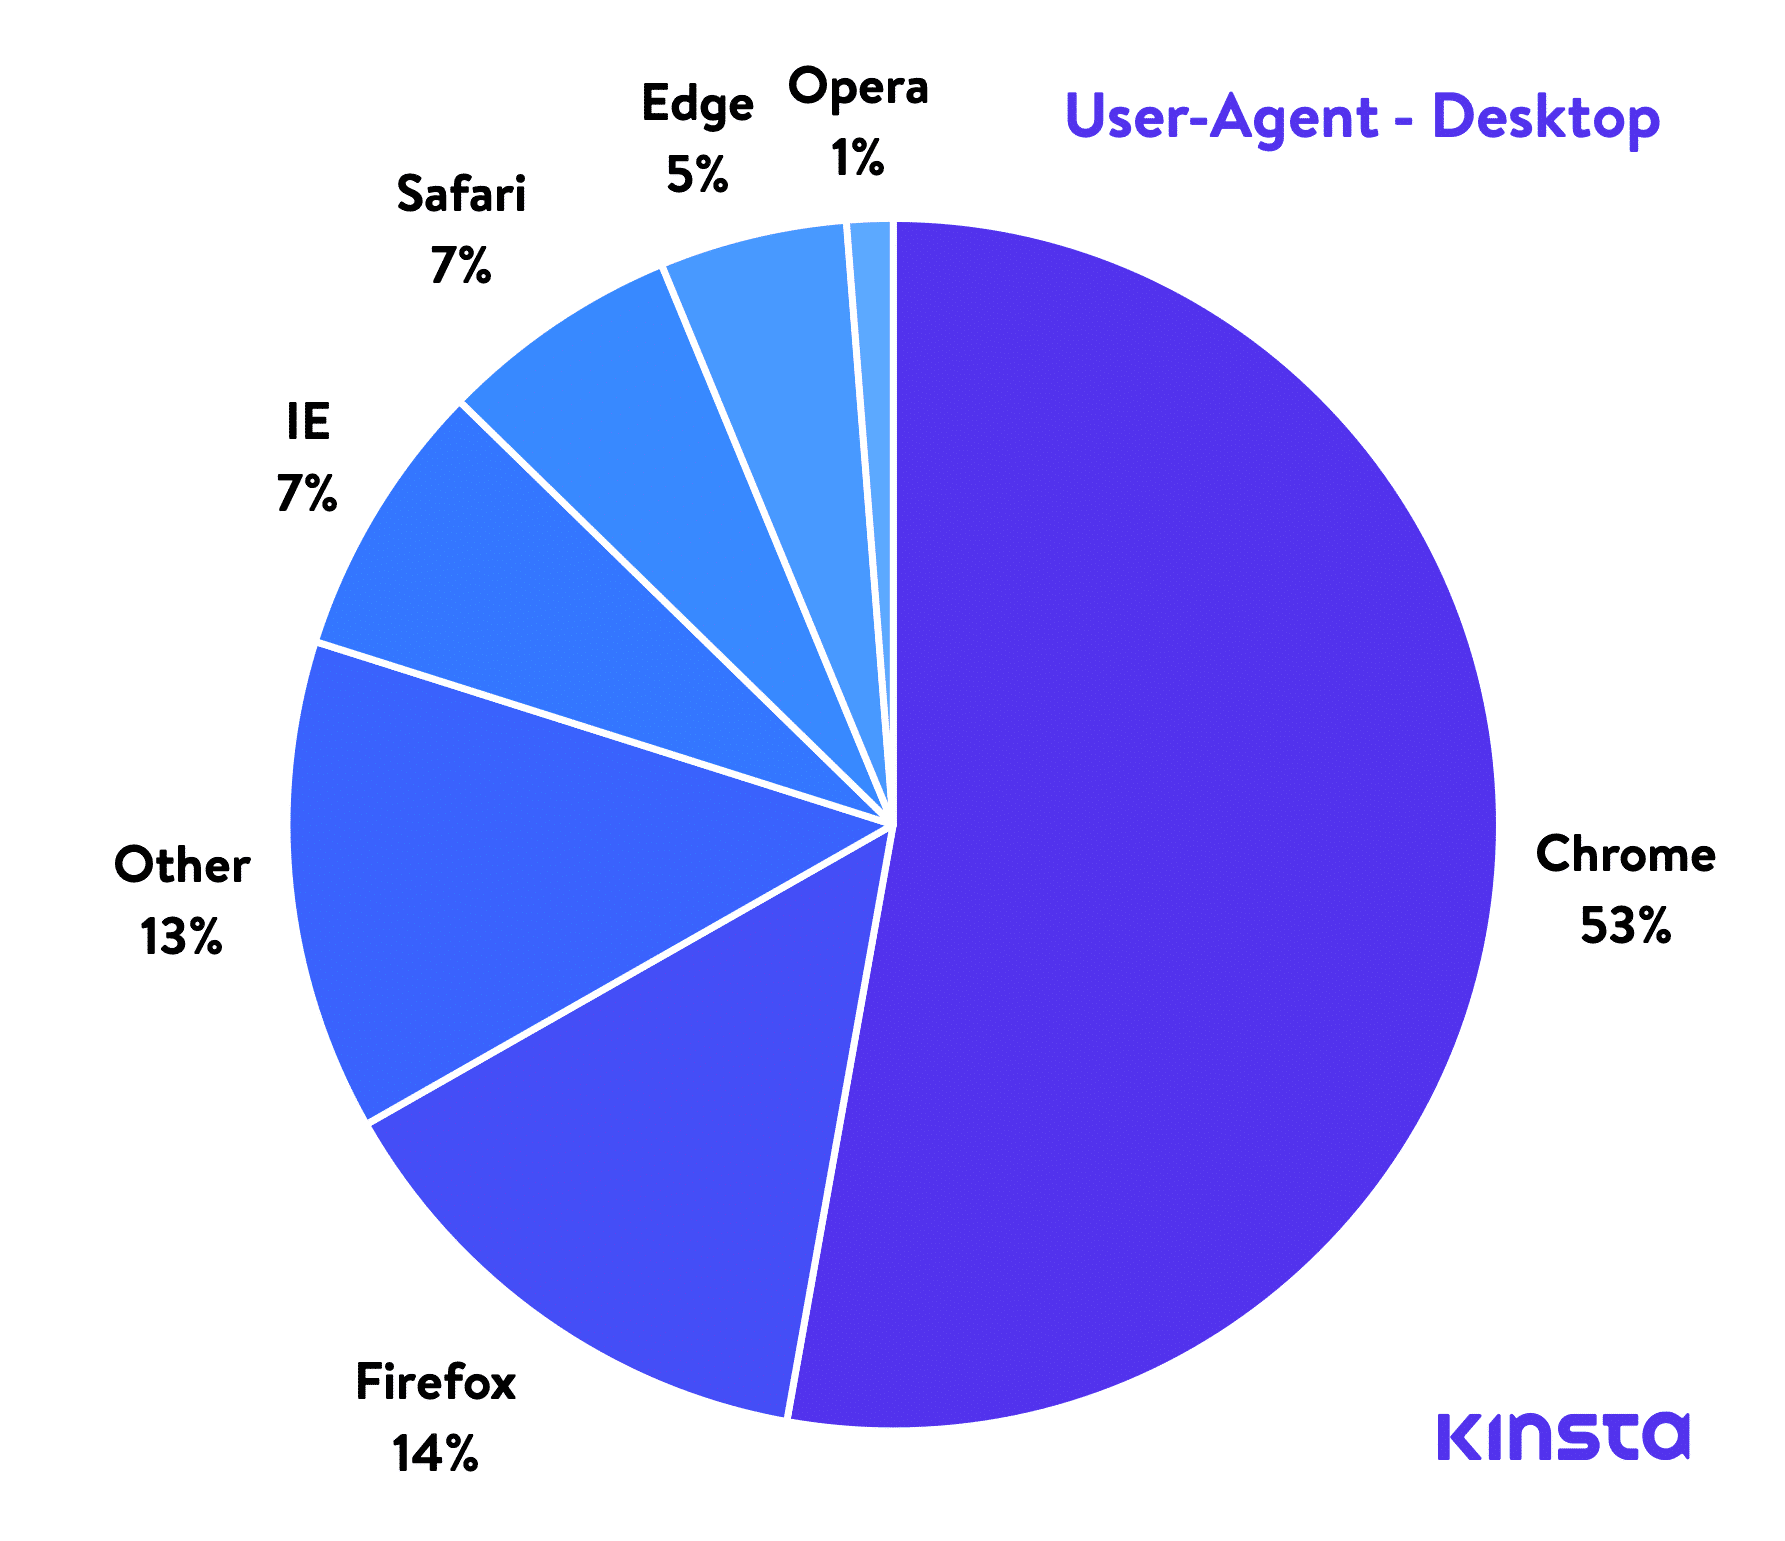
Next, we looked at the 3.3+ billion requests from the user-agent based on the type of desktop browser.
- 1,790,430,230 requests from Chrome
- 473,229,236 requests from Firefox
- 444,729,025 requests from Other
- 251,692,300 requests from IE
- 218,604,777 requests from Safari
- 169,840,696 requests from Edge
- 41,819,852 requests from Opera
You can see that Chrome was leading the pack at 53% of all requests. This wasn’t a big surprise as other sources, such as statcounter, NetMarketshare both show Chrome having over 60% of the market share. A more recent study carried out in October 2020 showed further adoption of Chrome, with a 73% browser market share.
Firefox, of course, came in second. But the one that really surprised us was Microsoft Edge at 5%. At least among sites hosted at Kinsta, Microsoft Edge seems to be slowly gaining more market share. Microsoft also announced in December 2018 that it’s rebuilding its Edge browser on Chrome and bringing it to Mac.
Mobile 📱
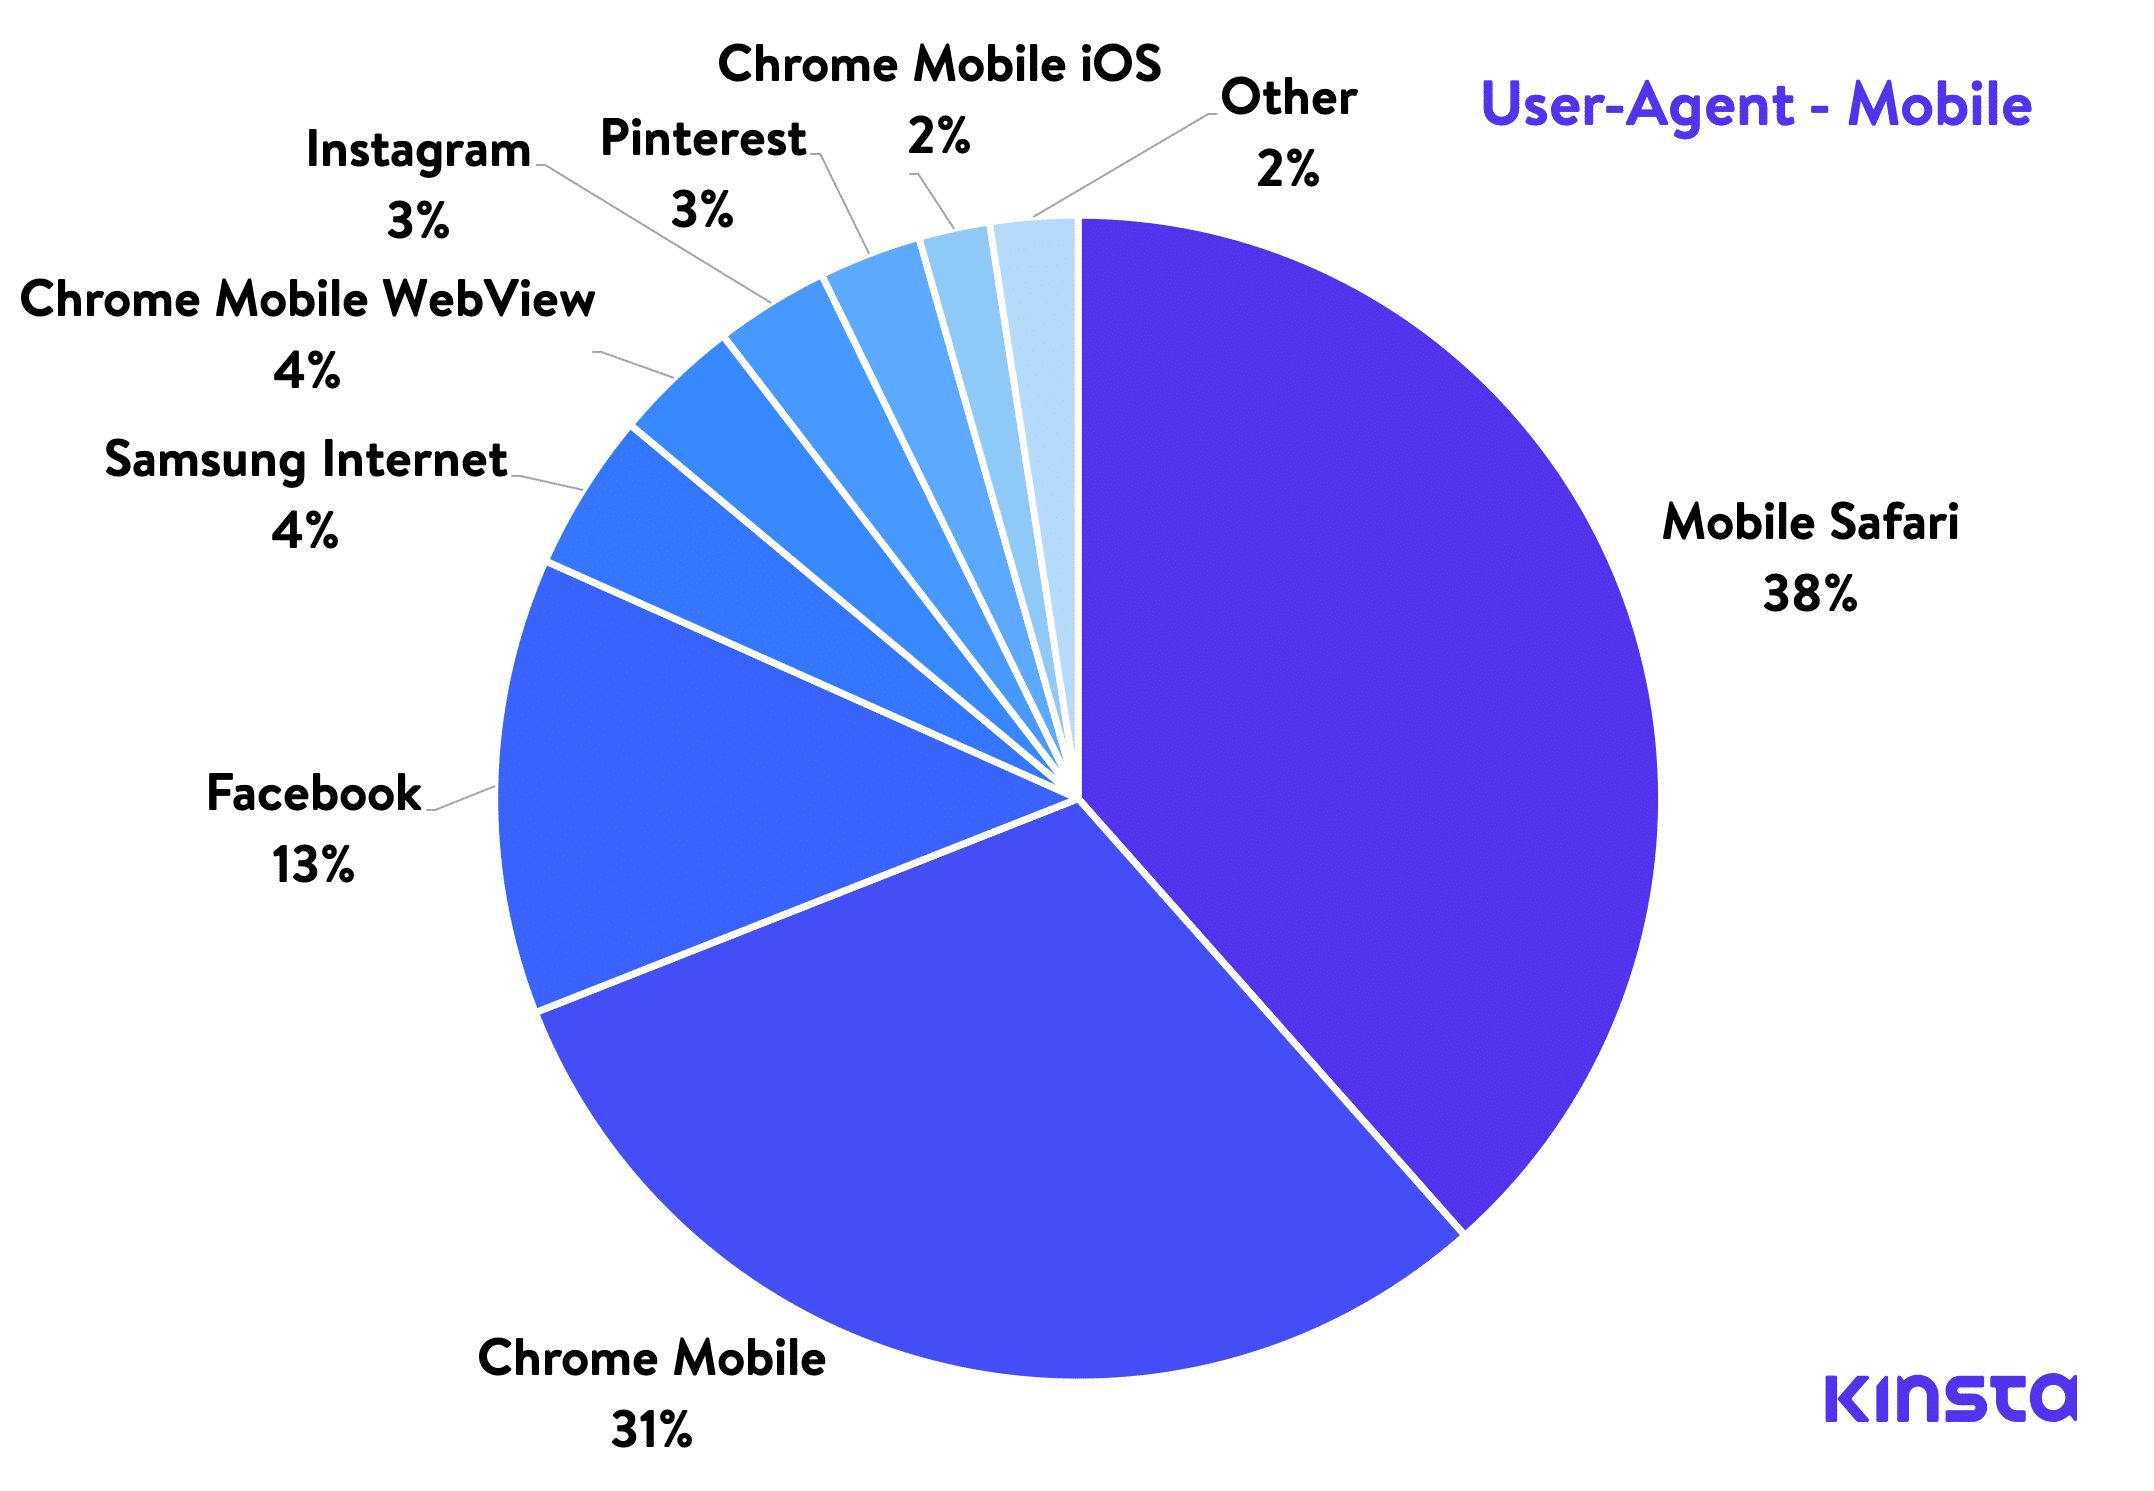
We then looked at the 3.1+ billion requests from the user-agent based on the type of mobile browser.
- 1,190,404,881 requests from Mobile Safari
- 945,589,763 requests from Chrome Mobile
- 391,674,959 requests from Facebook
- 135,877,704 requests from Samsung Internet
- 108,858,301 requests from Chrome Mobile WebView
- 97,946,458 requests from Instagram
- 87,992,534 requests from Pinterest
- 61,027,970 requests from Chrome Mobile iOS
- 75,186,662 requests from Other
This one actually surprised us. For WordPress sites hosted at Kinsta, the mobile version of Safari is used the most with over 1 billion requests. While Chrome is a close second, it’s still not very often that you see Safari dominating the pack. This simply means a lot of people are browsing Kinsta hosted sites on their iPhones.
Operating System
Next up, we analyzed all of the requests from different operating systems: desktops vs mobile.
Desktop 🖥️
We looked at the 3.3+ billion requests from the user-agent based on the type of desktop operating system.
- 2,143,021,069 requests from Windows
- 634,841,151 requests from Mac OS X
- 363,719,866 requests from Other
- 175,998,693 requests from Linux
- 37,769,563 requests from Chrome OS
- 34,683,021 requests from Ubuntu
- 2,865,221 requests from Windows 98
- 2,101,416 from Fedora
Windows is the most used operating system amongst visitors browsing sites hosted at Kinsta (with over 2 billion requests). And not surprising, Mac OS X came in second.
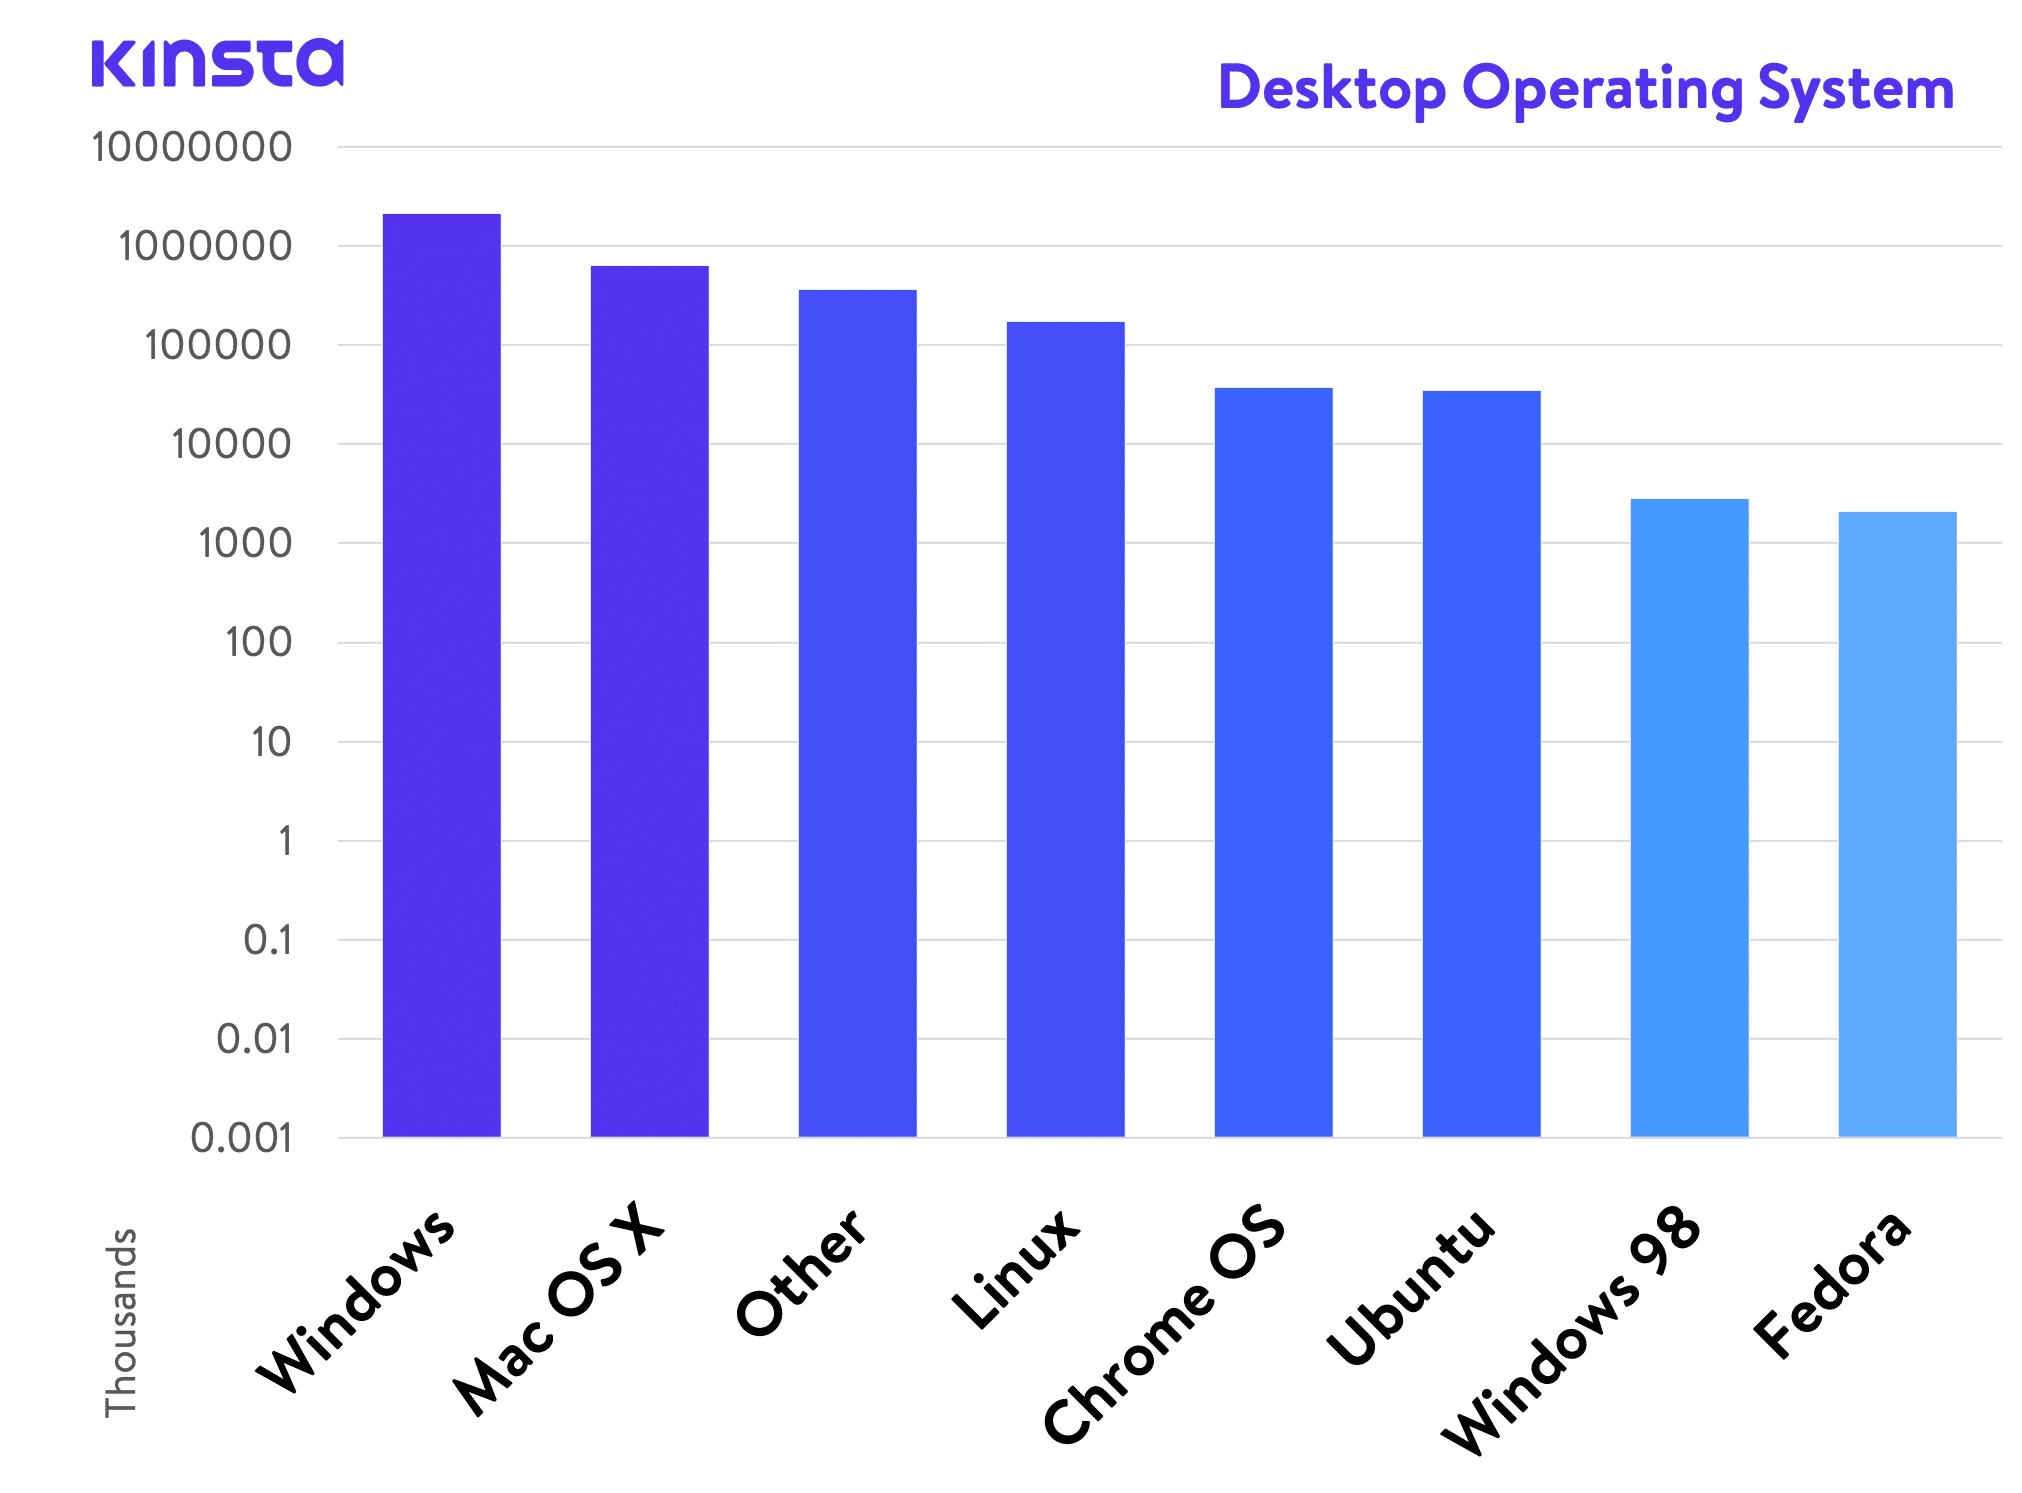
The odd one is that we are still seeing some requests from Windows 98. 😳 Remember though, you have to take the user-agent data with a grain of salt as it can be spoofed. But it’s also an important reminder that many developing countries and corporations are still running on older operating systems. Not everyone has a brand spanking new MacBook Pro.
Mobile 📱
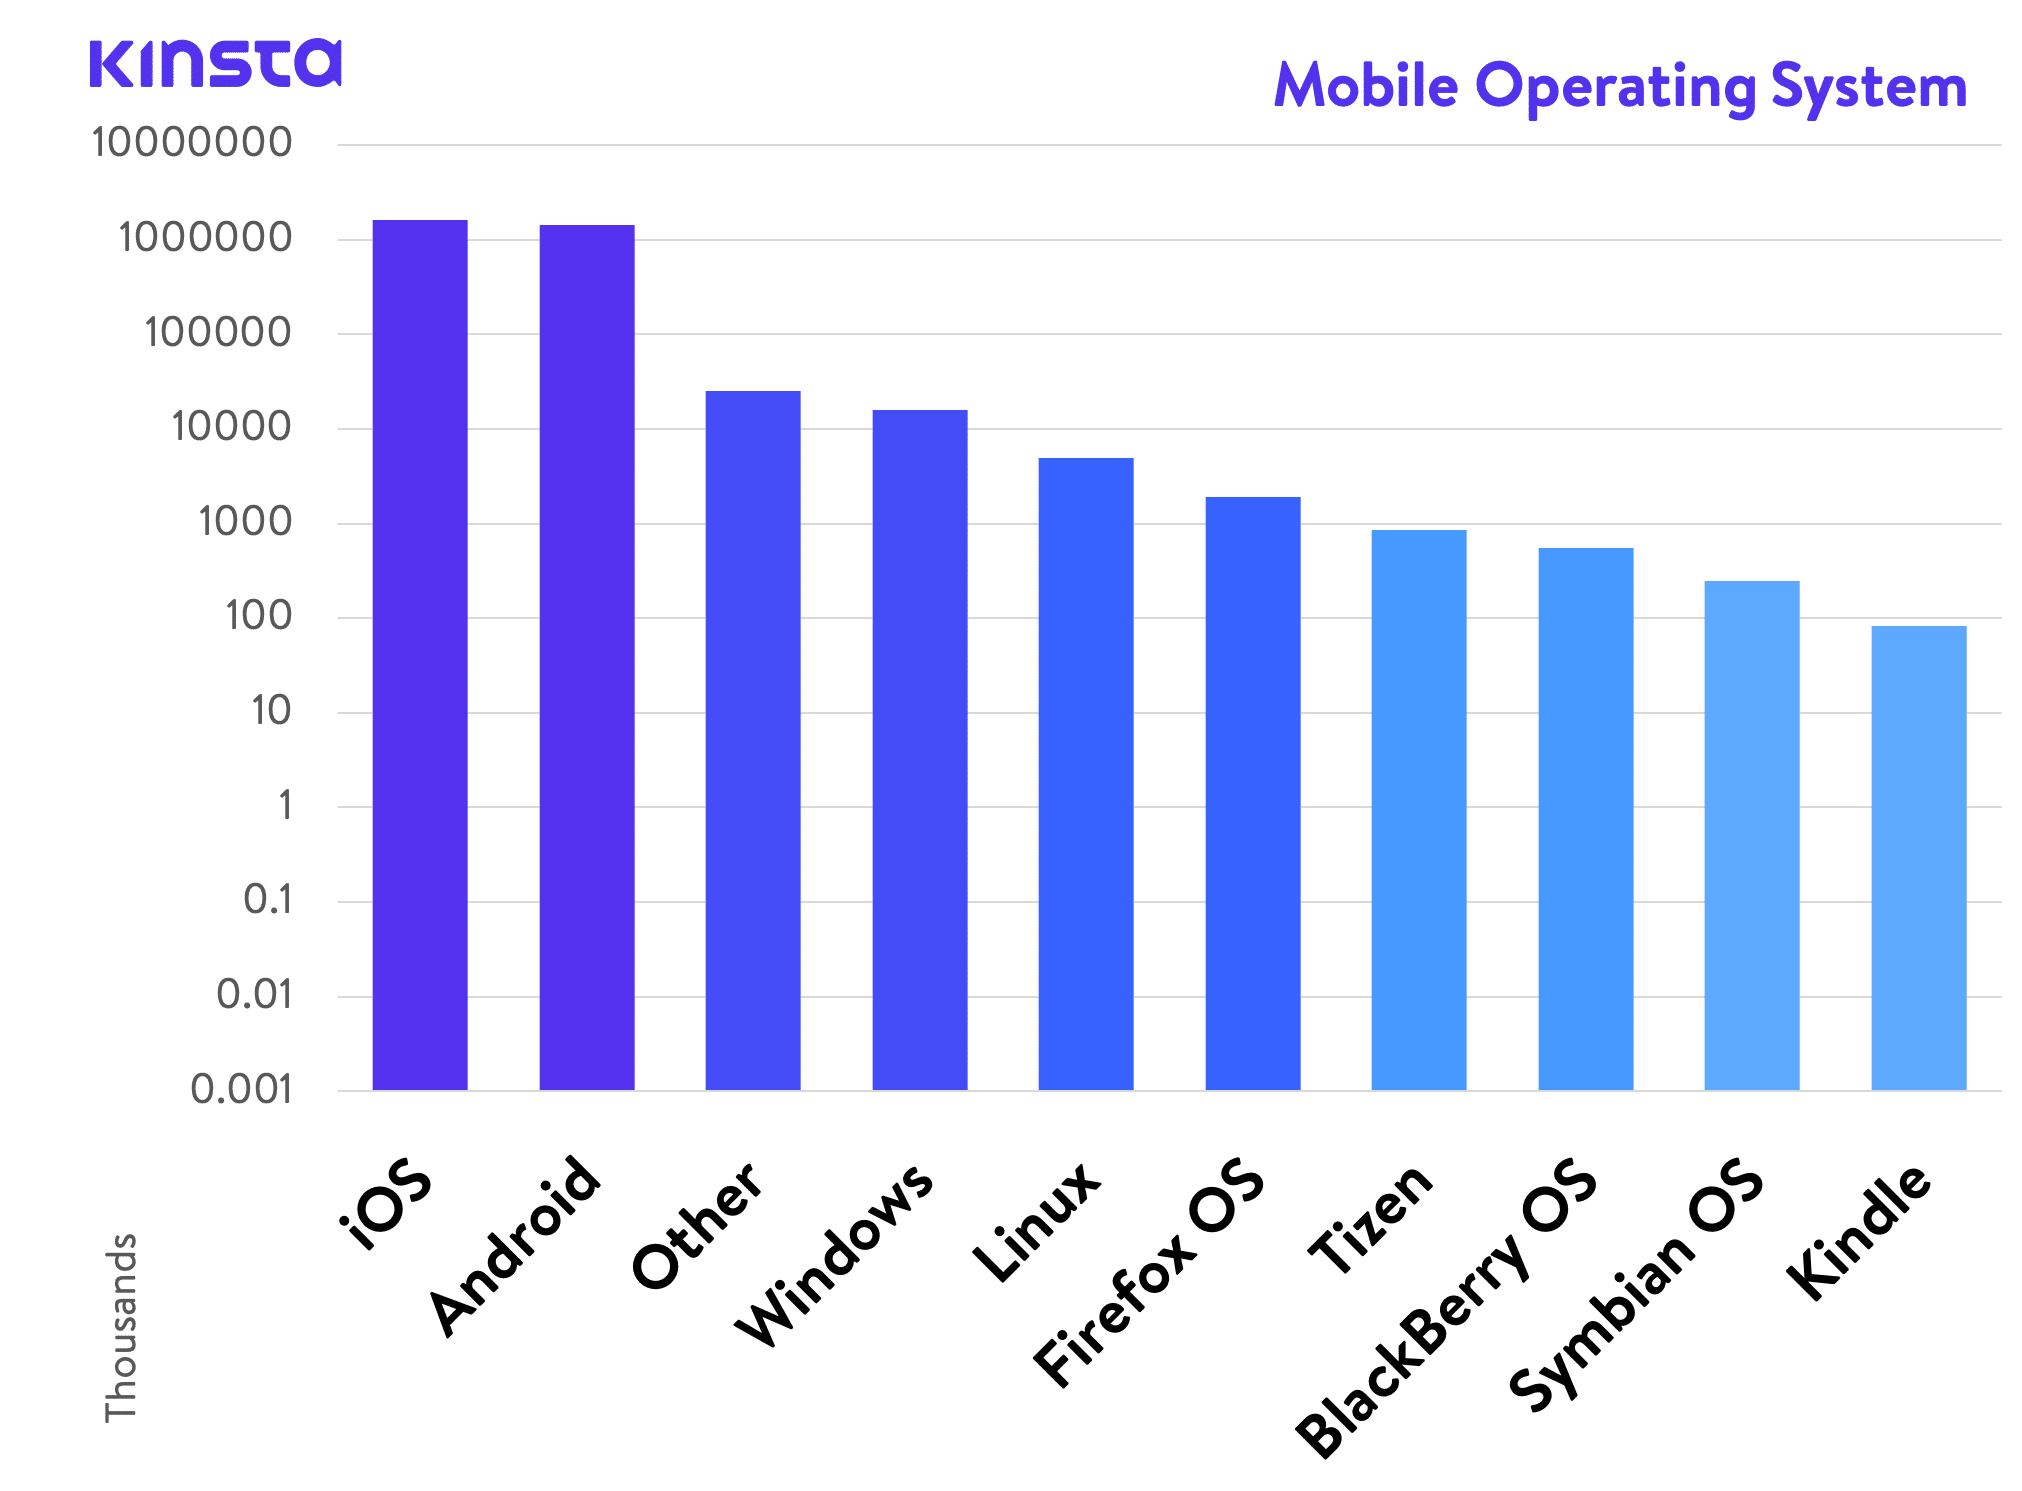
Next, we looked at the 3.1+ billion requests from the user-agent based on the type of mobile operating system.
- 1,610,093,701 requests from iOS
- 1,440,006,814 requests from Android
- 25,356,278 requests from Other
- 15,936,471 requests from Windows
- 4,982,630 requests from Linux
- 1,887,653 requests from Firefox OS
- 851,237 requests from Tizen
- 552,422 requests from BlackBerry OS
- 250,183 requests from Symbian OS
- 82,611 requests from Kindle
While Windows is winning the desktop OS war, iOS is the most used mobile OS hitting Kinsta hosted sites. With Android coming in at a close second. People do love their iPhones. 😉
HTTP vs HTTPS 🔒
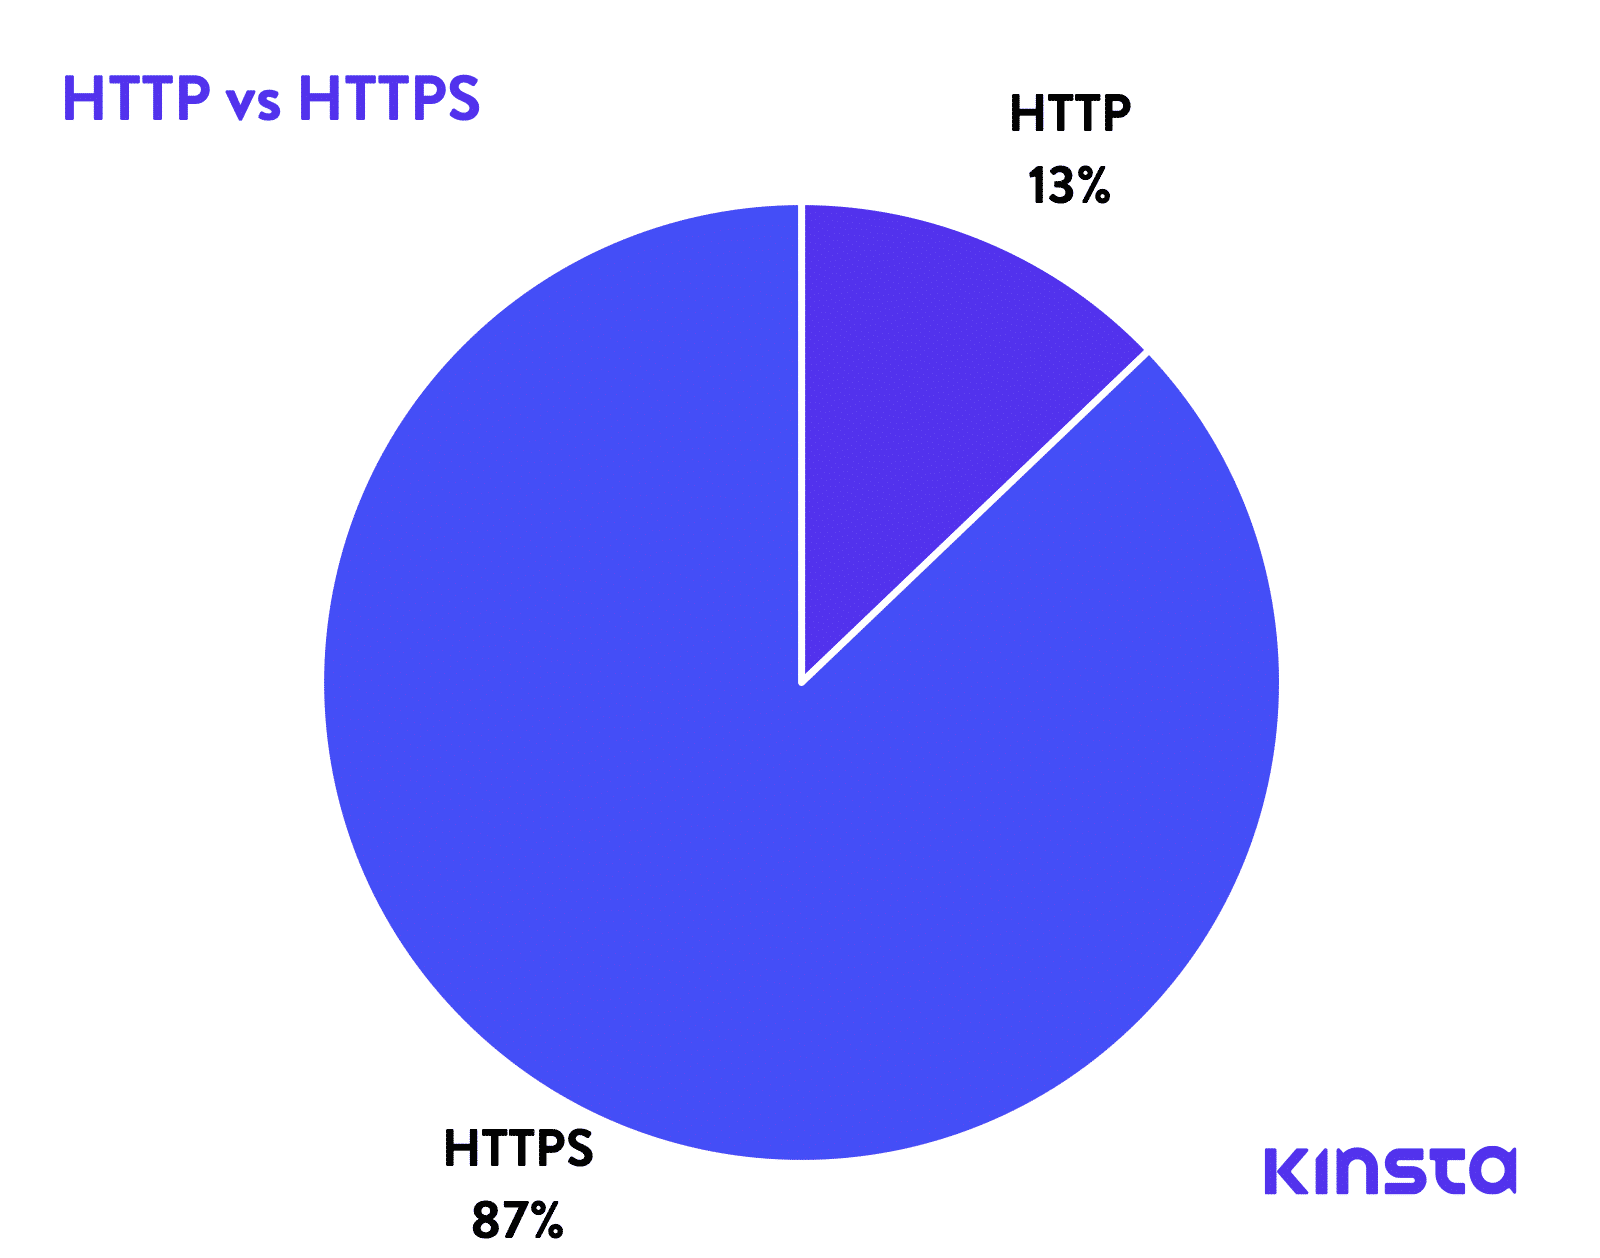
We then looked to see how many websites were serving requests over HTTP vs HTTPS.
- 835,157,594 requests from HTTP
- 5,659,842,406 requests from HTTPS
As you can see, 87% of all requests from sites hosted at Kinsta are running over HTTPS. According to W3Techs, only 48.2% of all websites are using the HTTPS protocol. We are glad to see that the ratio at Kinsta is much higher than the average! 👏 This, of course, is partially thanks to Let’s Encrypt, as SSL certificates are now free. Kinsta clients can install SSL certificates with a few simple clicks (here’s how to install an SSL certificate on WooCommerce)!
www vs non-www
We were curious to see how many sites were running www vs non-www, so we looked at the data.
- 2,764,257,683 requests from www
- 3,730,742,317 requests from non-www
As you can see, 57% of sites at Kinsta are running non-www.
Using www as part of your domain used to be the standard back in the day. But that is not necessarily true anymore. Even we don’t use www here at Kinsta. One reason you still might see www being used a lot is simply that changing it after using it for years can be complex and cause issues. So a lot of older brands simply continue to use it.
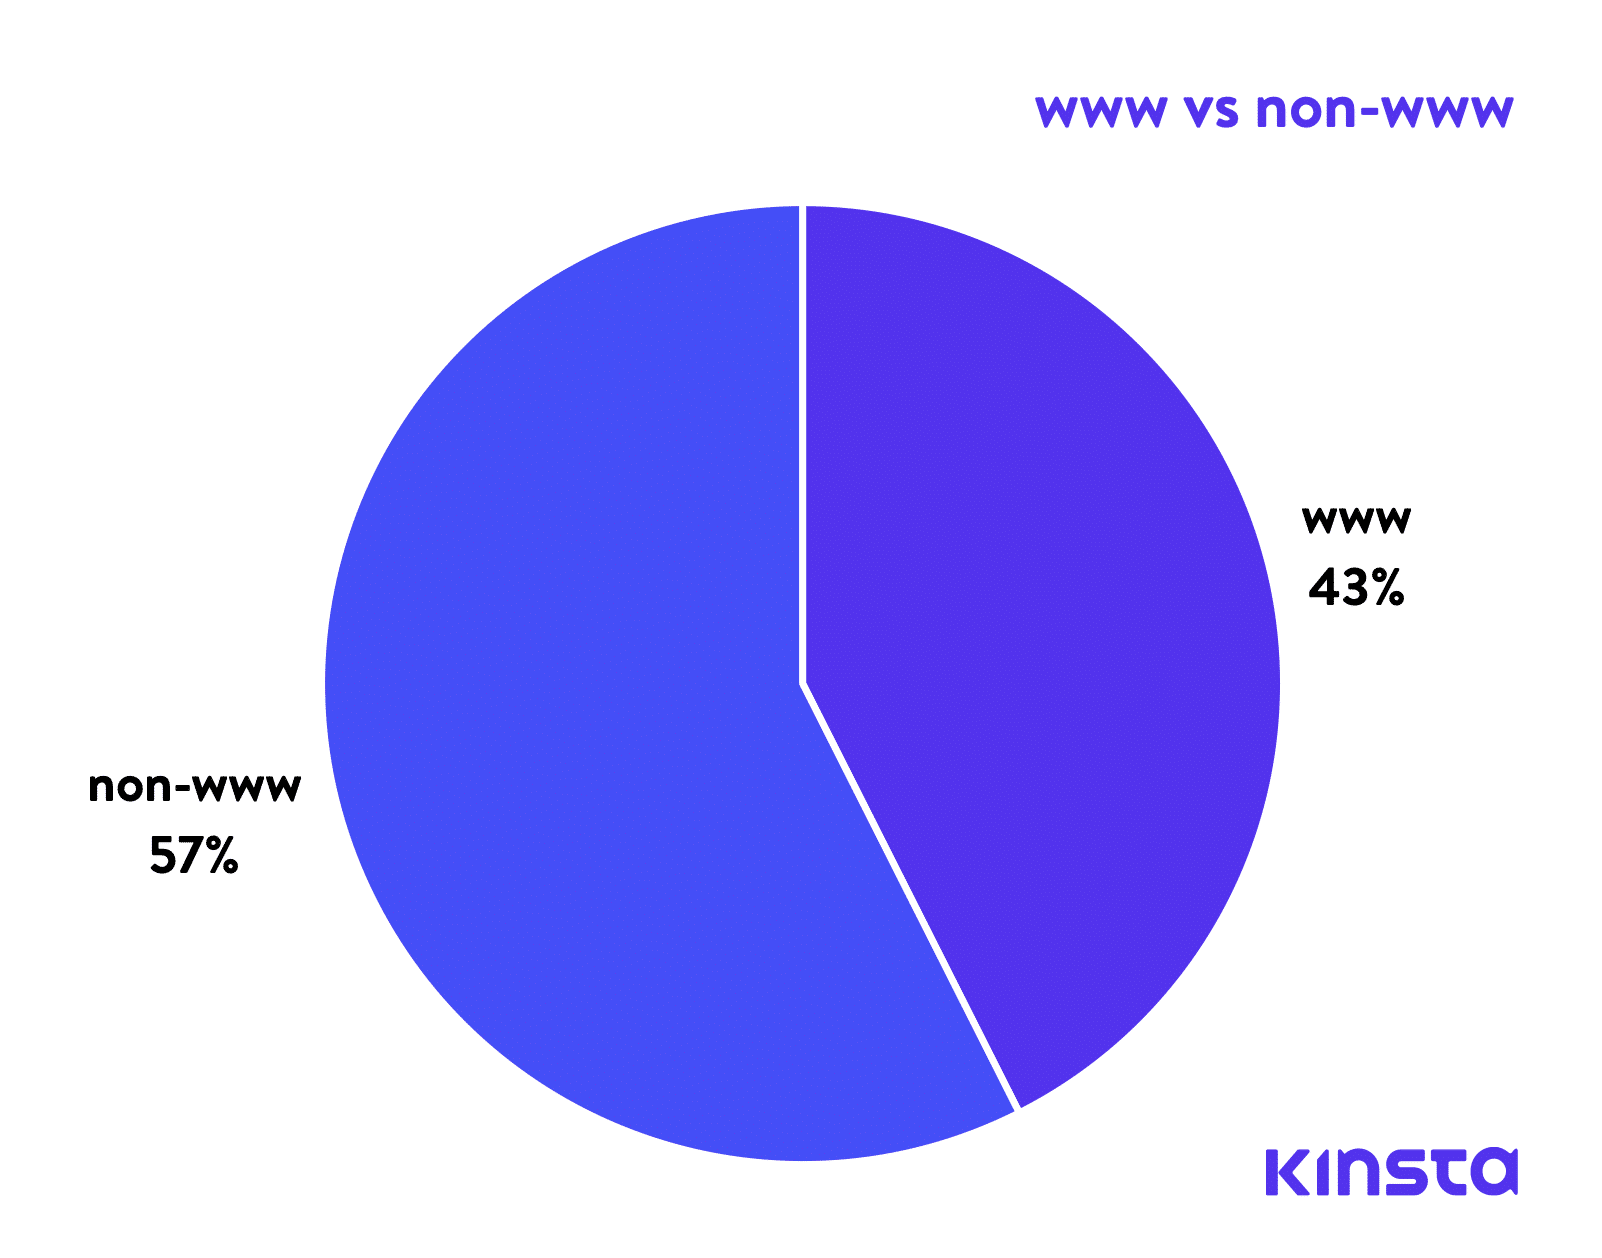
Another reason large companies with a lot of traffic might want to use www is due to DNS. Naked domains (non-www) technically can’t have a CNAME record used in order to redirect traffic for failover. However, there are workarounds to this issue.
So when it comes down to www vs non-www it is more a matter of personal preference. Perhaps you prefer shorter URLs in which case you could go with the non-www. Remember, no matter which version you choose you can set up redirects so that each is accessible. For example, if you visit www.kinsta.com, it simply redirects to kinsta.com.
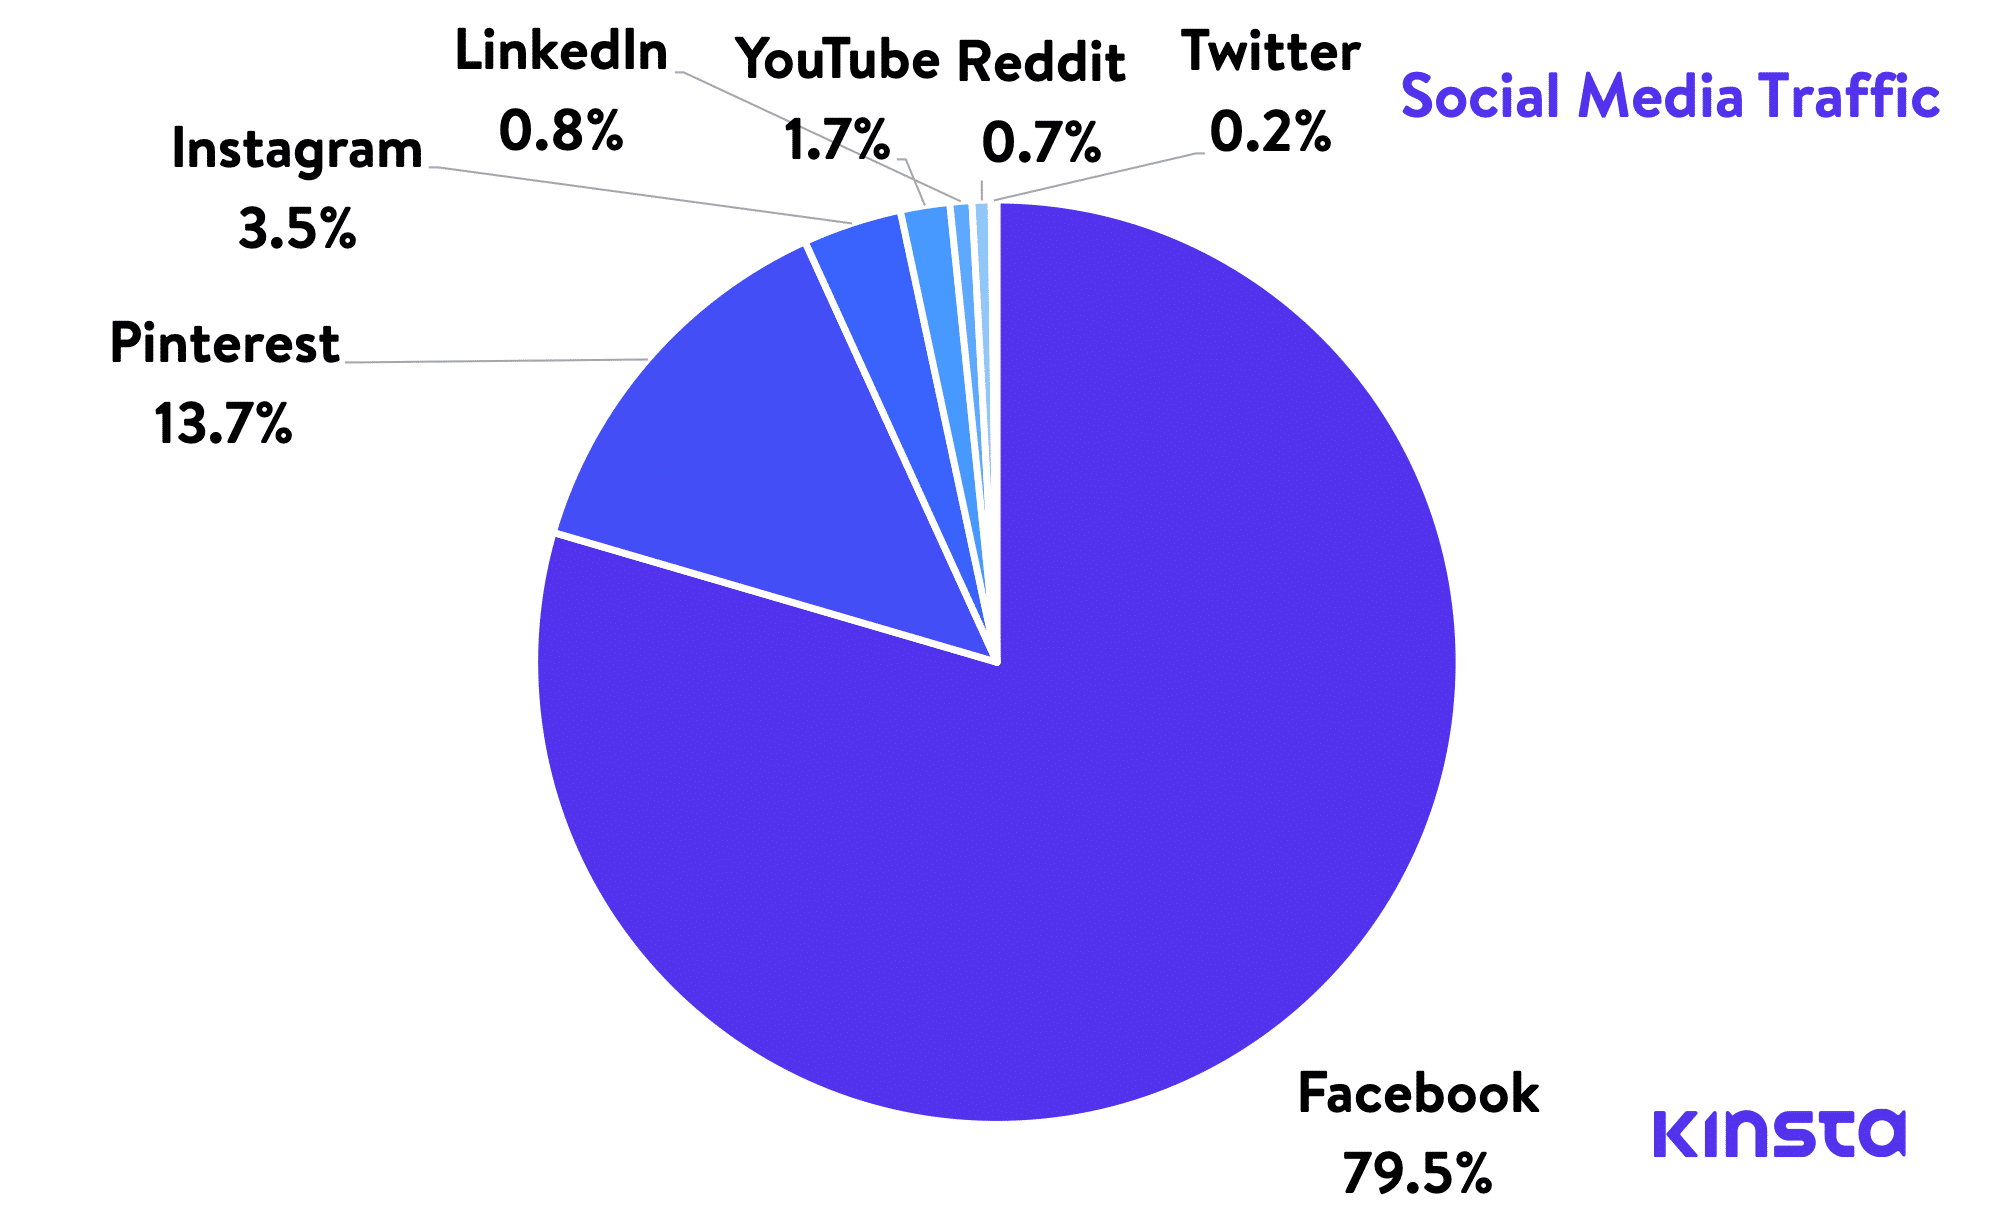
Social Media Traffic
We then looked to see which social media networks were sending the most traffic. Note: This is only the top 7.
- 45,358,077 requests from Facebook
- 7,789,013 requests from Pinterest
- 1,971,578 requests from Instagram
- 986,708 requests from YouTube
- 434,462 requests from LinkedIn
- 379,516 requests from Reddit
- 113,885 requests from Twitter
As you can see, Facebook pretty much dominated the social media game with it sending 79.5% of the requests. Pinterest came in second with 13.7%. If you haven’t tried Pinterest yet and have a business that might work well on there, it’s something to definitely check out.
Response Codes
HTTP status codes, also known as response codes, are like a short note from the web server that gets tacked onto the top of a web page. It’s not actually part of the web page. Instead, it’s a message from the server letting you know how things went when the request to view the page was received by the server.
If you’re a Kinsta client, you can view all sorts of charts and data in MyKinsta Analytics pertaining to response codes for your sites.
We were curious to see which response codes were returning the most of, so we looked at the data.
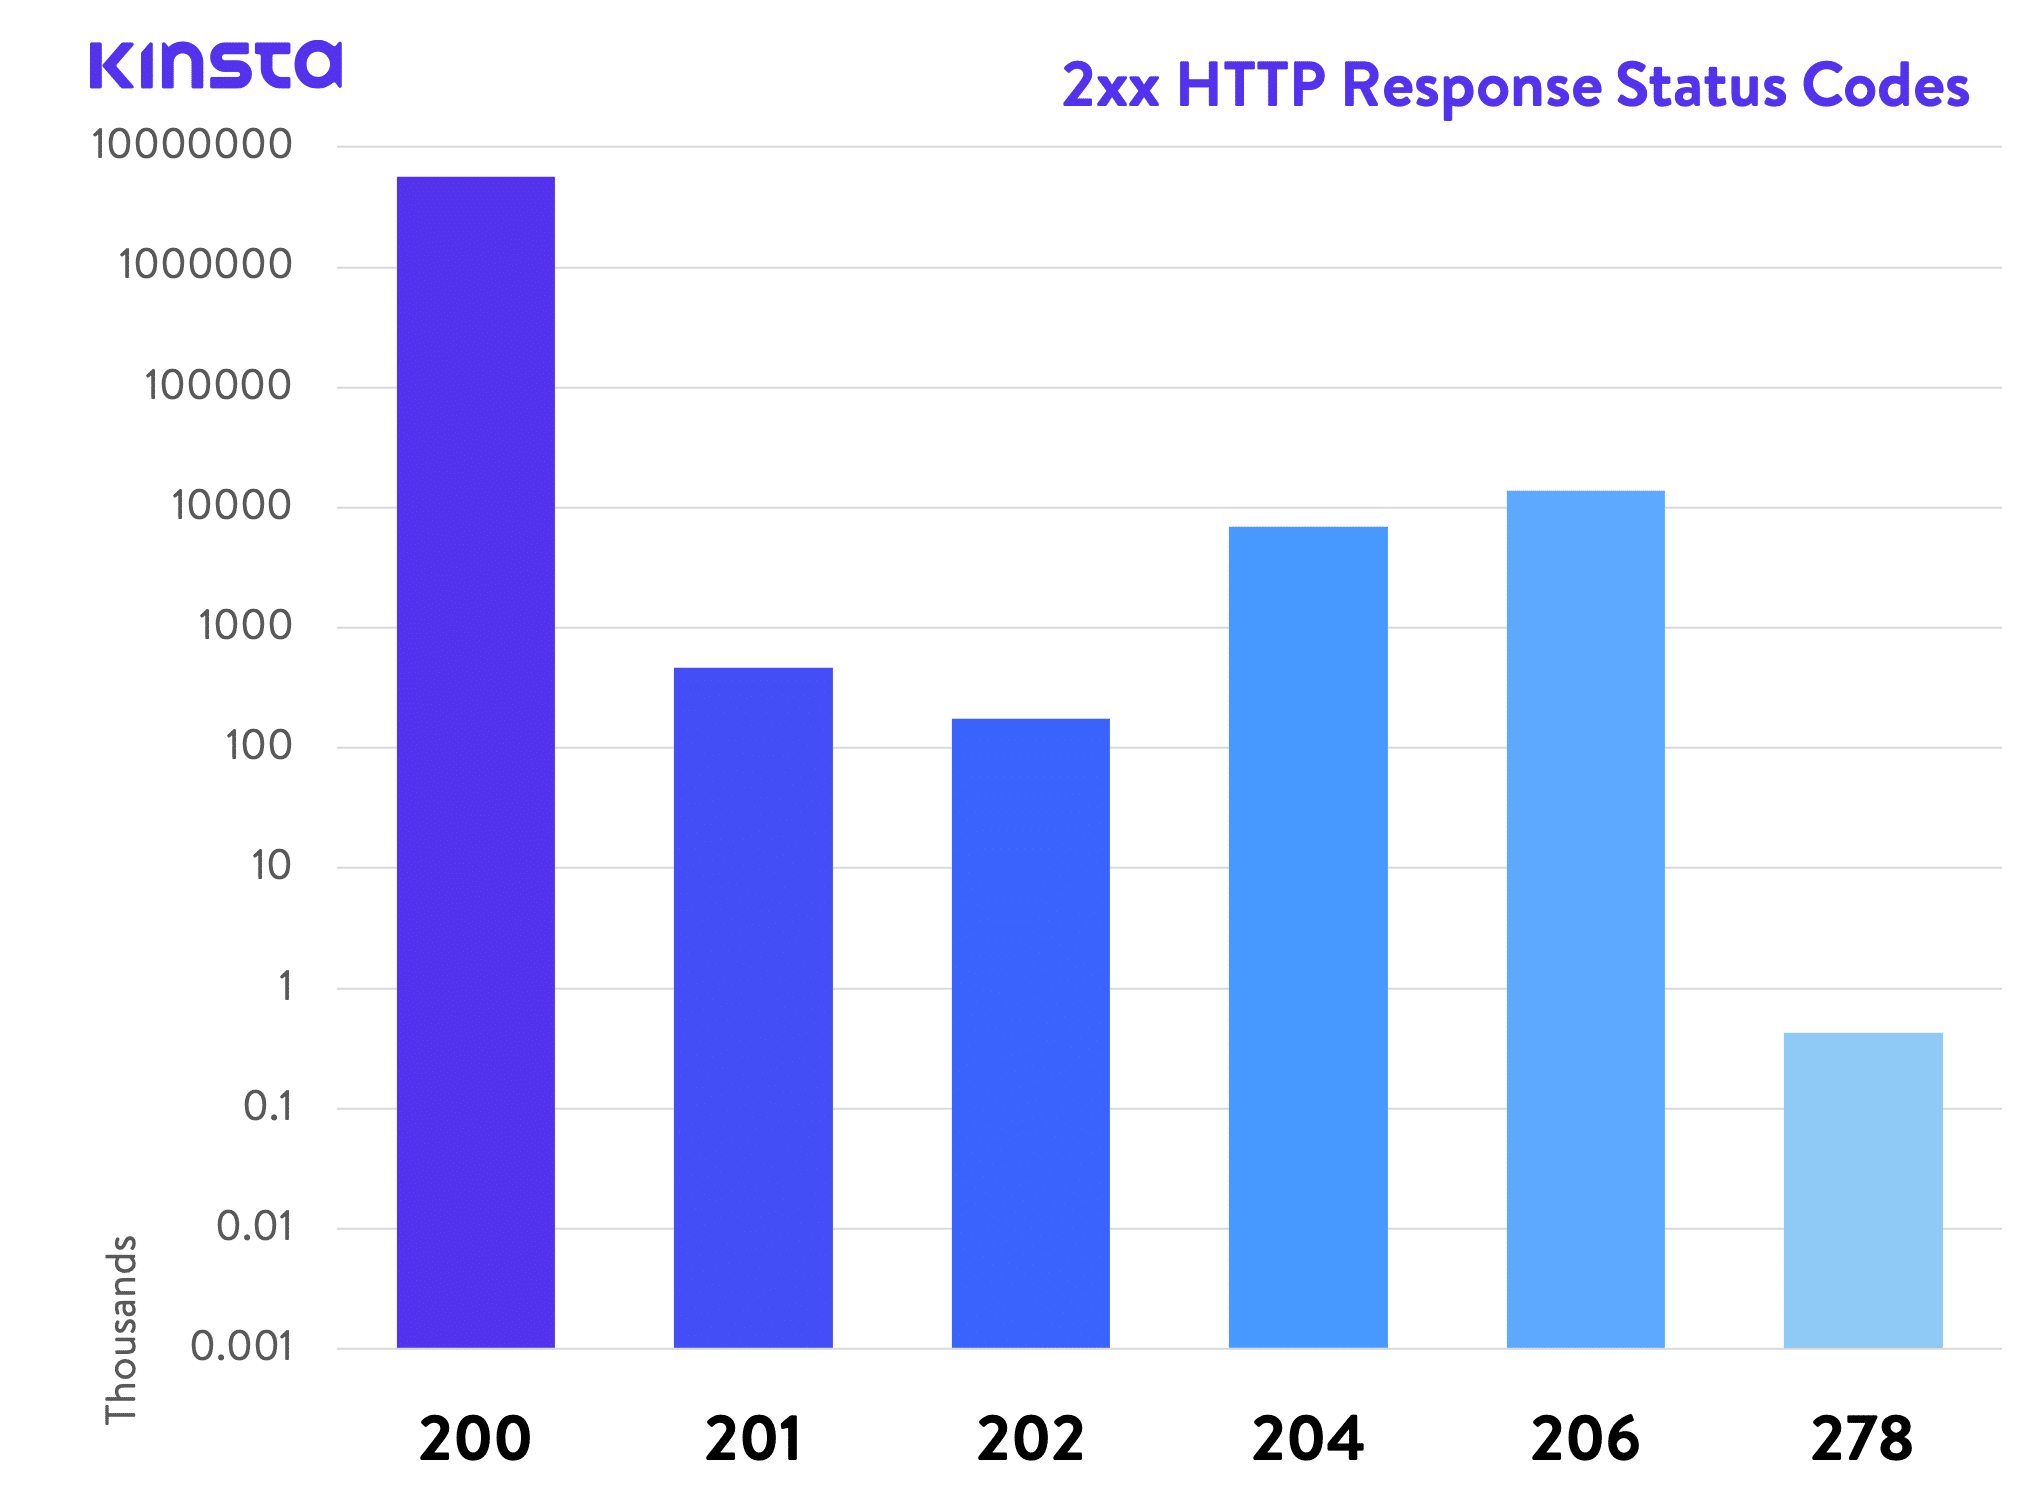
200 Response Codes
2xx success codes are returned when browser request was successfully received, understood, and processed by the server. Out of the 5.6+ billion 2xx response codes, here was the distribution.
- 5,612,645,073 requests returned 200
- 464,366 requests returned 201
- 176,325 requests returned 202
- 6,891,596 requests returned 204
- 13,840,463 requests returned 206
- 428 requests returned 278
You can see that a 200 response code was returned the most. This means that “Everything is OK.” It’s the code that is delivered when a web page or resource acts exactly the way it’s expected to.
300 Response Codes
3xx redirection codes are returned when a new resource has been substituted for the requested resource. Out of the 3.6+ billion 3xx response codes, here was the distribution.
- 239,992,263 requests returned 301
- 30,003,302 requests returned 302
- 39,154 requests returned 303
- 91,379,063 requests returned 304
- 1,212,079 requests returned 307
- 5,076 requests returned 308
You can see that a 301 response code was returned the most. This means that “The requested resource has been moved permanently.” This code is delivered when a web page or resource has been permanently replaced with a different resource.
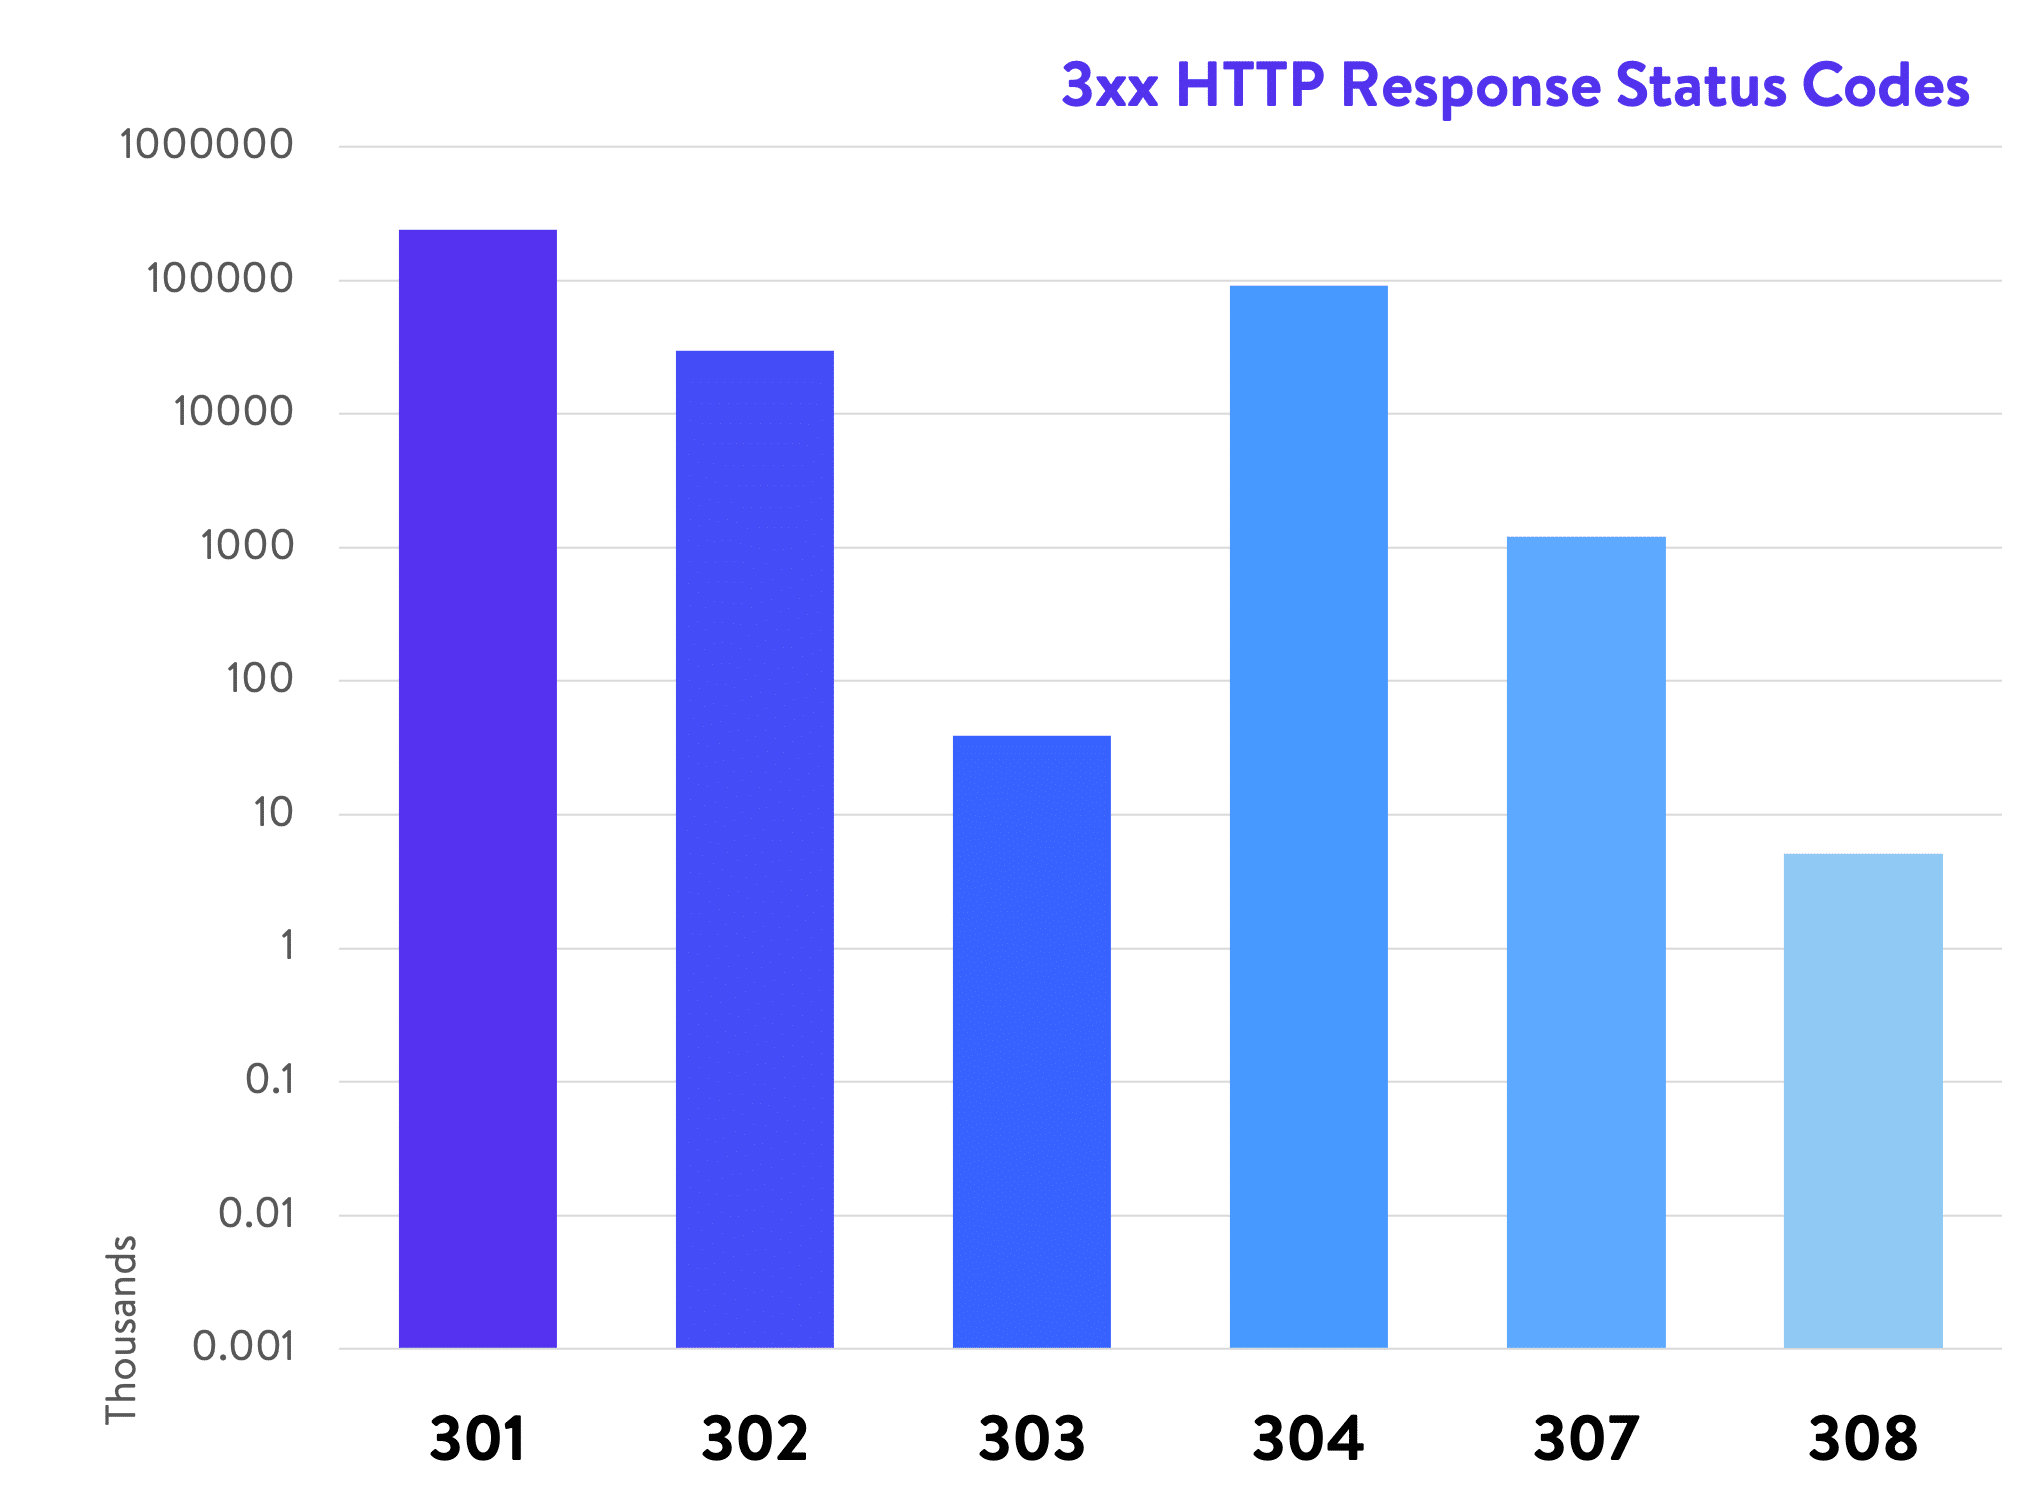
It’s not surprising that out of the 3xx response codes, a 301 is the most widely seen one, as it’s used for permanent URL redirection for SEO purposes.
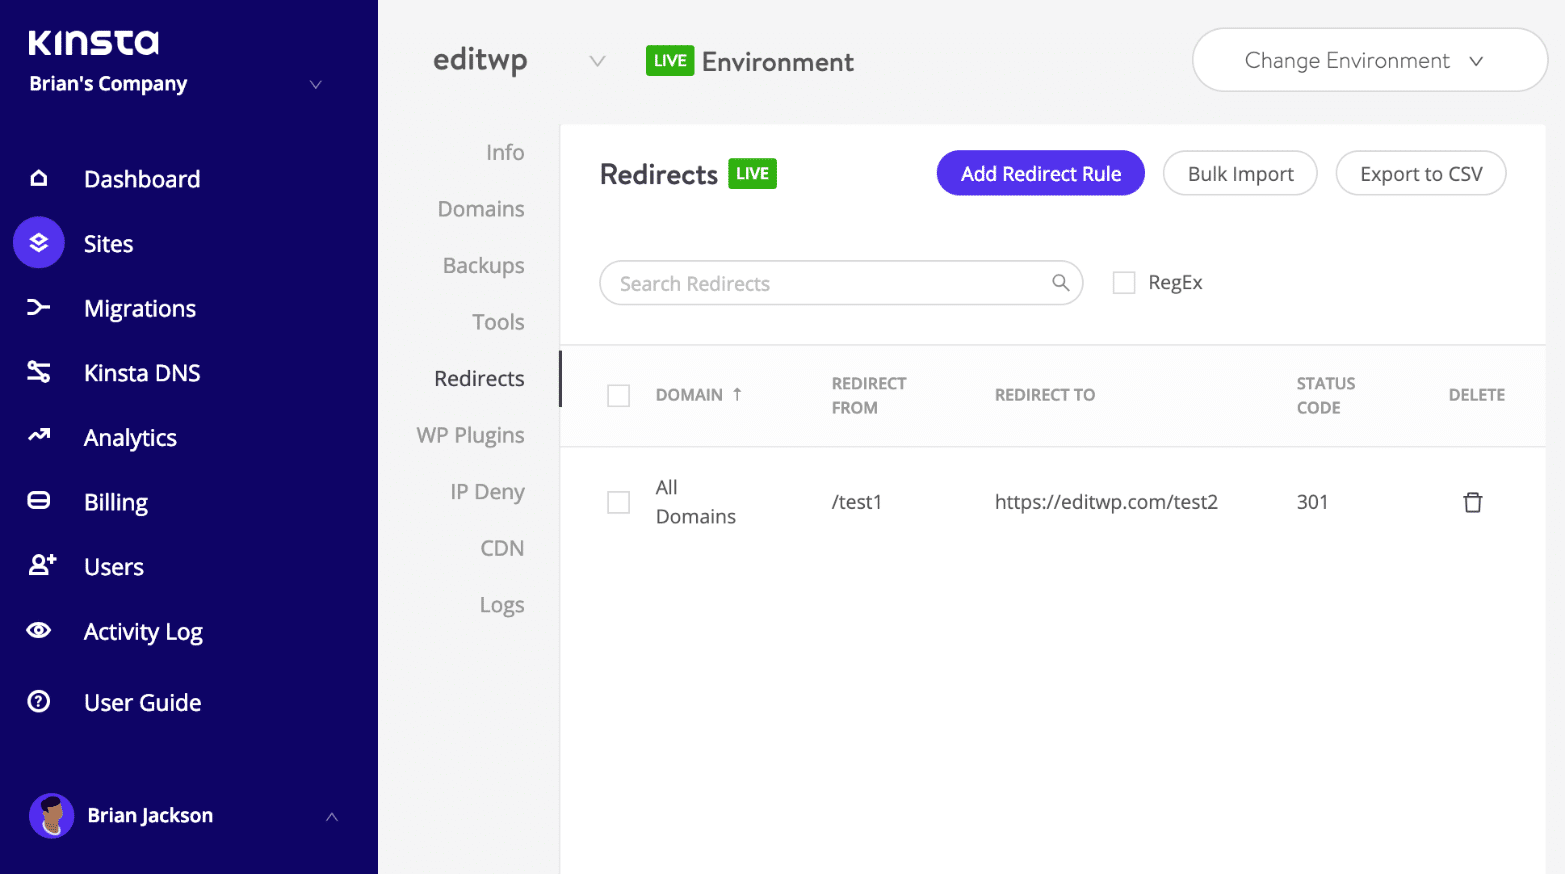
If you’re a Kinsta client, you can use the Redirect Tool in MyKinsta to easily add as many redirects as you need. It supports regex and is better for performance, as the redirects are added at the server level, and you no longer need a WordPress redirect plugin.
400 Response Codes
4xx response codes are client error codes indicating that there was a problem with the request. Out of the 4.8+ billion 4xx response codes, here was the distribution.
- 14,783,009 requests returned 400
- 1,311,362 requests returned 401
- 10,095 requests returned 402
- 2,8139,689 requests returned 403
- 407,692,910 requests returned 404
- 5,301,730 requests returned 405
- 8,946 requests returned 406
- 90,330 requests returned 409
- 319,074 requests returned 410
- 375,309 requests returned 412
- 84 requests returned 413
- 15,506 requests returned 414
- 1,190 requests returned 415
- 1,824 requests returned 416
- 134 requests returned 418
- 2 requests returned 419
- 32,976 requests returned 422
- 2 requests returned 423
- 23,467,660 requests returned 429
- 529 requests returned 444
- 4,391,165 requests returned 499
You can see that a 404 response code was returned the most. This means that “The requested resource was not found.” The most common error message of them all. This code means that the requested resource does not exist and that the server does not know if it ever existed.
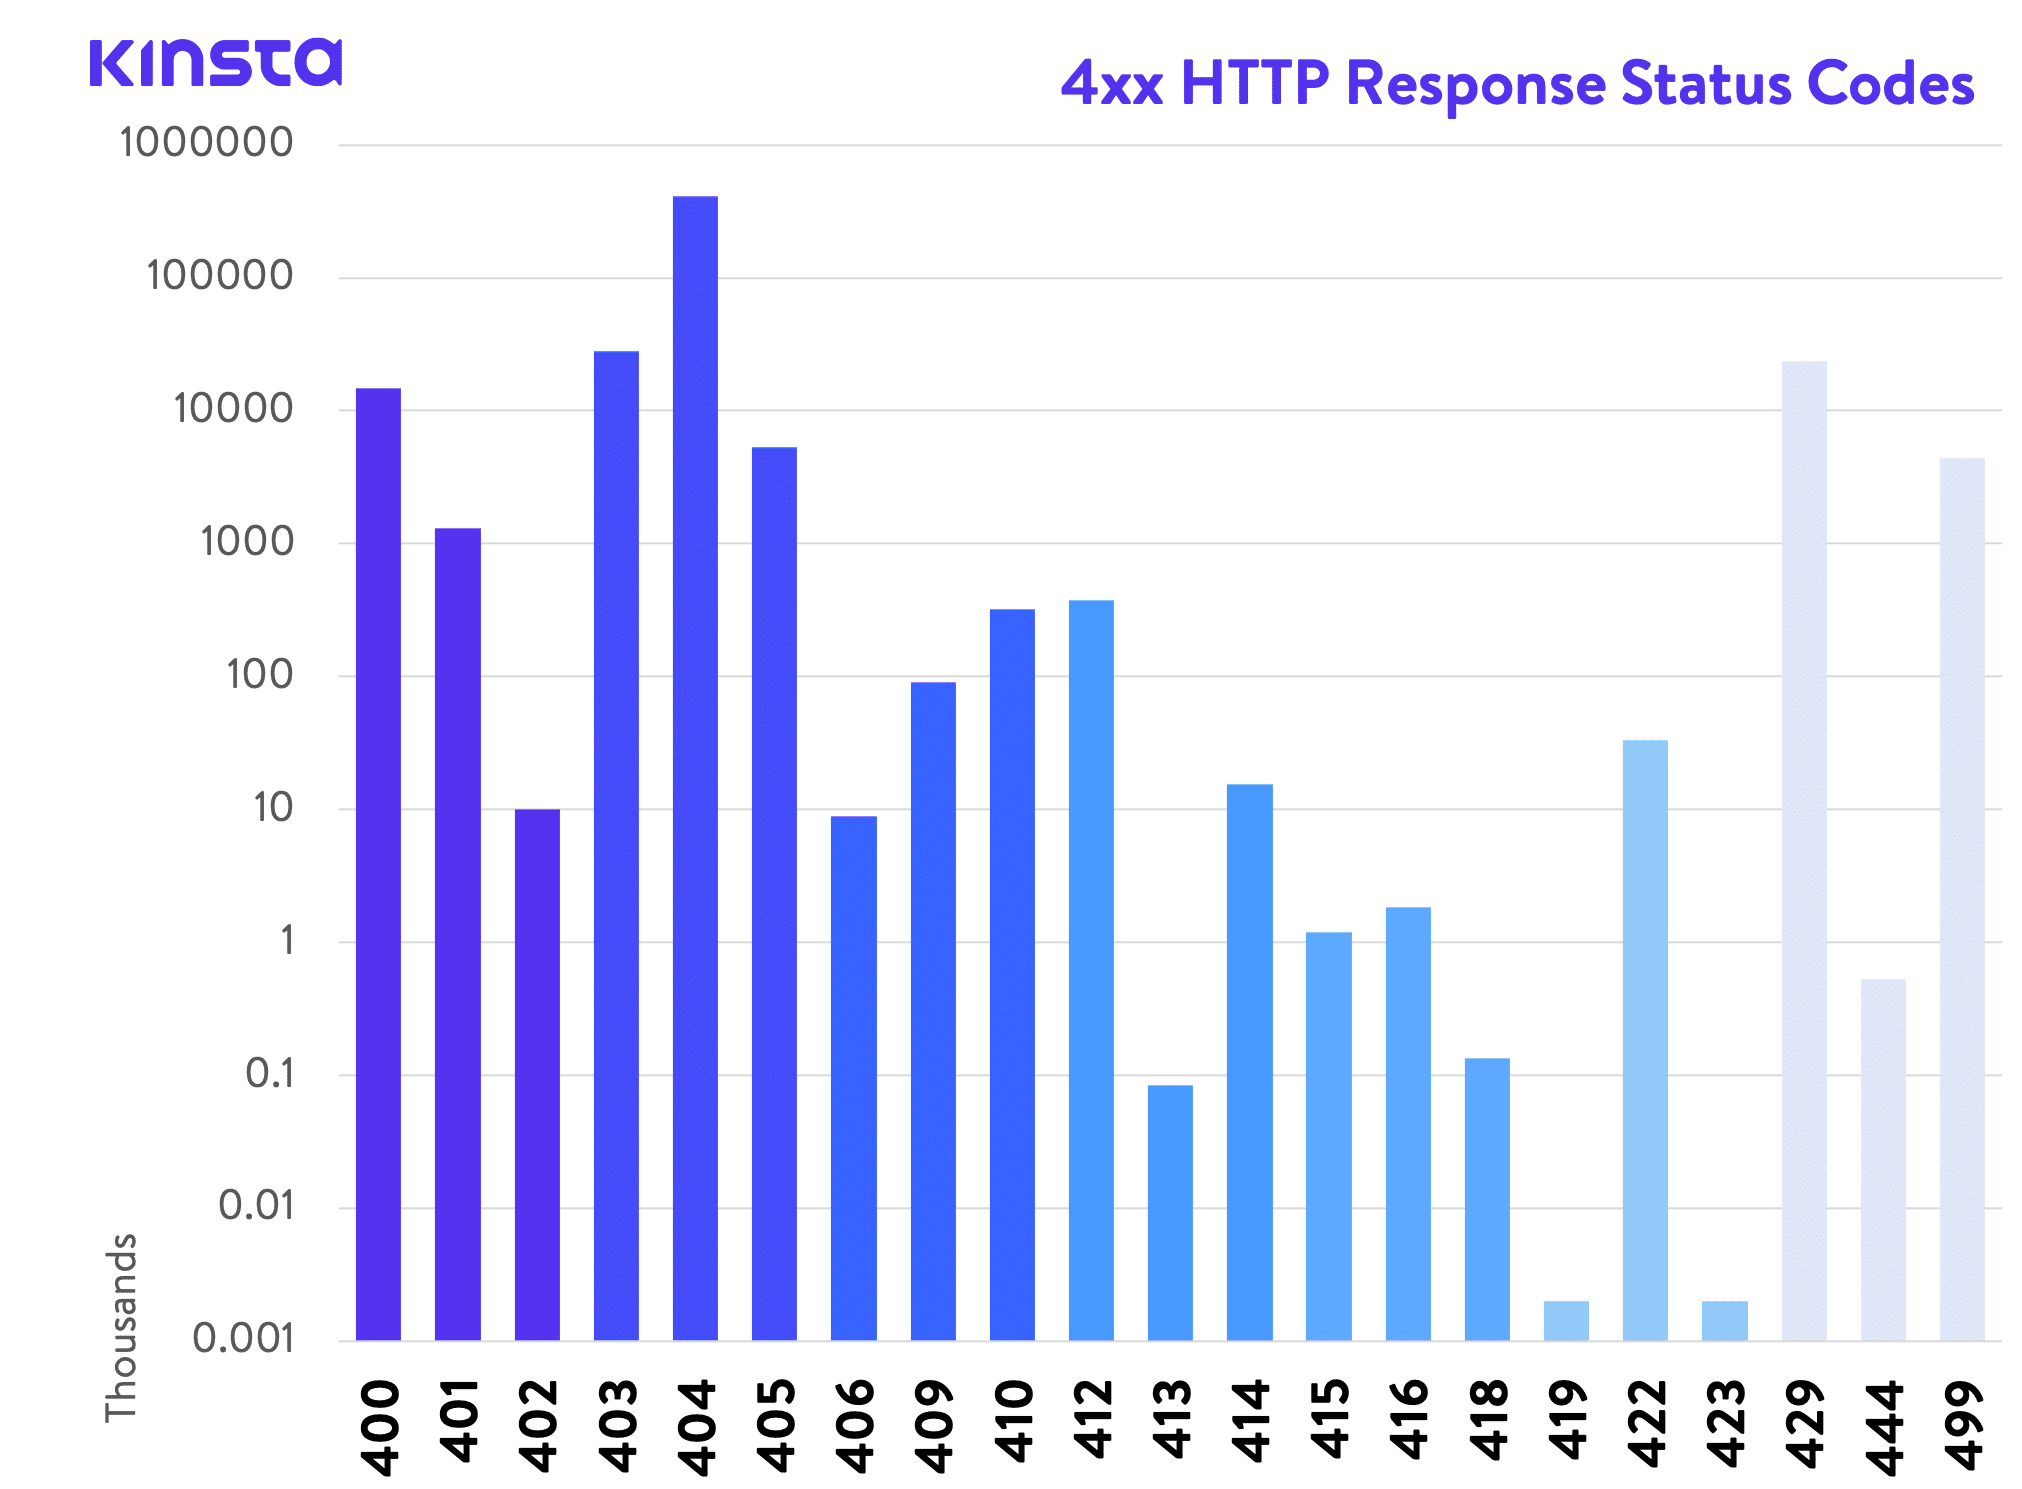
Seeing a 404 response code as the highest was not surprising to us. This is simply due to the fact that so many WordPress sites have broken links on them. A lot of times WordPress site owners simply can’t keep up with the changes or don’t know how to properly check for and fix these. Check out our in-depth tutorial on how to fix 404 errors.
Besides usability, another reason these errors are bad is that many 404 pages are very resource-intensive, which impacts performance. For large sites, you’ll want to avoid a heavy 404 page. Create a simple 404 template that avoids querying the database any further if possible.
500 Response Code
A 500 server error code indicates that the request was accepted, but that an error on the server prevented the fulfillment of the request. Out of the 8 billion requests, here was the distribution.
- 3,521,528 requests returned 500, which is .04% of all requests.
This means that “There was an error on the server and the request could not be completed.” A generic code that simply means “internal server error”. Something went wrong on the server and the requested resource was not delivered.
This code is typically generated by third-party plugins, faulty PHP, or even the connection to the database breaking. Check out our tutorials on how to fix the error establishing a database connection and other ways to resolve a 500 internal server error.
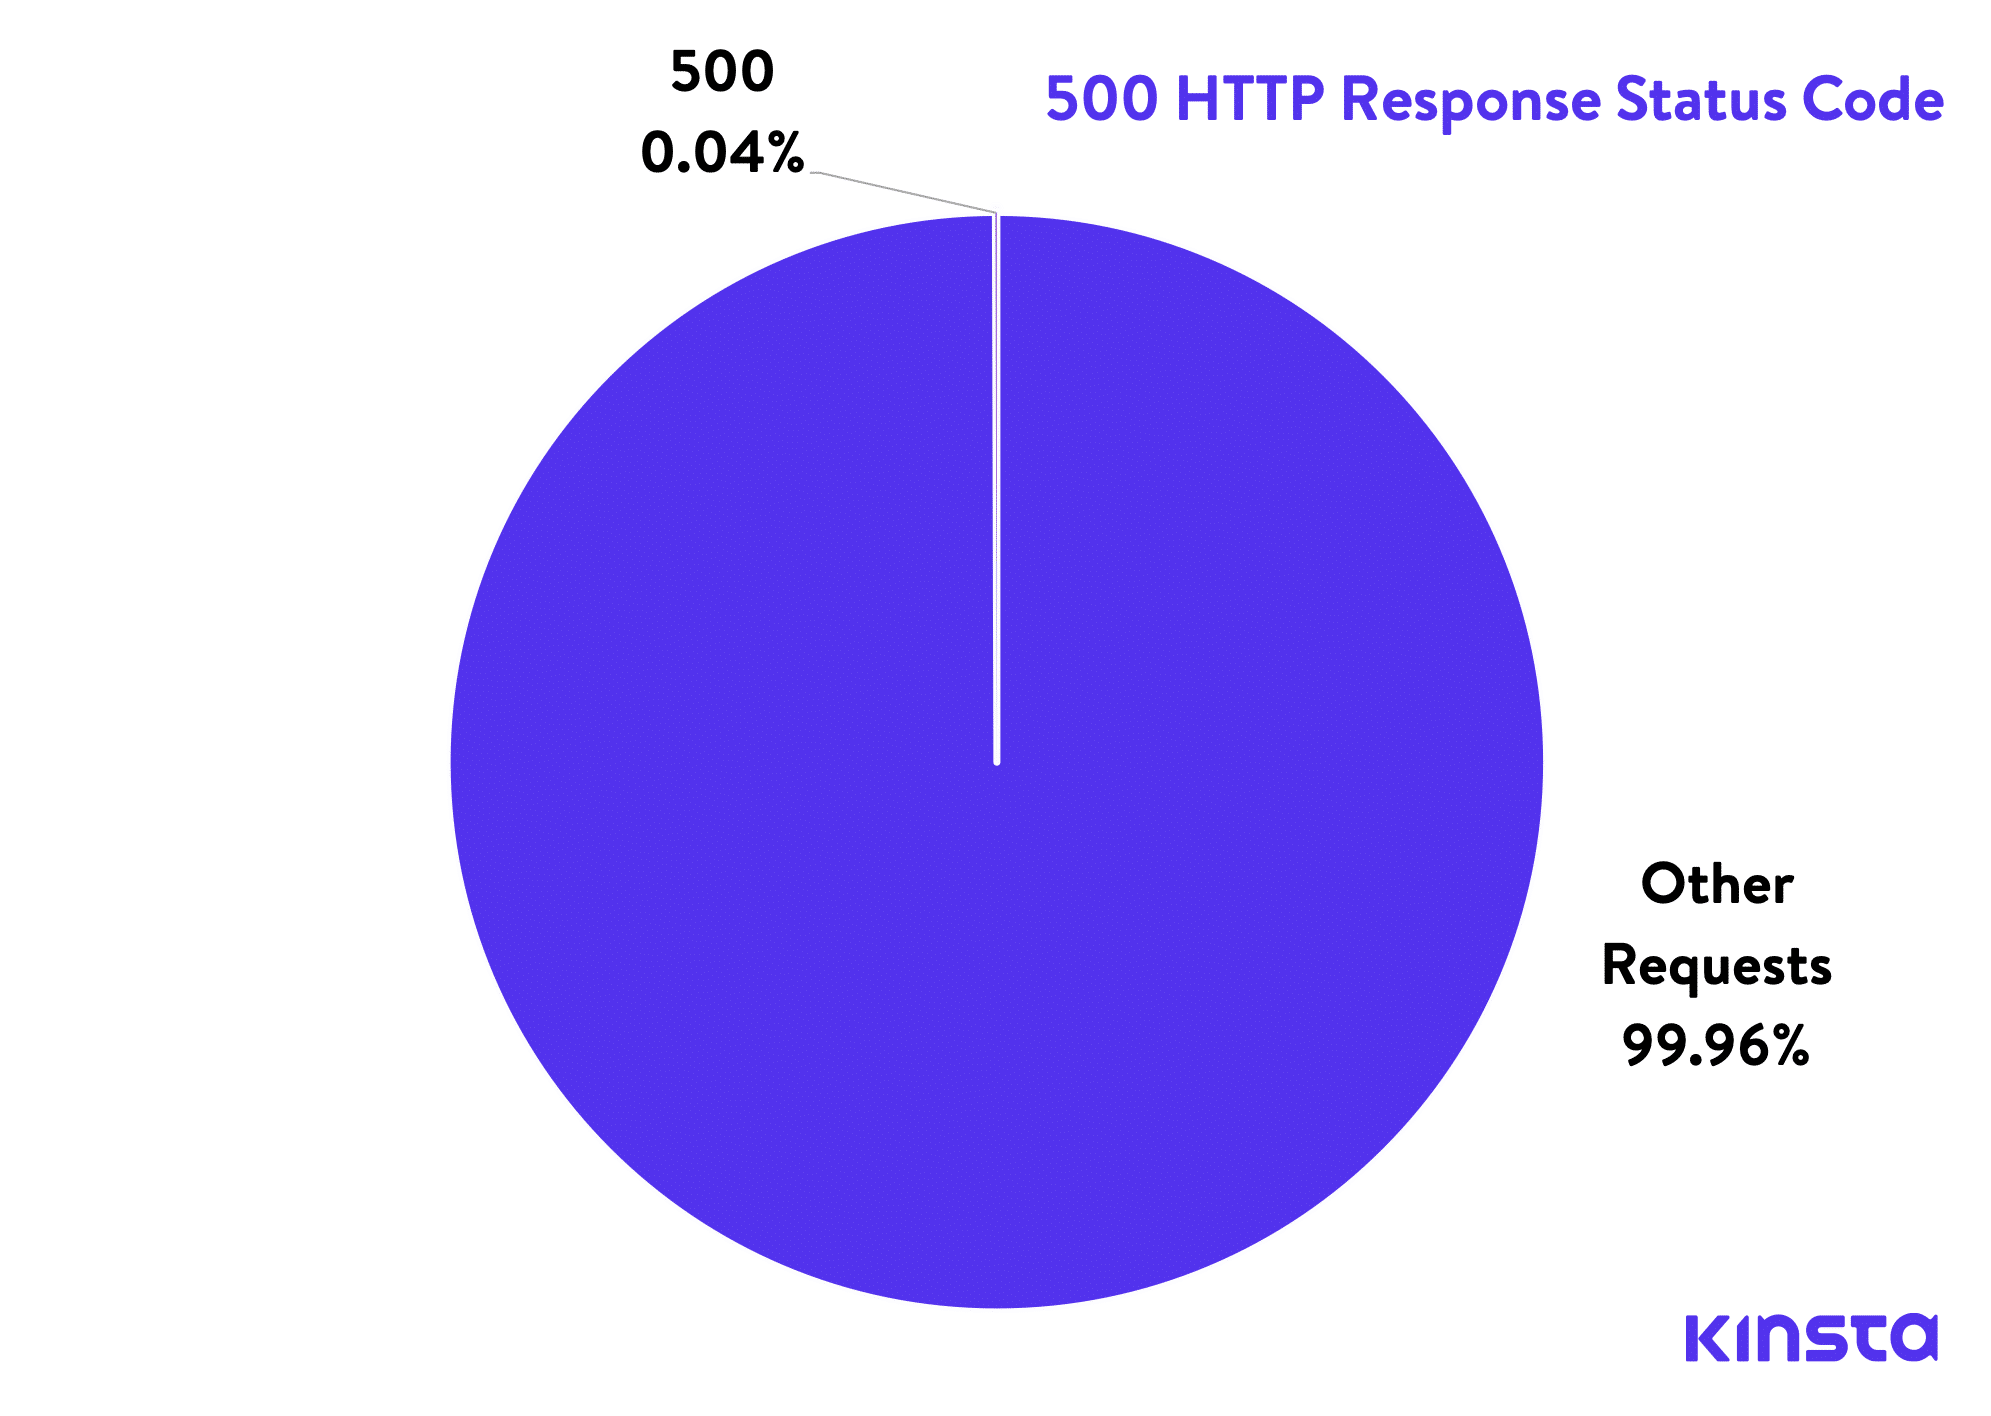
One thing we love about WordPress is that there are thousands of amazing plugins to choose from. However, they are also usually one of the things that cause the most 500 errors.
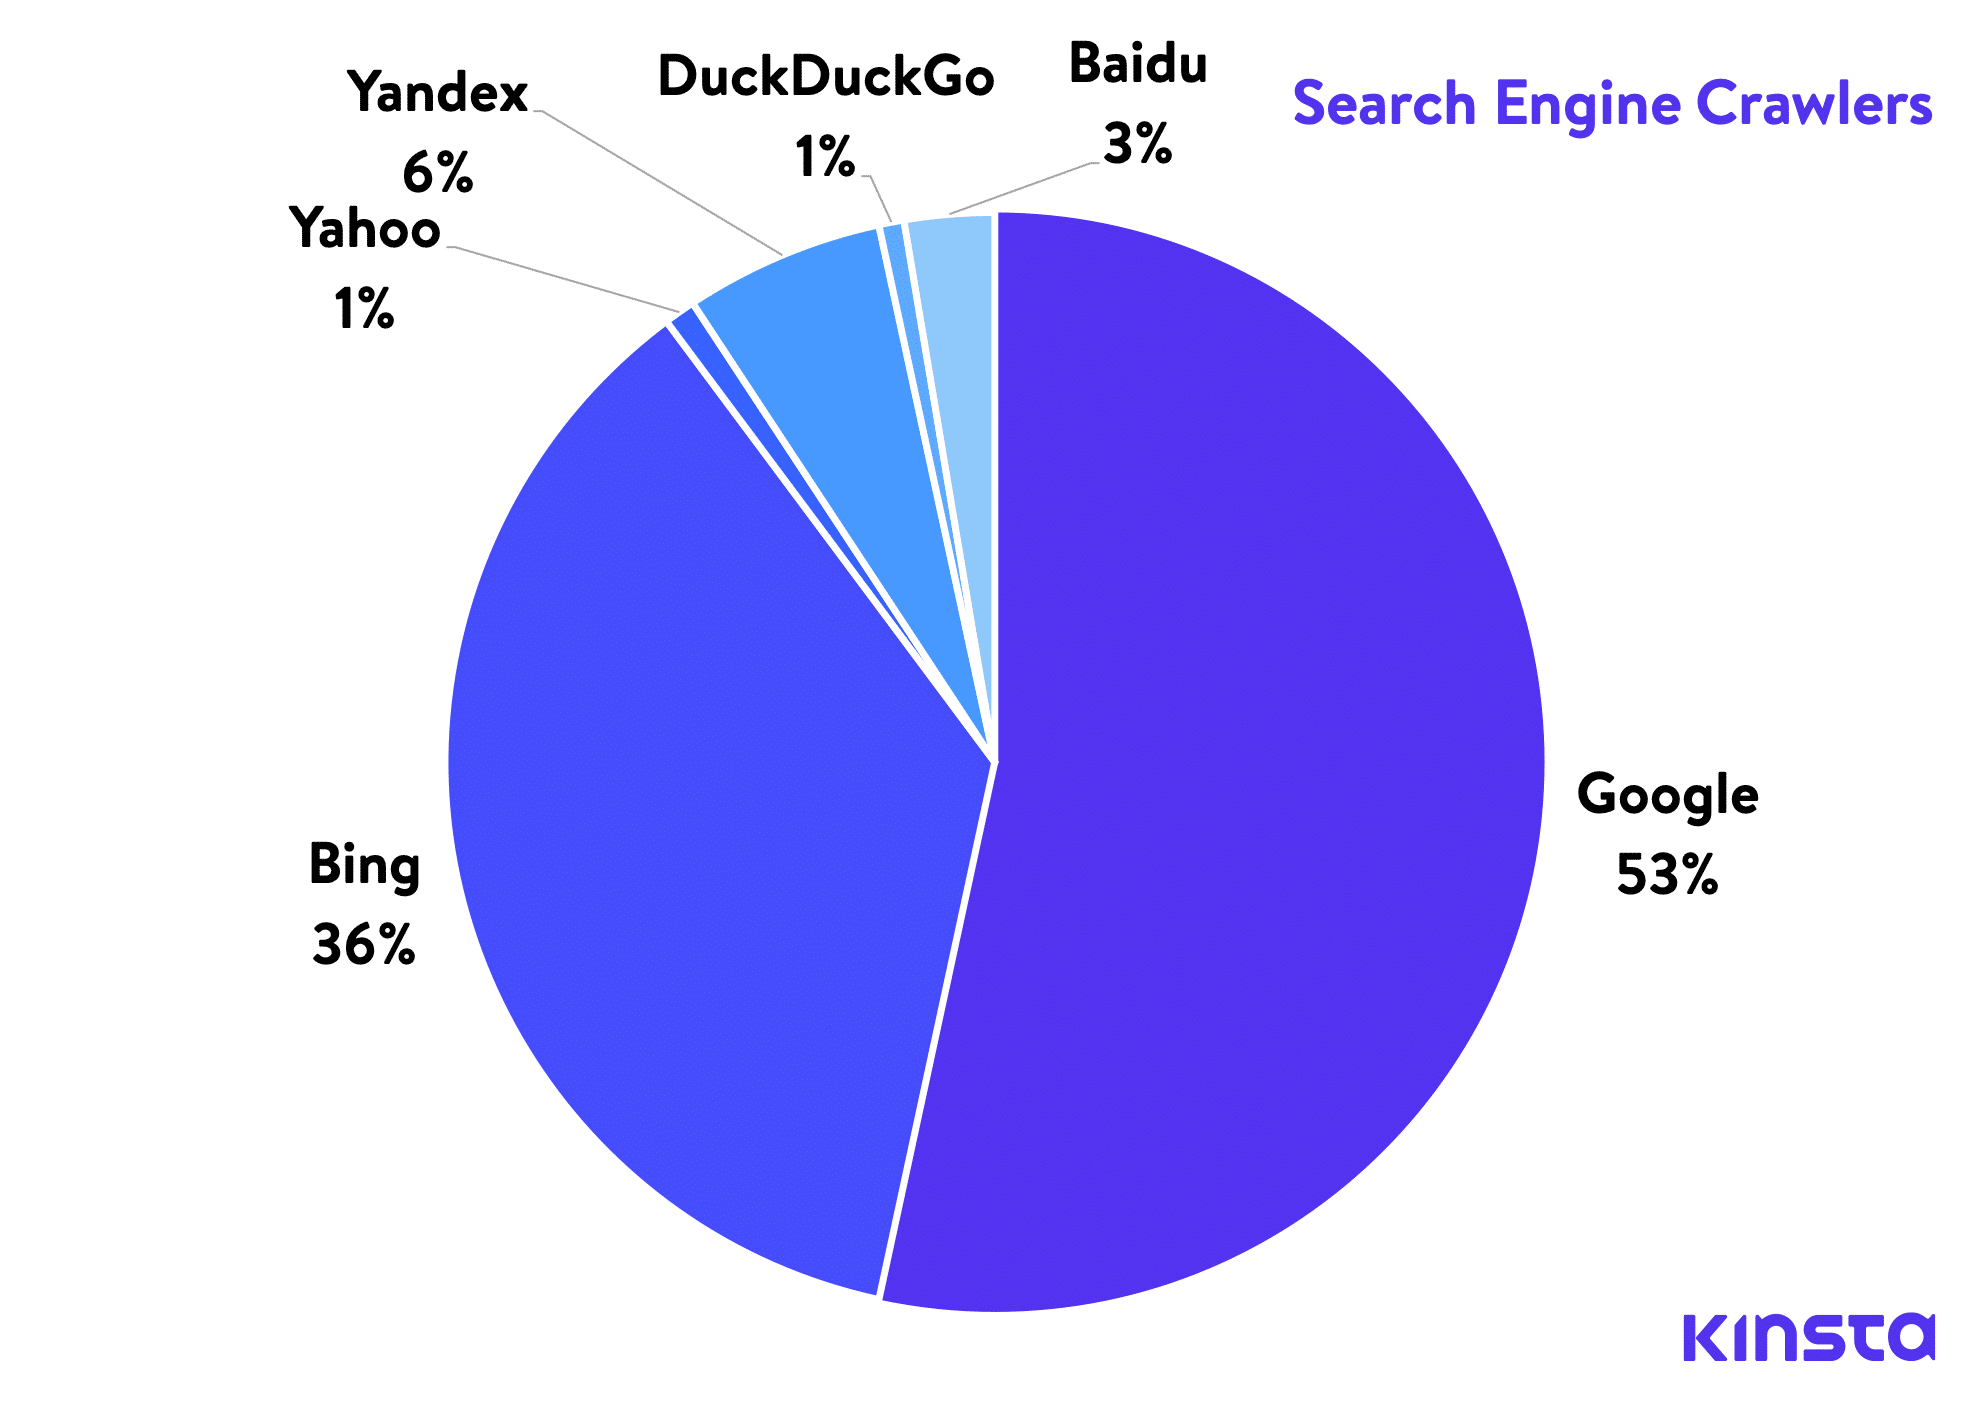
Search Engine Crawlers
Remember the “1.5+ billion requests from everything else” we looked at in the beginning of this post? We then looked at the distribution of search engine crawlers within that.
- 296,138,088 requests from Google (Googlebot)
- 202,089,312 requests from Bing (Bingbot)
- 5,147,672 requests from Yahoo (Slurp)
- 32,607,911 requests from Yandex (yandex.ru, yandex.net or yandex.com)
- 4,096,169 requests from DuckDuckGo (DuckDuckGo)
- 14,685,230 requests from Baidu (Baiduspider)
As you can see, Google is the number one search engine crawler of sites hosted at Kinsta. This really isn’t surprising as Google is by far the biggest search engine on the web (even though it’s not the only one). According to statcounter, Bing only maintains 2.4% of the search engine market share.
The fact that 36% and or 200+ million requests are coming from Bing, means that they are still indexing a lot of data and perhaps even crawling at a more frequent pace. In other words, just because Bing isn’t as popular, doesn’t mean it isn’t indexing and crawling a large amount of data!
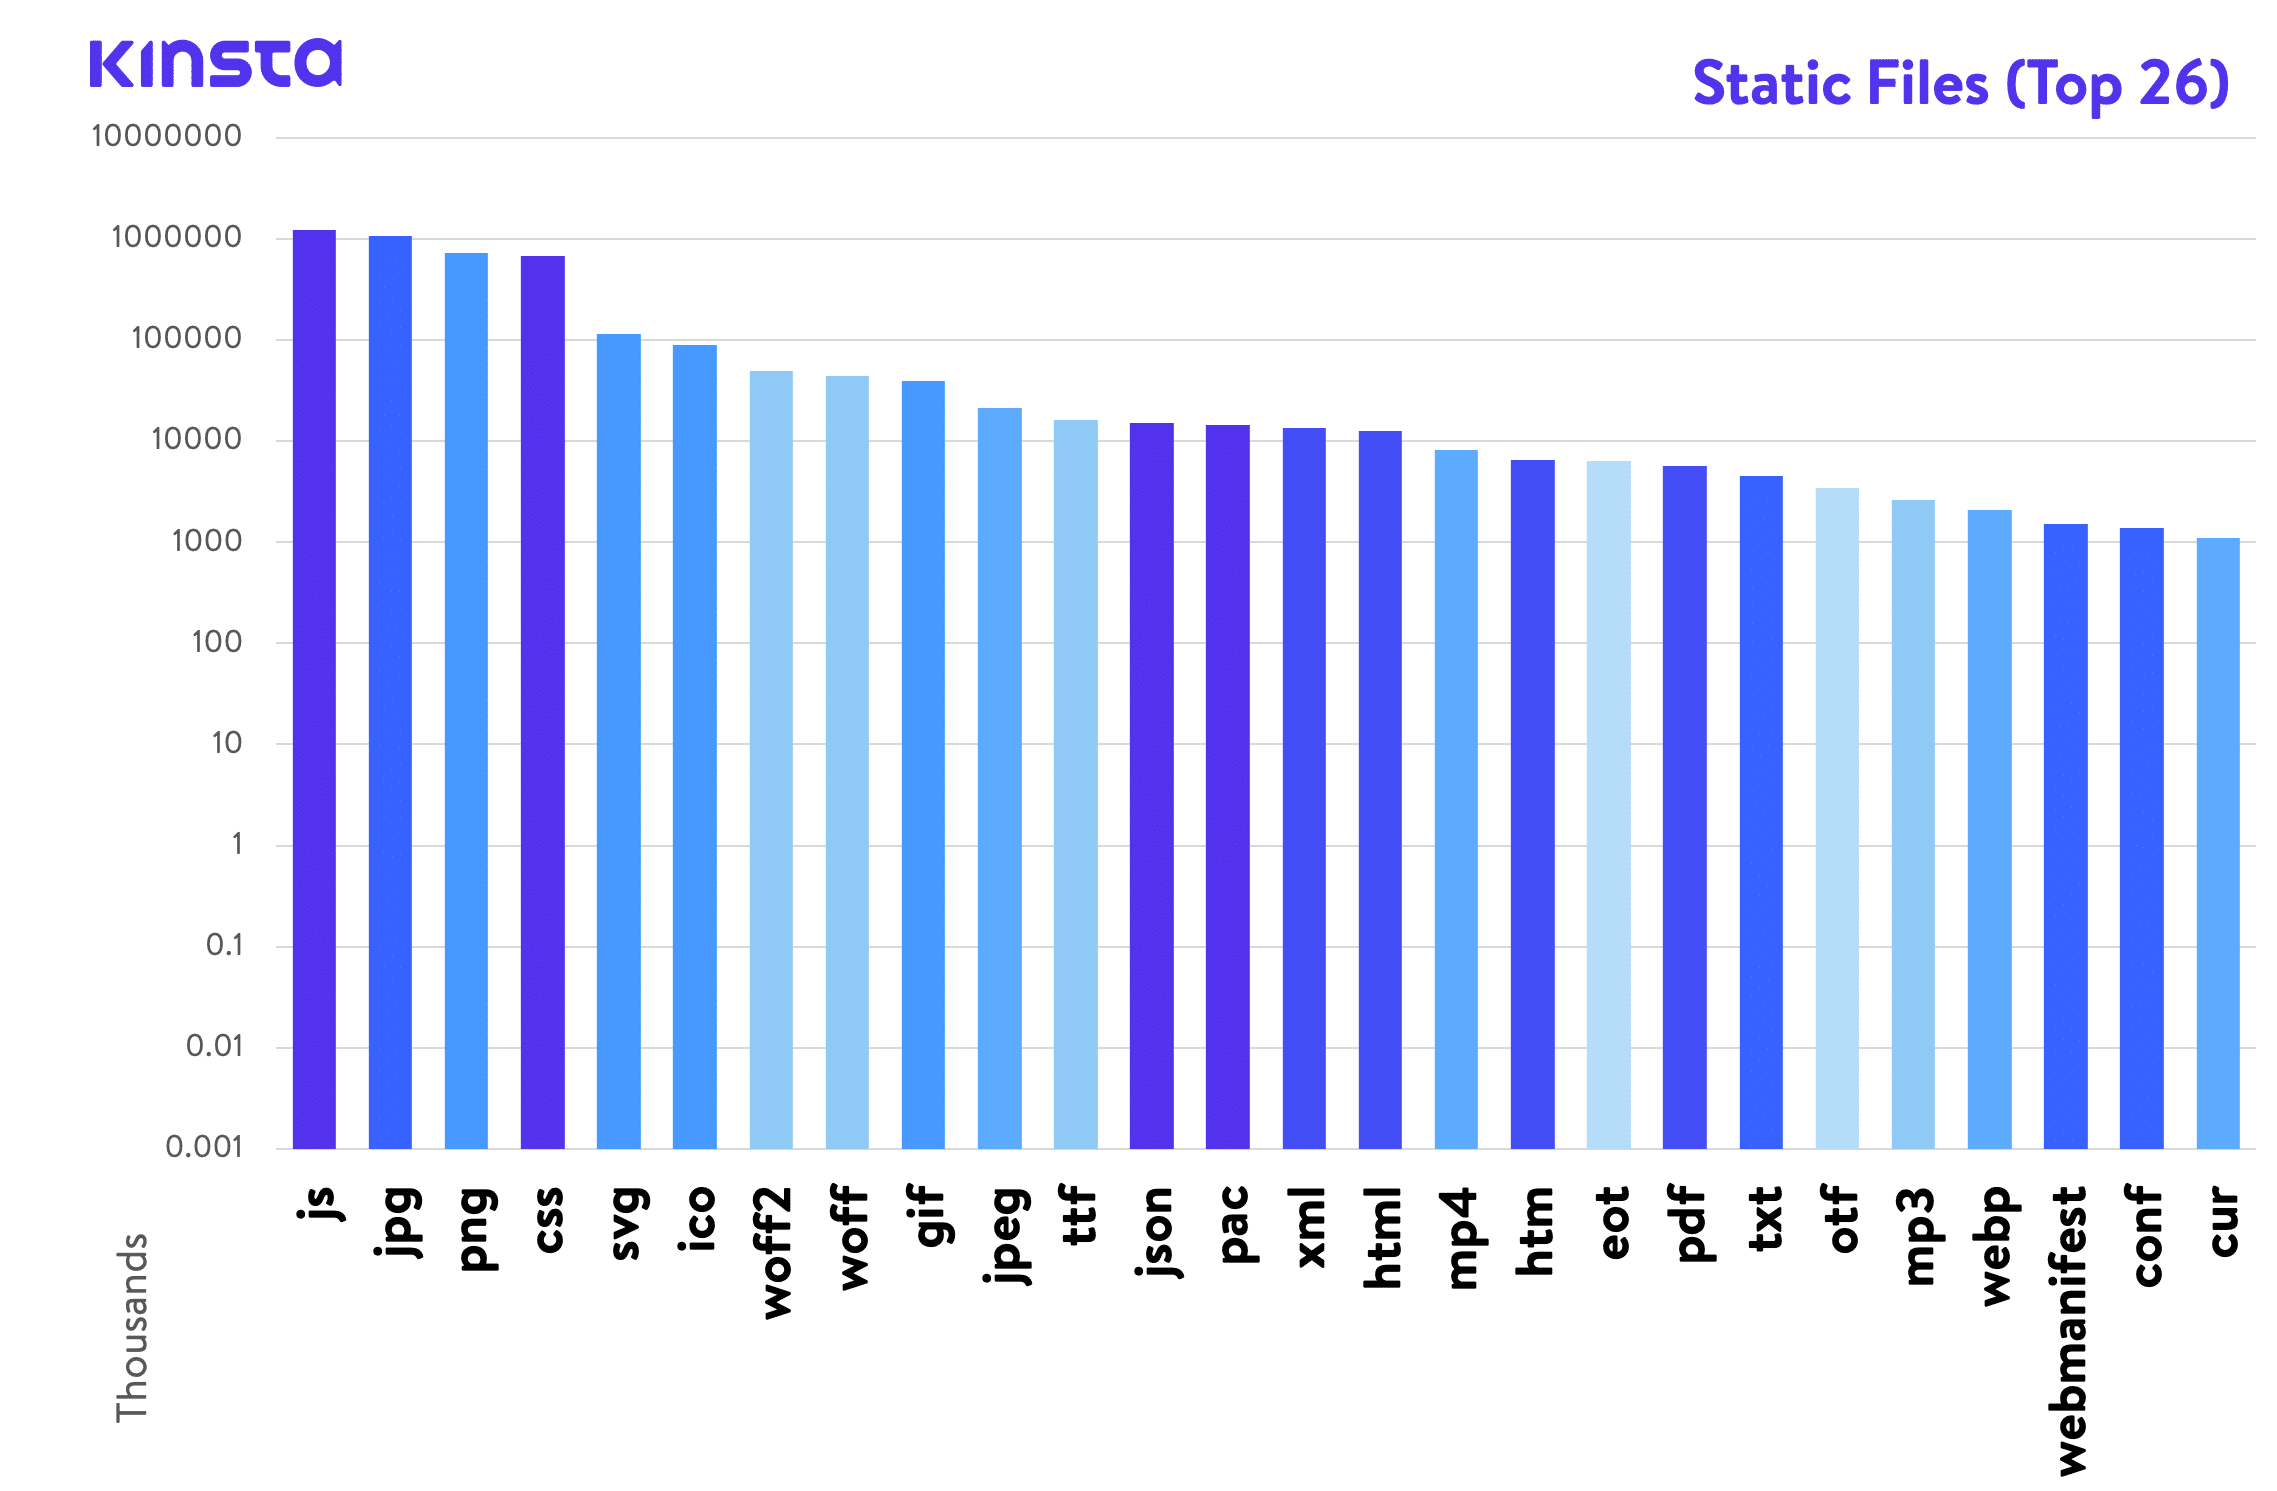
Static Files
We were curious to see which file types were being requested the most by Kinsta hosted WordPress sites. Here are the results.
- 1,236,061,584 requests for
.jsfiles - 677,593,186 requests for
.cssfiles - 14,994,575 requests for
.jsonfiles - 14,481,137 requests for
.pacfiles - 13,407,382 requests for
.xmlfiles - 12,601,551 requests for
.htmlfiles - 6,502,068 requests for
.htmfiles - 5,726,959 requests for
.pdffiles - 4,475,057 requests for
.txtfiles - 1,526,141 requests for
.webmanifestfiles - 1,383,469 requests for
.conffiles - 1,070,029,306 requests for
.jpgfiles - 718,437,582 requests for
.pngfiles - 114,168,603 requests for
.svgfiles - 89,211,616 requests for
.icofiles - 39,439,970 requests for
.giffiles - 21,371,010 requests for
.jpegfiles - 2,100,825 requests for
.webpfiles - 1,088,319 requests for
.curfiles - 8,221,104 requests for
.mp4files - 2,623,488 requests for
.mp3files - 49,086,037 requests for
.woff2files - 44,395,929 requests for
.wofffiles - 16,045,404 requests for
.ttffiles - 6,395,202 requests for
.eotfiles - 3,438,946 requests for
.otffiles
JavaScript files (.js) are the number one requested file type by Kinsta hosted sites. While most of these results weren’t too surprising, it was interesting to see over 2 million requests for .webp files (Google’s new smaller image format) and how .jpg topped .jpeg with over 1 billion requests while the second going north of 21 million only (read why here: jpg vs jpeg). Kinsta supports WebP and we’ll have some more information coming out soon about this! 😉
SEO Tools (Crawlers and Bots)
Next, we wanted to take a look at the requests from the 2.4+ billion SEO crawlers and bots. These tools are continuously hitting WordPress sites as they gather backlink data for their databases, as well as running SEO audit tools.
- 26,691,247 requests from Moz
- 86,049,707 requests from Ahrefs
- 2,690,306 requests from Screaming Frog
- 98,014,939 requests from SEMrush
- 51,550,801 requests from Majestic
- 54,046 requests from cognitiveSEO
SEMrush had the most requests against Kinsta hosted sites with a whopping 98+ million. Ahrefs came in a close second with 86+ million requests. The statistic that surprised us the most here was how low Moz was. We would have assumed there would have been a lot more. However, remember this doesn’t pertain to their index size. It could be they are simply crawling more efficiently.
Many don’t realize just how much these types of SEO tools are hitting their sites. The answer is, a lot! Remember, if you’re a Kinsta client, we don’t count these against your billable visits.
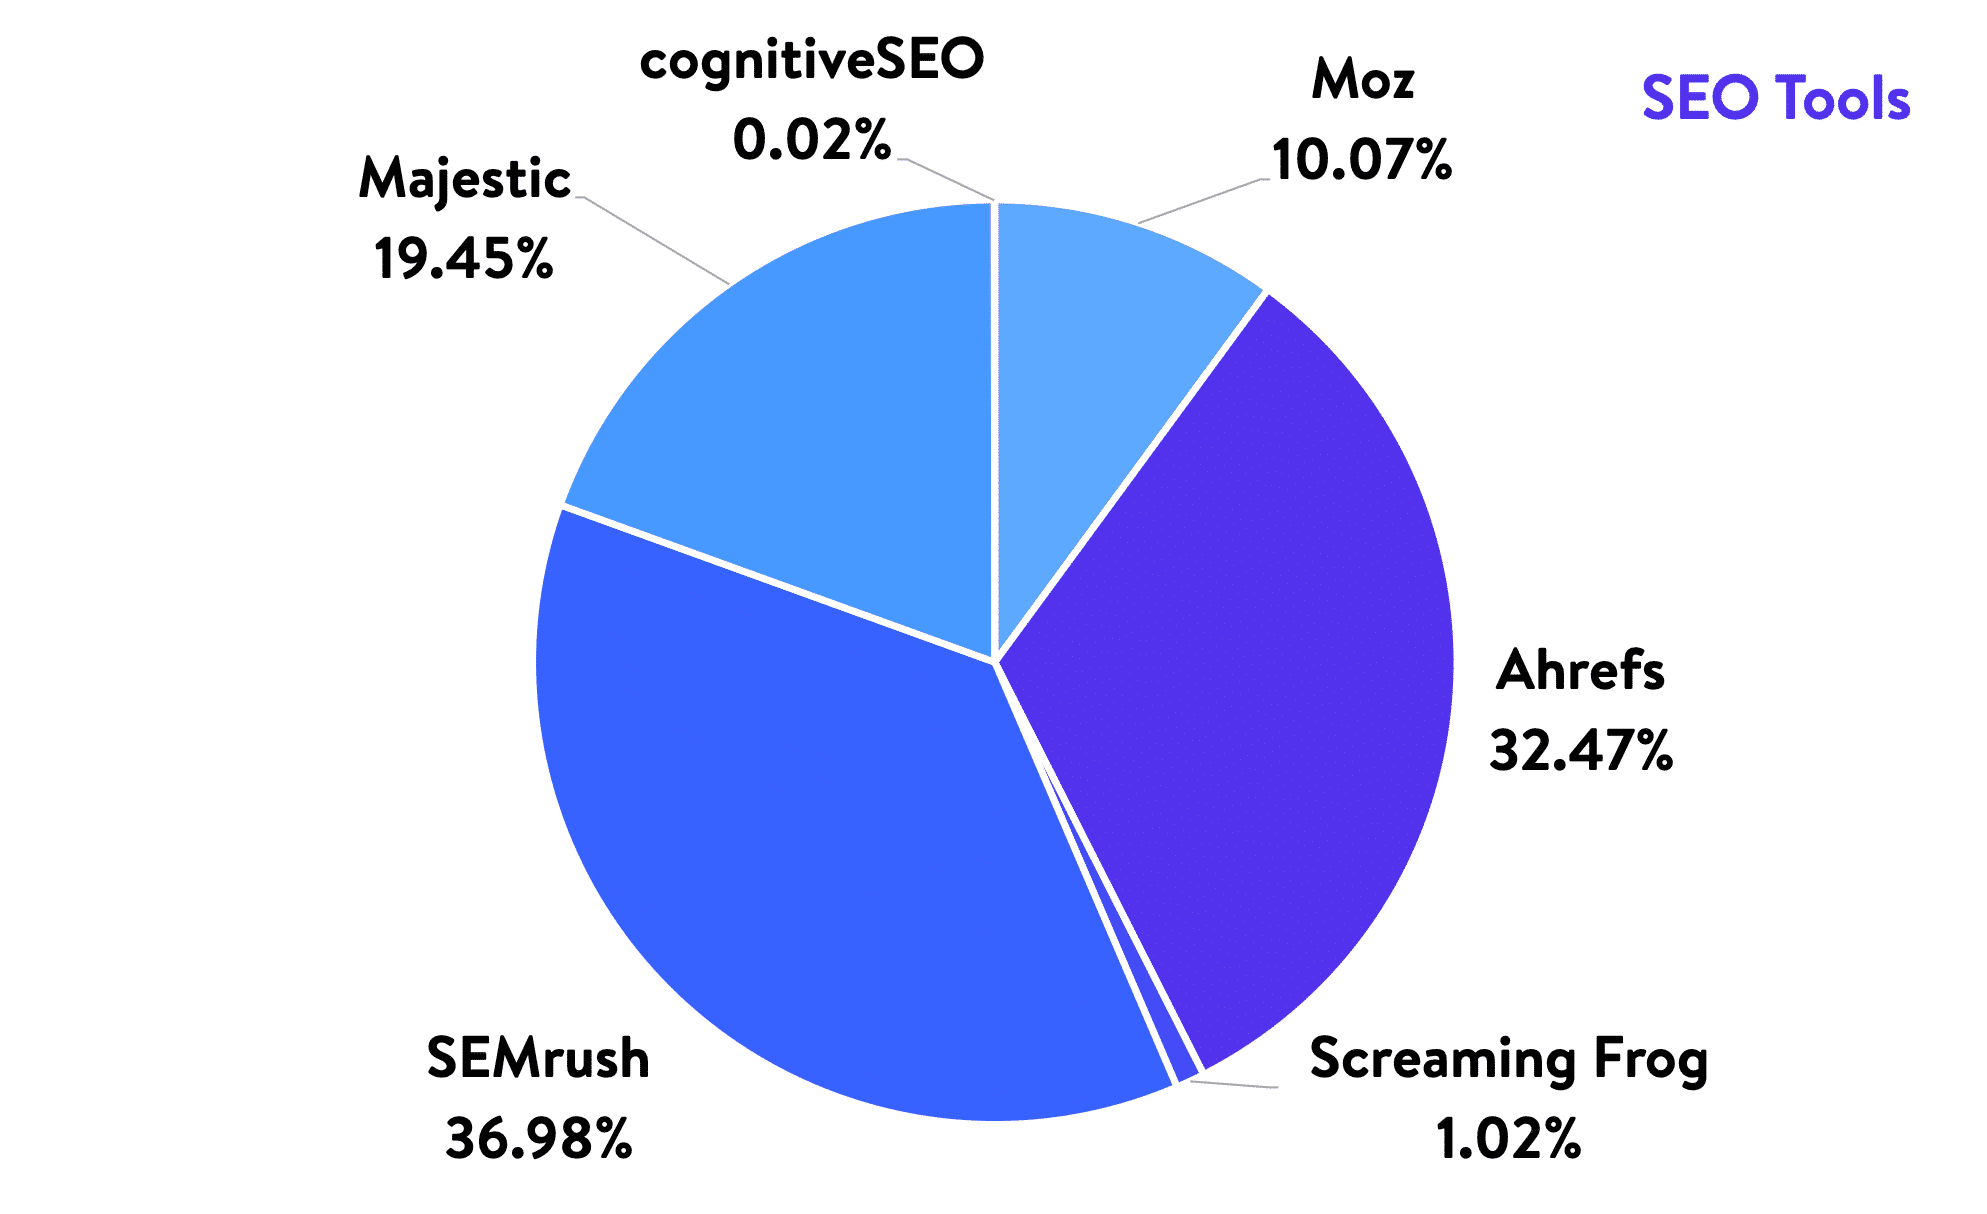
Ahrefs is one of our favorite SEO tools! Check out how we cleaned up a negative SEO attack with it.
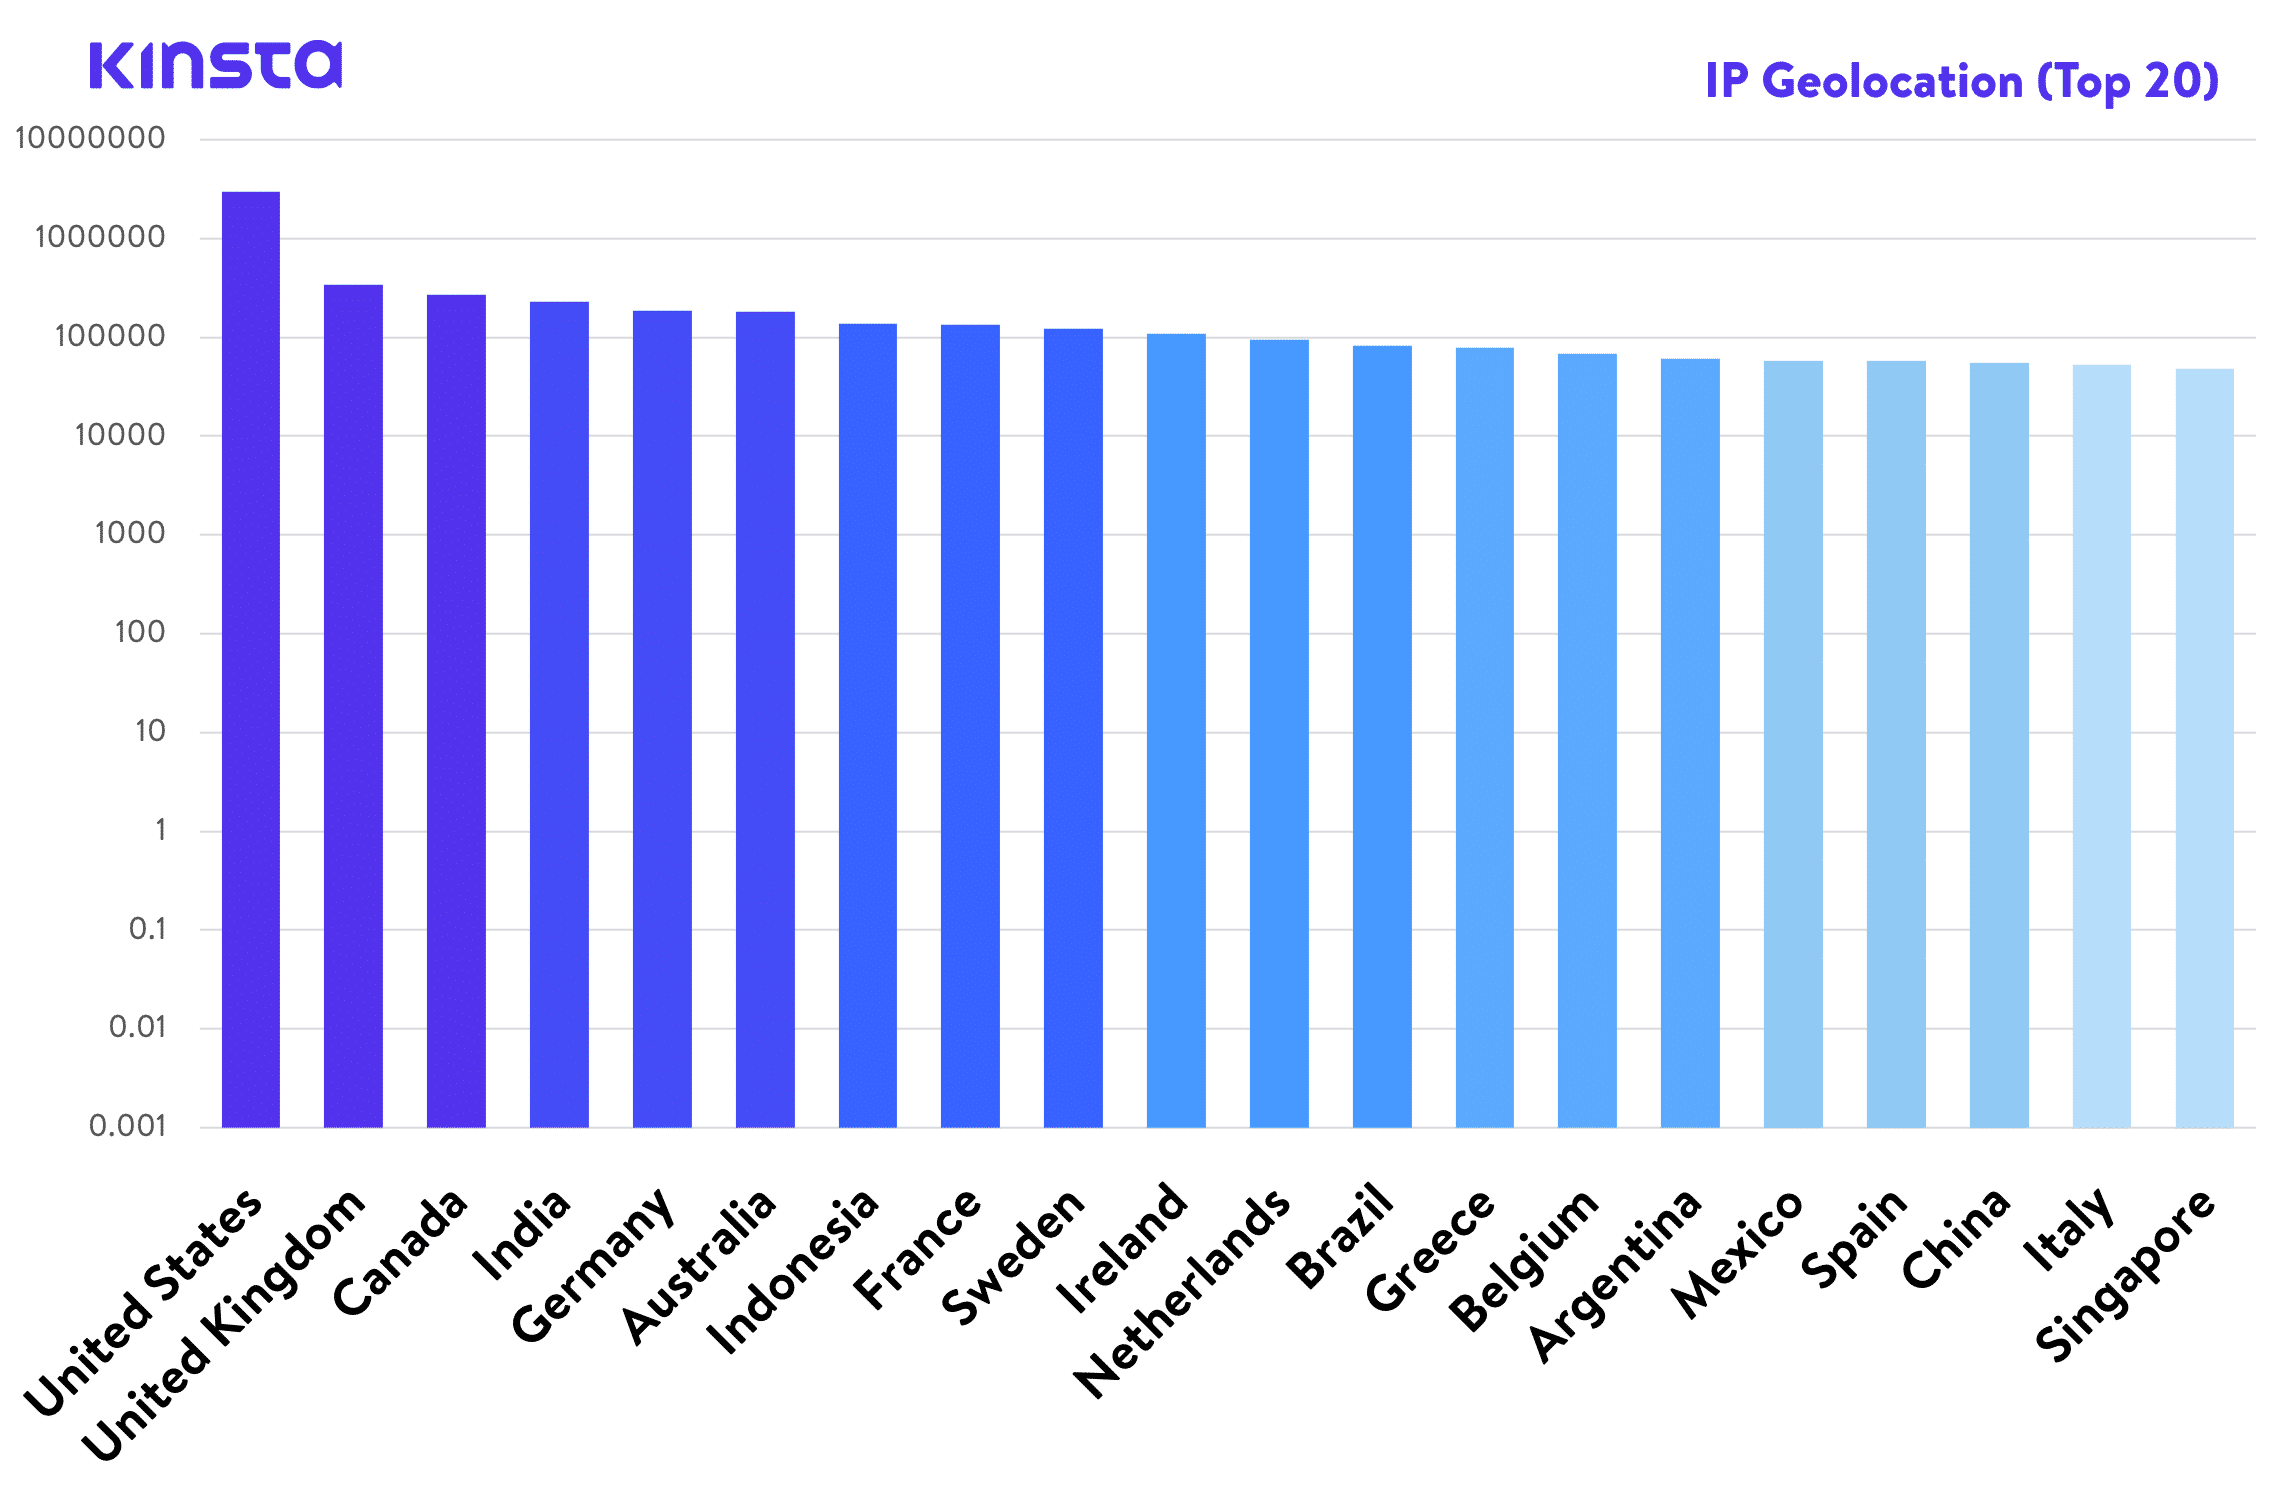
IP Geolocation Stats
Next, we were curious where the most requests were coming from geographically, so we pulled the data.
- 3,009,603,588 requests from the United States
- 338,547,518 requests from the United Kingdom
- 272,523,573 requests from Canada
- 229,216,018 requests from India
- 187,608,219 requests from Germany
- 183,092,752 requests from Australia
- 136,572,768 requests from Indonesia
- 133,160,302 requests from France
- 122,017,186 requests from Sweden
- 107,672,467 requests from Ireland
- 95,056,260 requests from the Netherlands
- 81,944,390 requests from Brazil
- 79,022,194 requests from Greece
- 67,619,795 requests from Belgium
- 60,189,992 requests from Argentina
- 5,790,0871 requests from Mexico
- 57,405,068 requests from Spain
- 55,546,628 requests from China
- 52,991,930 requests from Italy
- 48,076,976 requests from Singapore
Probably not to anyone’s surprise, the most requests from Kinsta hosted sites came from the United States, with over 3 billion!
While we have clients all over the world, we were actually surprised by just how evenly spread the requests of the top 19 were.
Cache Performance Log Stats
Out of the total 13 billion log entries, we analyzed 5 billion cache performance logs. These stats give insights into how WordPress sites are actually performing in terms of whether a site is serving from cache or not. Remember, in general, you want your site to serve as much of its content from cache as possible. This is what will ensure you receive lightning-fast load times!
Membership and eCommerce sites are known for a lot of uncacheable content, and this is exactly why you can’t treat these types of sites the same way you do say a blog with a lot of static content. Check out our in-depth post on the do’s and don’ts for hosting WordPress membership sites.
Cache Stats
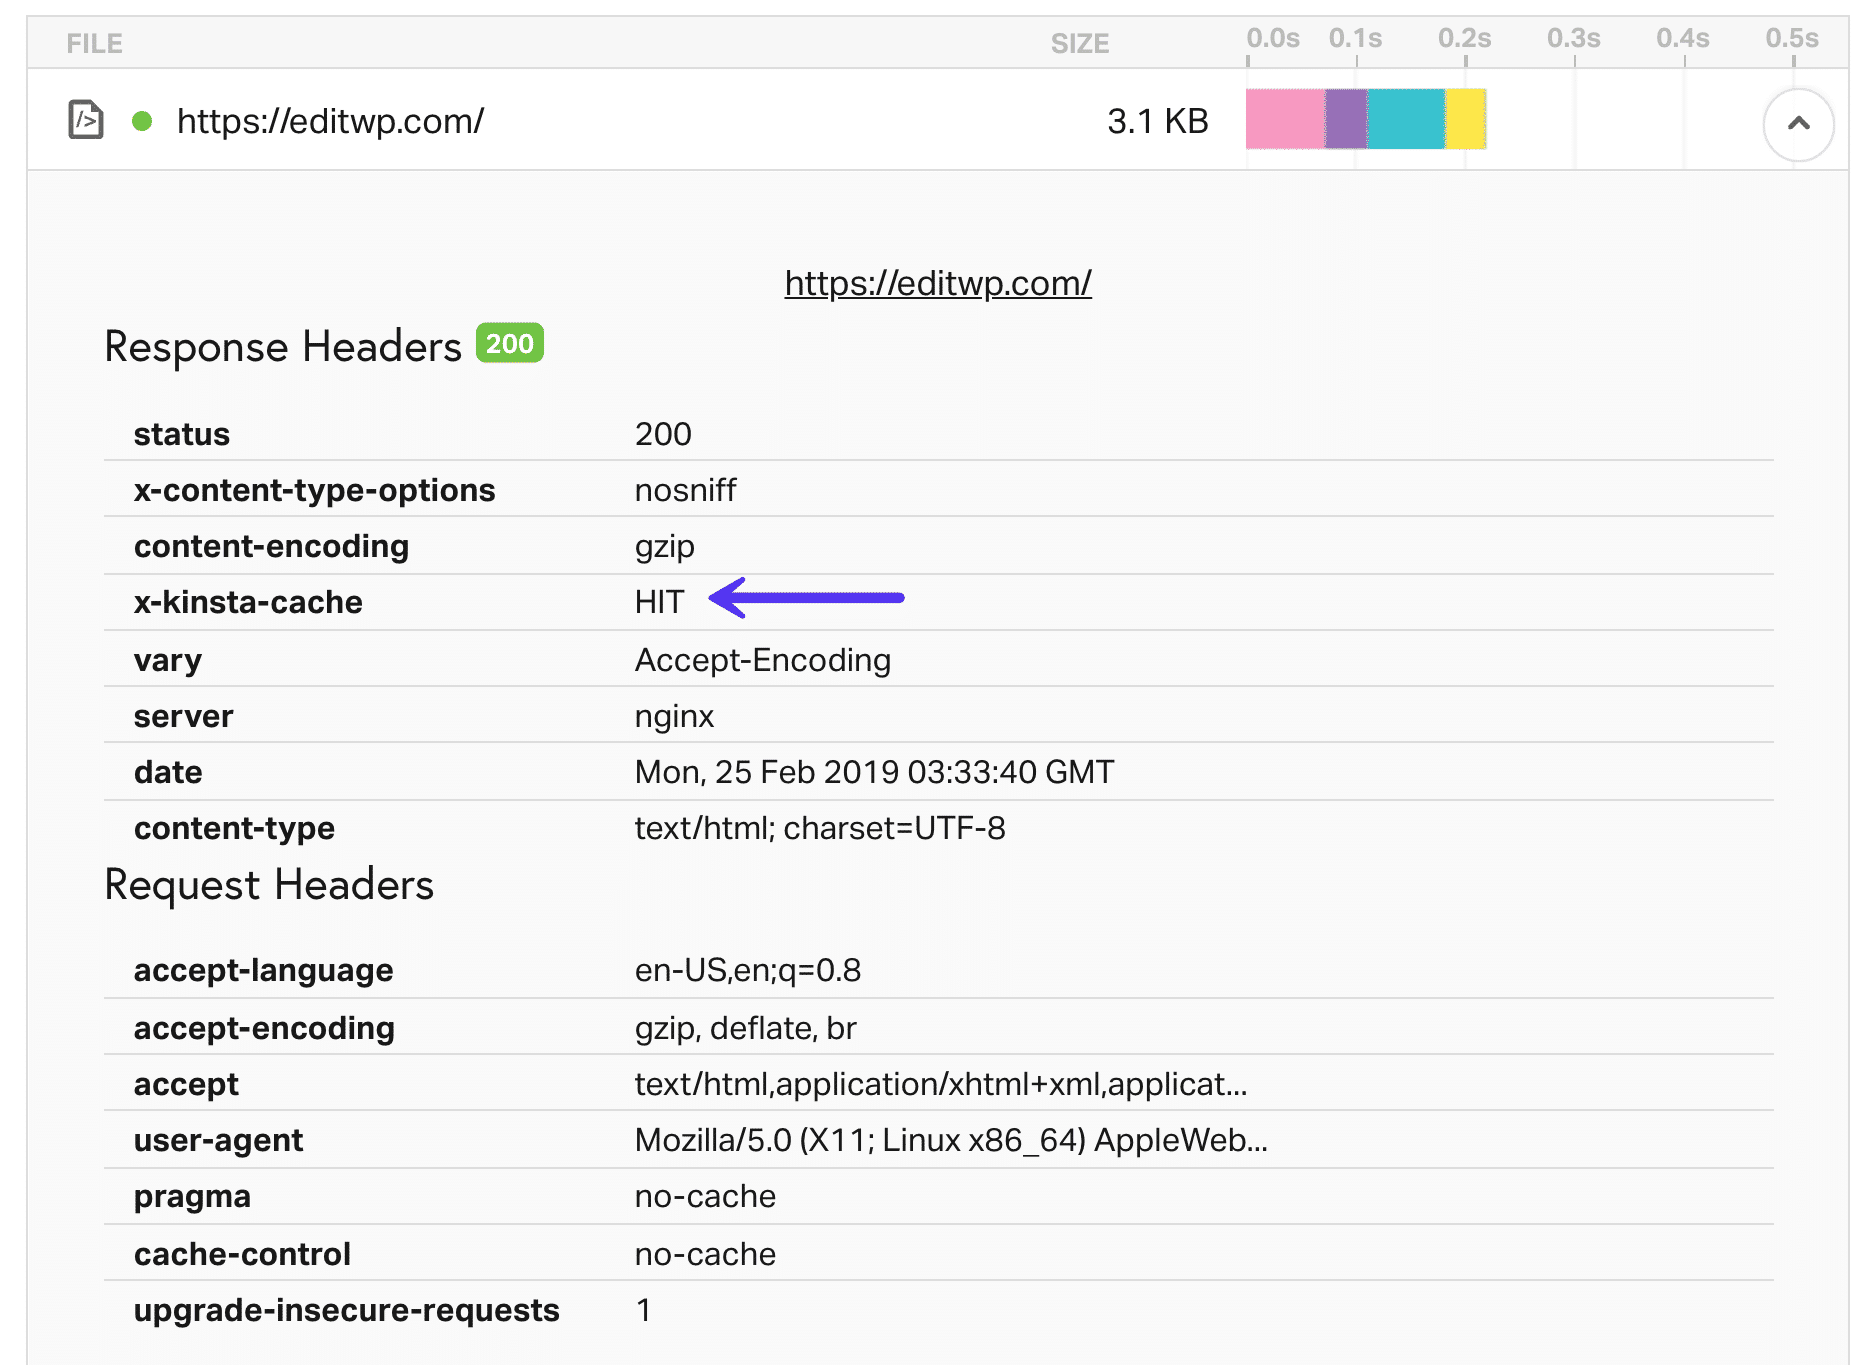
Whenever a site at Kinsta is delivered to a browser, it contains a x-kinsta-cache response header to display the status of how the cache was delivered. You can see this with a tool like Pingdom or Chrome DevTools. A “HIT” means the request is being served from WordPress cache. This is typically what you want to see.
So we pulled all the data to see the status of how cache was being delivered across the board.
- 1,795,217,266 Desktop requests had a response header of HIT
- 1,070,119,048 Desktop requests had a response header of BYPASS
- 457,393,894 Desktop requests had a response header of MISS
- 118,778,823 Desktop requests had a response header of EXPIRED
- 522,774 Desktop requests had a response header of STALE
- 404,497,162 Mobile requests had a response header of HIT
- 128,540,590 requests had a response header of BYPASS
- 120,687,202 requests had a response header of MISS
- 41,951,398 requests had a response header of EXPIRED
- 93,680 requests had a response header of STALE
The results were exactly what we wanted them to be and what they should be. The highest number of requests by a mile were all serving from cache (HIT response), with over 1.7 billion. This is great! The second highest was BYPASS. These requests usually include a WordPress login page, a check out page on an Ecommerce site, etc. There are certain areas of WordPress sites that aren’t cached on purpose to ensure functionality.
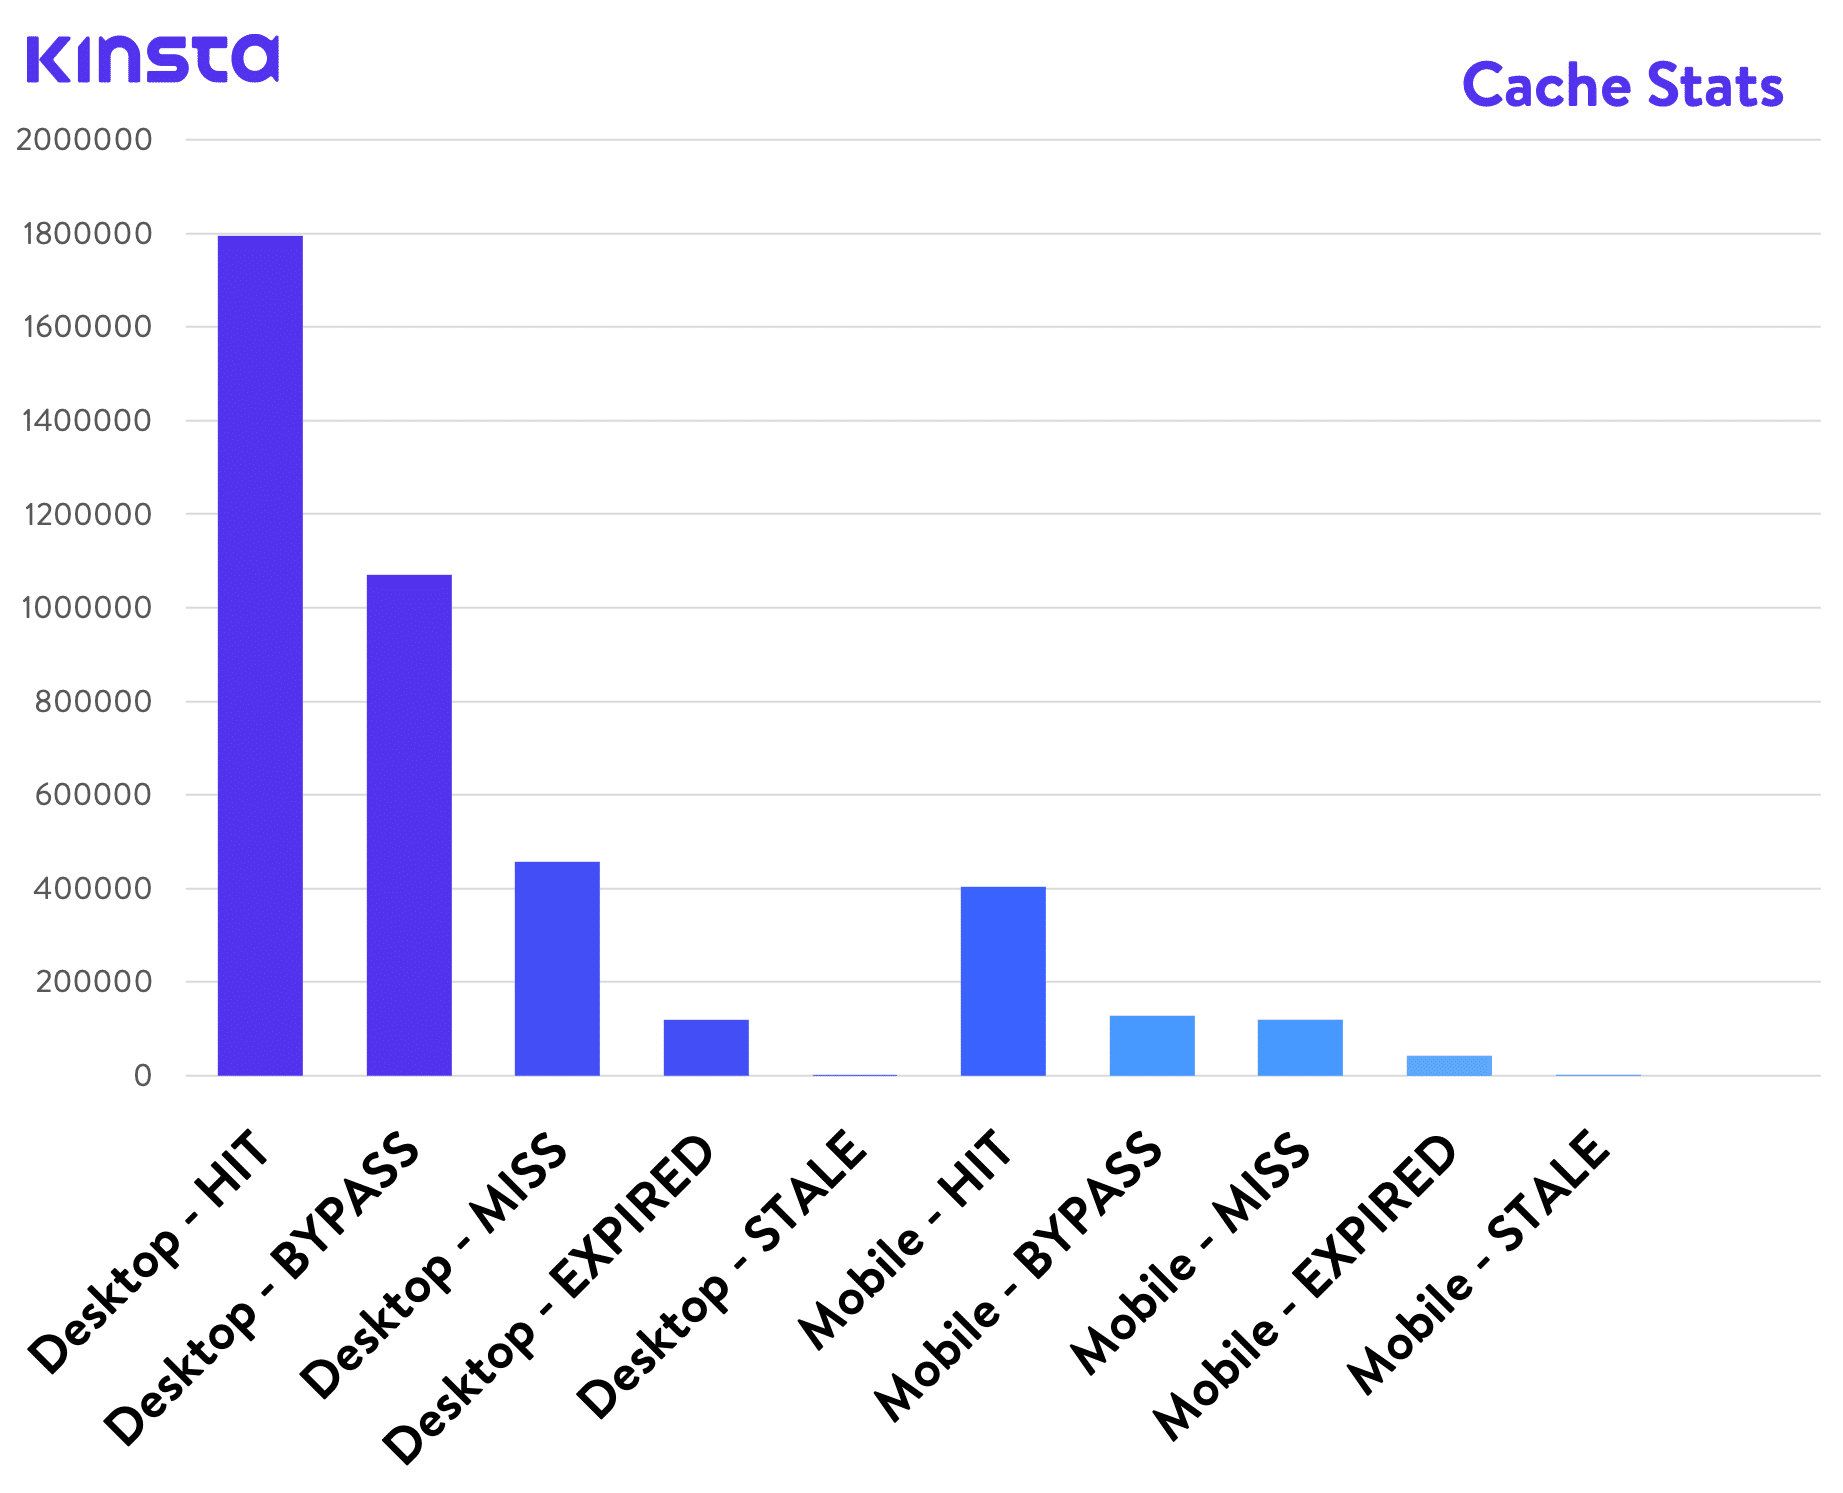
A MISS means that the website cache simply isn’t there yet. For example, when you clear your cache on your site, the cache has to rebuild. This happens when a visitor hits the page or post again for the first time. The subsequent visits after that are then served from cache, registering a HIT.
The mobile version pretty much followed the exact same pattern across the board.
Cookie Categories
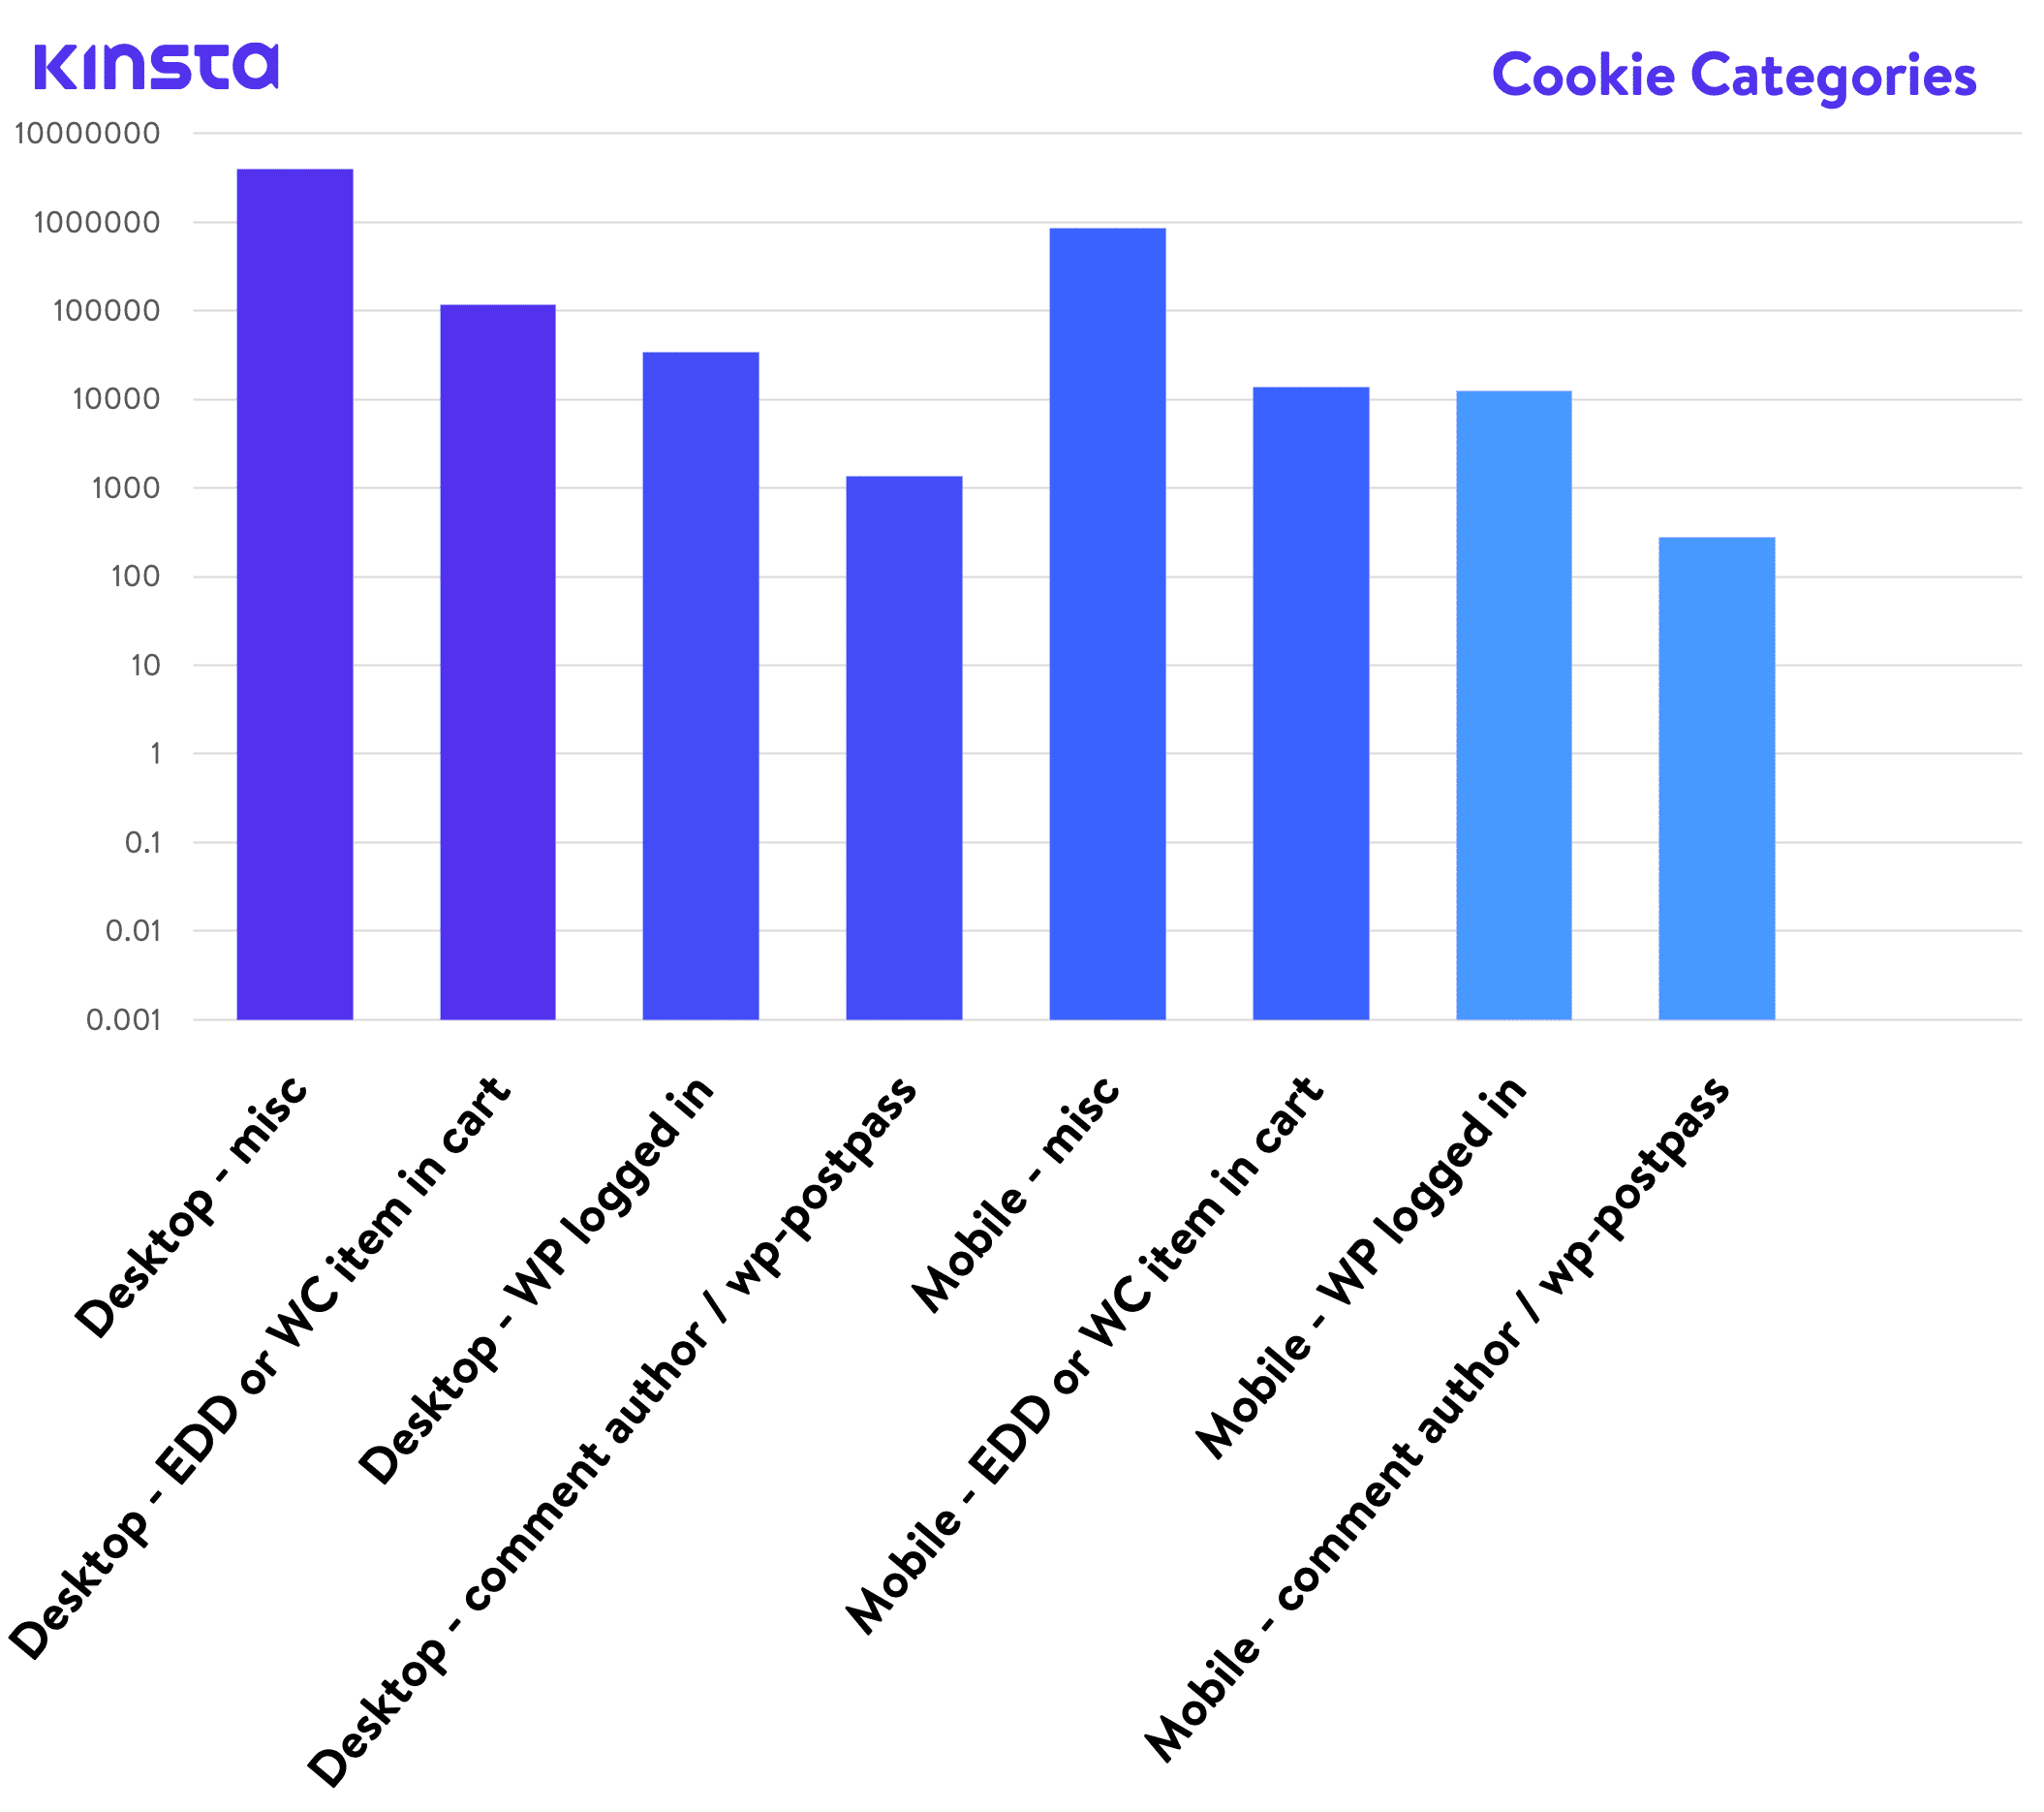
Have you ever wondered how a host determines which areas of a site shouldn’t be cached? The answer in a lot of cases is cookies. 🍪
For example, on WooCommerce and Easy Digital Download sites, cookies such as woocommerce_items_in_cart cookie and edd_items_in_cart are placed in a user’s browser when they add an item to their cart. When these cookies are detected on the Kinsta platform, the cache is automatically bypassed to ensure a smooth and in-sync checkout process. There are different kinds of cookies that are used to bypass cache, below are a couple we queried.
- 3,953,049,476 Desktop requests contained misc cookie
- 117,848,189 Desktop requests contained EDD or WC item in cart cookie
- 34,179,376 Desktop requests contained WP logged in cookie
- 1,353,672 Desktop requests contained comment author / wp-postpass cookie
- 862,200,418 Mobile requests contained misc cookie
- 13,772,183 Mobile requests contained EDD or WC item in cart cookie
- 12,579,820 Mobile requests contained WP logged in cookie
- 274,747 Mobile requests contained comment author / wp-postpass cookie
The number one type of request, with over 3.9 billion, were those from a misc cookie. What does this mean? Usually, this is a third-party plugin that contains their own named cookie to bypass cache.
One thing that is interesting is that there are more EDD/WC cart cookies than actual logged in cookies. This is most likely due to the fact that a lot of the WordPress sites we host at Kinsta are eCommerce in nature. Also, most of you probably don’t login into your WordPress site that often (you are probably already logged in for most of the day). But there are always customers shopping!
PHP Engine
According to the official WordPress Stats page, over 57% of WordPress users are still on PHP 5.6 or lower. This is scary! Not only is it bad from a security perspective, but also because there is still a large portion of WordPress sites that aren’t taking advantage of the additional performance enhancements with PHP 7.
We thought it would also be interesting to see the distribution of PHP versions that are being used at Kinsta. Here’s what we found.
If we look at the sites running at Kinsta, over 75% of WordPress sites are using PHP 7.2 or higher. These are the stats we love seeing. 👏
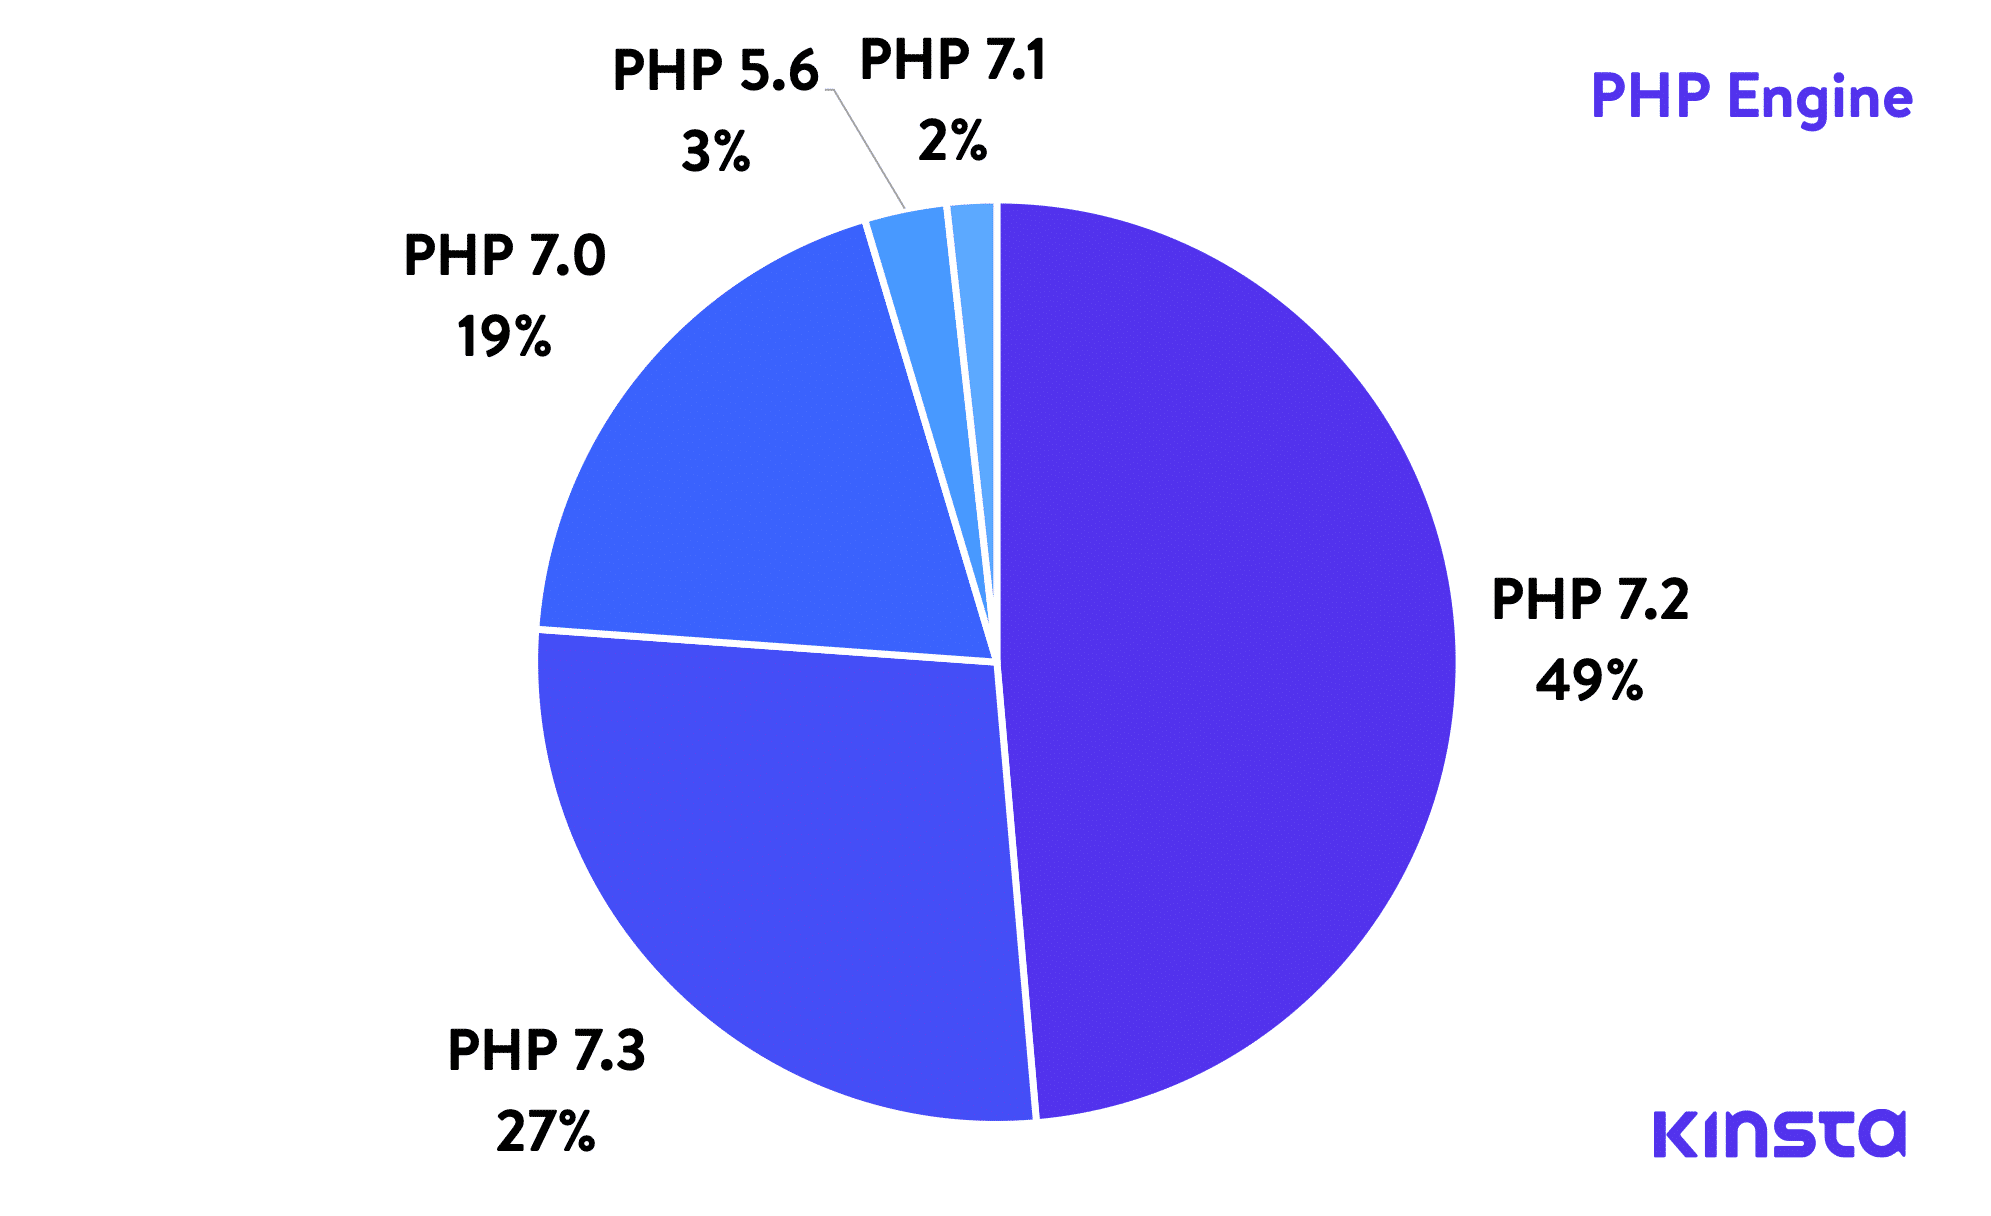
From our findings (see our PHP benchmarks), PHP 7.3 is on average 9% faster than PHP 7.2. And if you compare PHP 7.3 to PHP 5.6, it can handle almost 3x as many requests (transactions) per second!
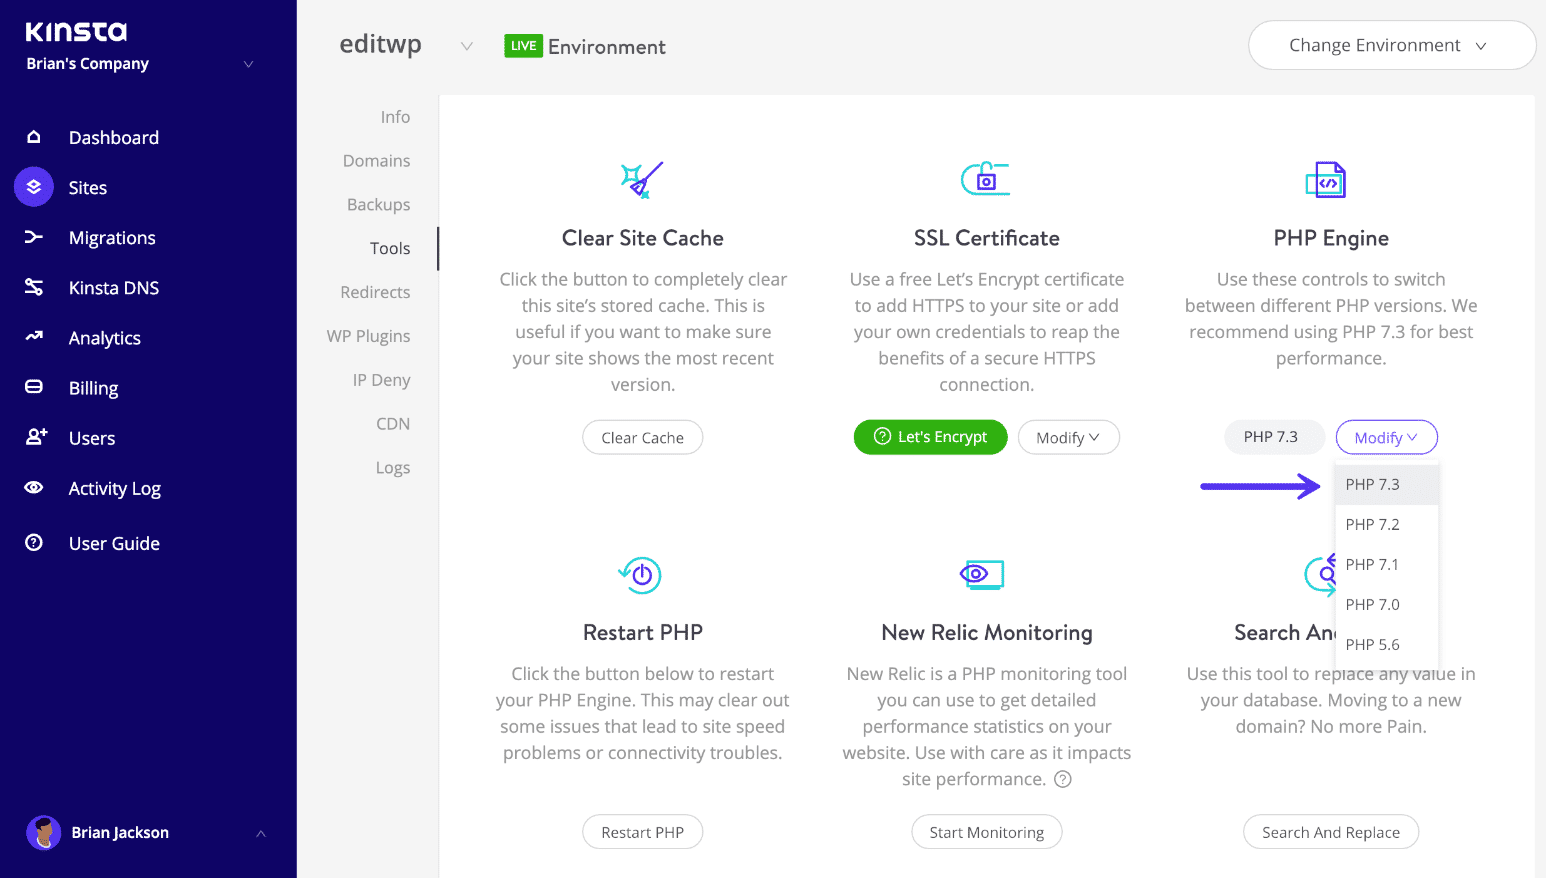
If you’re a Kinsta client, you can easily change PHP versions from within the MyKinsta dashboard, under Tools, with a single click.
Summary
From the above data we can conclude a few interesting things about sites hosted at Kinsta:
- Desktop browsers vs mobile are still very heavily used. Even though you may read online that mobile is taking over (which in a lot of places it is), it’s important to remember that this can vary a per industry or niche. Look at the data, don’t just assume that mobile is where all your customers are. We recommend looking at your Google Analytics mobile device data to see where your eCommerce transactions and goals are happening.
- Bots, APIs, and search engine crawlers make up 19% of all requests. The number of bots and crawlers hitting your WordPress sites on a daily basis is scary! 1.5 billion requests from these is no small number. The good news is that if you’re a Kinsta client, we do our best to filter these and make sure they aren’t counted against your billable visits.
- The Microsoft Edge browser is being used more than we thought. And with them moving to it being Chromium-based as well as offering a Mac version, you can probably expect the market share on this browser to rise.
- A lot of people are using iPhones! The mobile version of Safari was the most highly used browser amongst mobile devices.
- Windows 98 is still kicking strong somewhere. While the
user-agentcan be spoofed, it can be hard to know for sure how accurate this is. But most likely there are some corporations or developing countries still using Windows 98. - The force is strong with HTTPS at Kinsta! We were more than excited to see that 87% of all Kinsta sites are running over HTTPS. Go Let’s Encrypt! 👏
- It’s 2019, there’s no need for www anymore. While there are a few benefits to having www, most of them won’t apply for the general user or business. Therefore, let’s move to shorter URLs!
- Facebook traffic is a behemoth. However, if you have a business that might work on Pinterest, this is definitely a network to check out.
- 301 redirects and 404 errors (broken links) are everywhere. This is not really surprising, but it’s an important reminder to fix your broken links and don’t forget to use 301 redirects for SEO purposes.
- 500 errors will happen, it’s the joys of using WordPress. Many times these are from a bad plugin, faulty PHP, or a broken connection to the database.
- While Google is the King, Bing is the crawler Queen. Bing probably crawls your site a lot more than you think.
- JavaScript is the most served file, but it’s awesome to see WebP slowly on the rise.
- SEO tools crawl your sites daily. How else do you think SEMrush and Ahrefs get all that fancy backlink data? They do it by continuously crawling your sites.
- Over 75% of Kinsta clients are taking advantage of PHP 7.2 and PHP 7.3. Using a newer version of PHP is one of the easiest performance optimizations you can make!
We hope you enjoyed all these stats! We sure did. If you’re curious, we used good ole’ Microsoft Excel to generate all of the charts above.

Brian has a huge passion for WordPress, has been using it for over a decade, and even develops a couple of premium plugins. Brian enjoys blogging, movies, and hiking. Connect with Brian on Twitter.

