
Today we want to dive into how to better use and understand the data from the popular website speed test tool Pingdom. You can use it to do a waterfall analysis of your WordPress website. This can help you quickly diagnose performance issues and not misdiagnose a problem.
Often, we see WordPress users interpreting the data wrong in the Pingdom speed test tool, which sometimes leads to configuring a website to a state even worse than before. Remember that all tools like this are to be used as guides. They are never 100% accurate. The important thing is to be consistent and use the same tool throughout all your tests.
What Is Pingdom Speed Test Tool?
Pingdom is a company based out of Sweden (now owned by SolarWinds) that offers various services, such as uptime monitoring, page speed monitoring, transaction monitoring, server monitoring, and visitor insights (RUM). One of the things they are most well known for is their free website speed test tool. It is one of the most popular performance testing tools in the WordPress community.
Why is it so popular? Well, for one, it’s probably the easiest speed testing tool to use! Not everyone is a web performance expert, so some of the other alternative tools out there can be quite overwhelming for the typical WordPress user. Sometimes less is more, as they say. After all, you just care about how fast your website is and how you can make it faster.
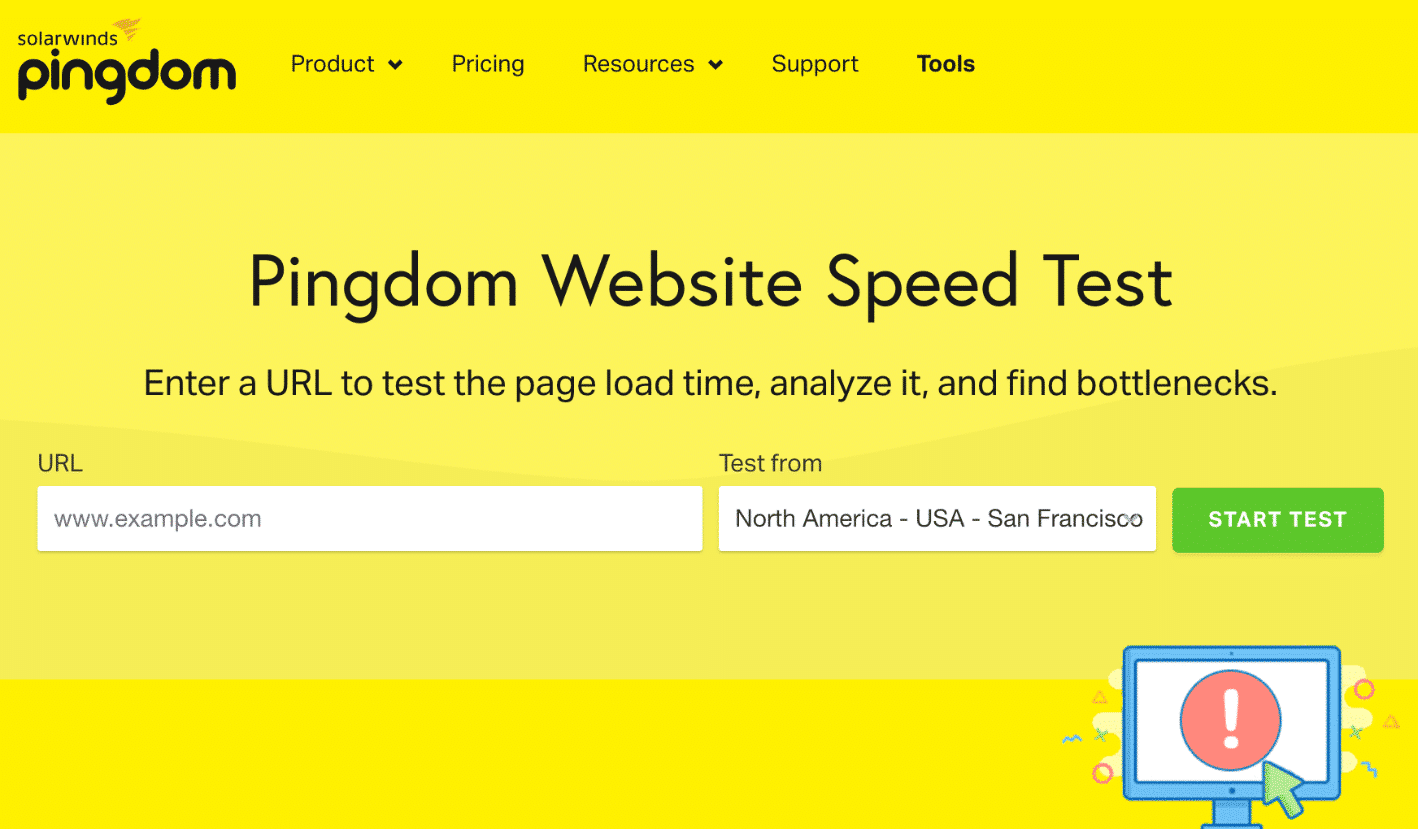
Pingdom currently allows you to test the speed of any website from 7 different locations (5 continents) strategically placed around the globe:
- Asia – Japan – Tokyo
- Europe – Germany – Frankfurt
- Europe – United Kingdom – London
- North America – USA – Washington D.C.
- North America – USA – San Fransisco
- Pacific – Australia – Sydney
- South America – Brazil – São Paulo
Note: We’ve noticed that occasionally not all the test locations will be available. This is most likely because it has gone down for maintenance, or it got overloaded with too many people trying to run tests on it. If a test site location you’ve been using is no longer there, check back in an hour or two. Most likely, it will reappear.
The testing location you choose is critical to the physical location of where your website is hosted. This is where a little thing called network latency comes into play. But we’ll get into this in more detail below.
Waterfall Analysis with the Pingdom Speed Test Tool
A web page comprises different assets, such as HTML, JavaScript, CSS, images, and videos. Each of these generates requests to render what you see on your website. Typically the more requests you have, the slower your website will load. That is not always the case, but it is true most of the time.
Below, we will break up each Pingdom section and explain in more detail what the information means as it pertains to the overall performance of your website and how to do a waterfall analysis.
- Pingdom Summary
- Performance Insights
- Response Codes
- Content size and requests by content type
- Content size and requests by domain
- Waterfall Chart
- Case Study Domain Configuration
Pingdom Summary
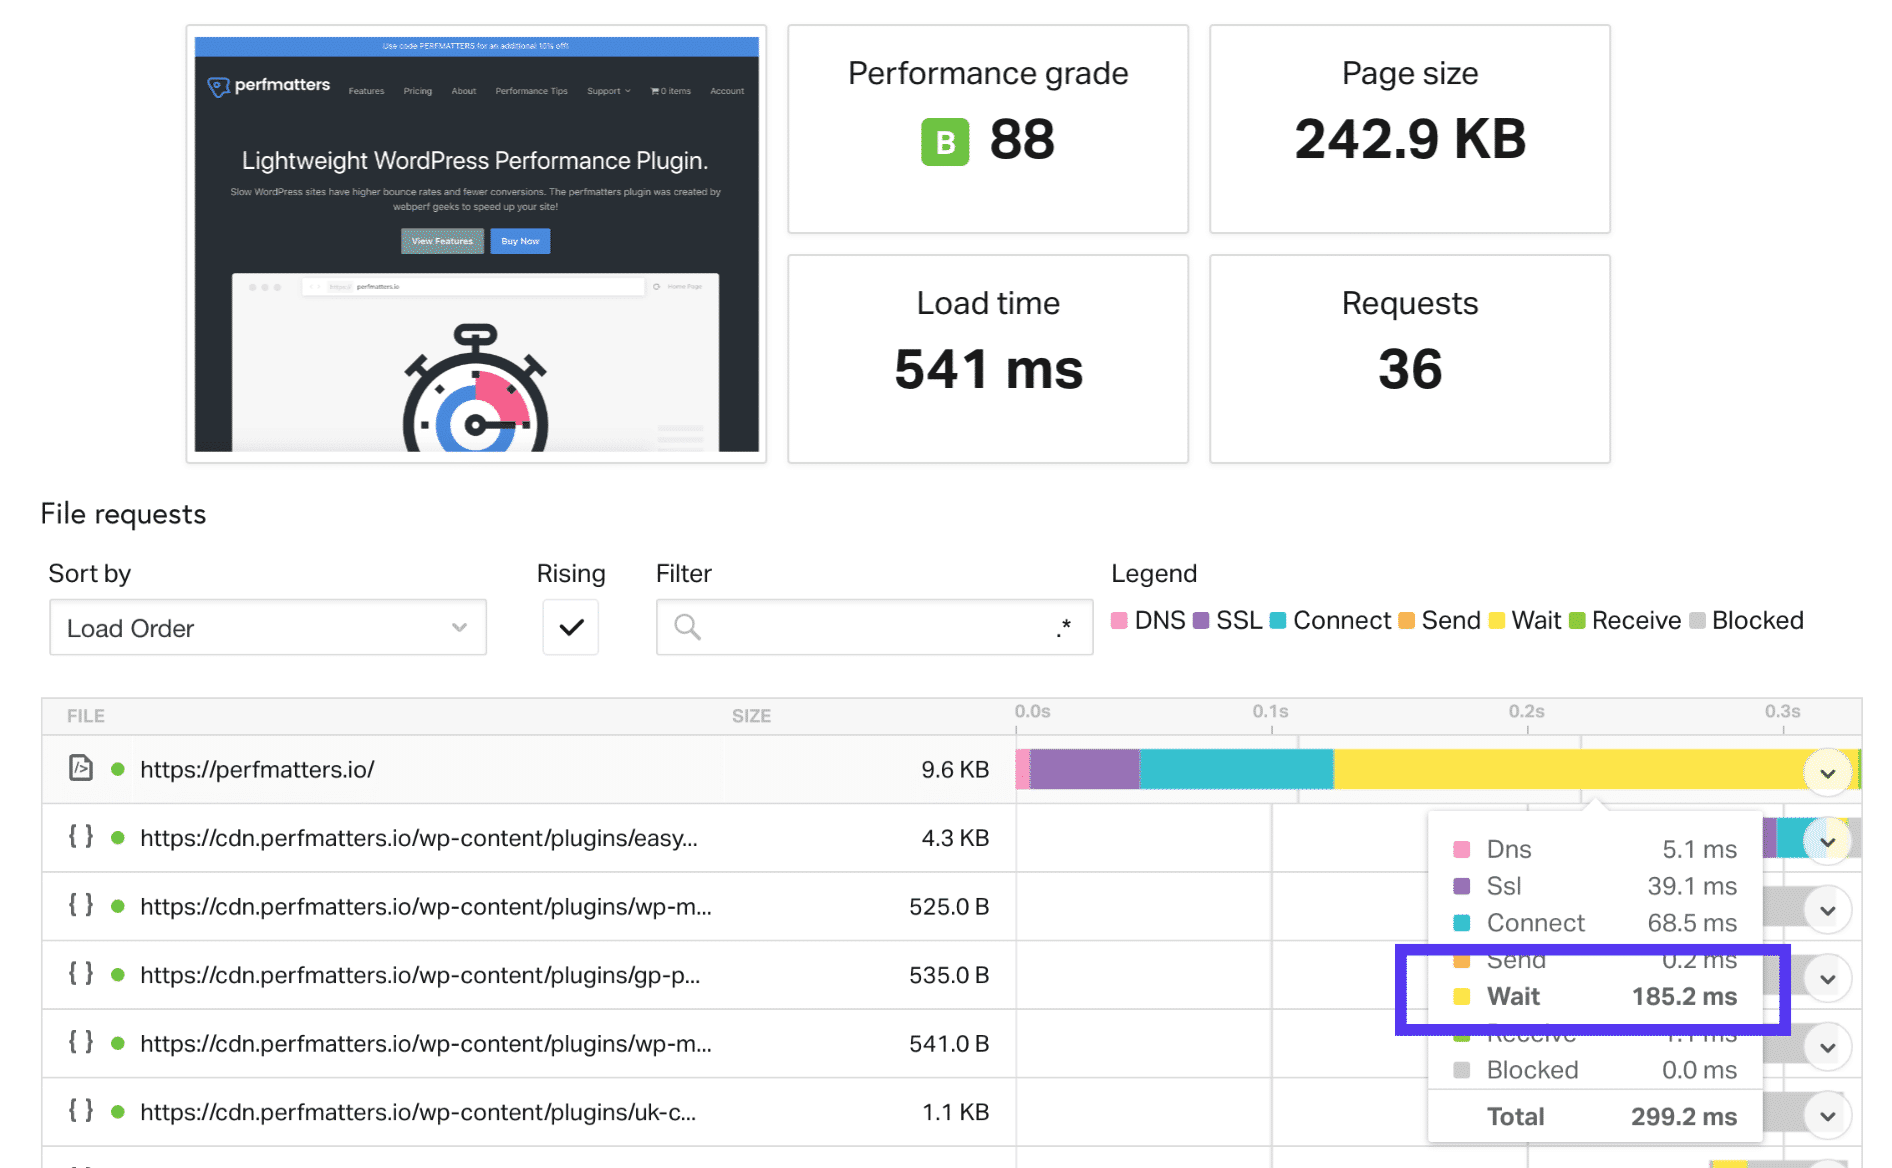
When you run your WordPress website through Pingdom, it generates a performance grade, a total load time, the total page size, and the number of requests you have on your website. In our example, it’s an ecommerce site running Easy Digital Downloads. It’s hosted on Kinsta’s blazing fast servers.
As you can see, we ran our first test and scored an 88/100 on Pingdom, and the total load time is 541 ms. It lets us know the total size of our combined assets and the number of requests.

We then ran an additional test, and now our total load time is 392 ms with the same page size and number of requests! What is that all about? 🤔 You might notice this if you run your website through the Pingdom speed test tool multiple times. Larger sites will notice even greater differences.
There are three main reasons this happens: DNS caching, CDN caching, and WordPress caching. This is why you should always run tests multiple times. Of course, external calls to third-party resources and APIs could also impact this. Find out why further below in our waterfall analysis.

Want to get a better Pingdom score on your WordPress website? Depending on your site and configuration, it might not always be possible to score a perfect 100/100, especially for those running ecommerce sites and marketing pixels. But simply spending some time improving your score is an excellent place to start. The overall speed is really what’s important.
Sometimes the user experience might also trump some web performance tricks you read around the web. You can’t forget the user experience! But rest assured, we will share some tips and tricks further below on how we got the above site to where it is, so keep reading.
WinningWP independently conducted speed tests comparing Kinsta with other leading hosting providers and found that Kinsta was “much faster”, with an average time of just 394 ms.
Improve Page Performance
The performance insights section, now “Improve page performance” was updated in 2018, and they have removed some old items and added new ones. This is most likely because some of the suggestions they were reporting are no longer as relevant as they used to be. When it comes to web performance optimizations, things are constantly changing. And it can be sometimes troublesome if people are simply trying to chase after the perfect Pingdom score.

However, we leave this entire section in our post (some old and new) because it’s essential to understand how these scores are calculated. These are essentially all based on the Google PageSpeed Insight rules. Generally, if you improve these on your site, you should decrease your overall load times.
Here are a few of the categories from the improve page performance section:
- Use a Content Delivery Network (CDN)
- Avoid HTTP 404 (Not Found) error
- Minimize Redirects
- Add Expires Headers
- Remove Query Strings From Static Resources
- Use Cookie-Free Domains
- Parallelize Downloads Across Hostnames
- Specify a Cache Validator
- Specify a Vary: Accept-Encoding header
Now let’s dive into some of these and see which ones are still relevant today.
Use a Content Delivery Network (CDN)
One of the most critical services to implement on your WordPress site today is a Content Delivery Network (CDN). These are a network of servers (also known as POPs) located around the globe. They are designed to host and deliver copies of your WordPress site’s static (and sometimes dynamic) content, such as images, CSS, JavaScript, and video streams.
If you’re a Kinsta client, we include a CDN on our hosting plans. Enabling it takes a few clicks. A few benefits from a CDN include a performance boost (lower TTFB and network latency), lower bandwidth and hosting costs, and even SEO advantages.
Important: The newly updated Pingdom tool currently has a bug correctly detecting any CDN provider accurately.

Some third-party CDN providers we recommend include:
- KeyCDN (this is what powers the Kinsta CDN)
- Cloudflare
- CDN77
In our own CDN speed tests, we’ve found that a CDN can decrease page load times by over 50% in some cases!
Avoid HTTP 404 (Not Found) Error
This section was previously called “avoid bad requests.” And this is always relevant! This warning is just like it sounds, it’s a request that could not be completed successfully. This typically happens you manually link to an asset or image which has since been deleted, resulting in a 404 error. This shows up as an orange circle in Pingdom, along with a 404 on the response header status.

Always make sure every request on your site returns with a success status. This will ensure there aren’t any queries generated to assets that no longer exist.
Minimize Redirects
Too many redirects are always something you need to watch out for. Simple redirects like a single 301 redirect, HTTP to HTTPS, or www to non-www (vice versa) are acceptable. And a lot of times, these are needed in some regions of your website. However, each has a cost on your site’s performance. And if you start stacking redirects on top of each other, it’s essential to realize how they impact your site’s performance. This applies to page and post redirects, image redirects, everything.
A redirect shows up as a blue circle in Pingdom, along with a 301 or 302 on the response header status.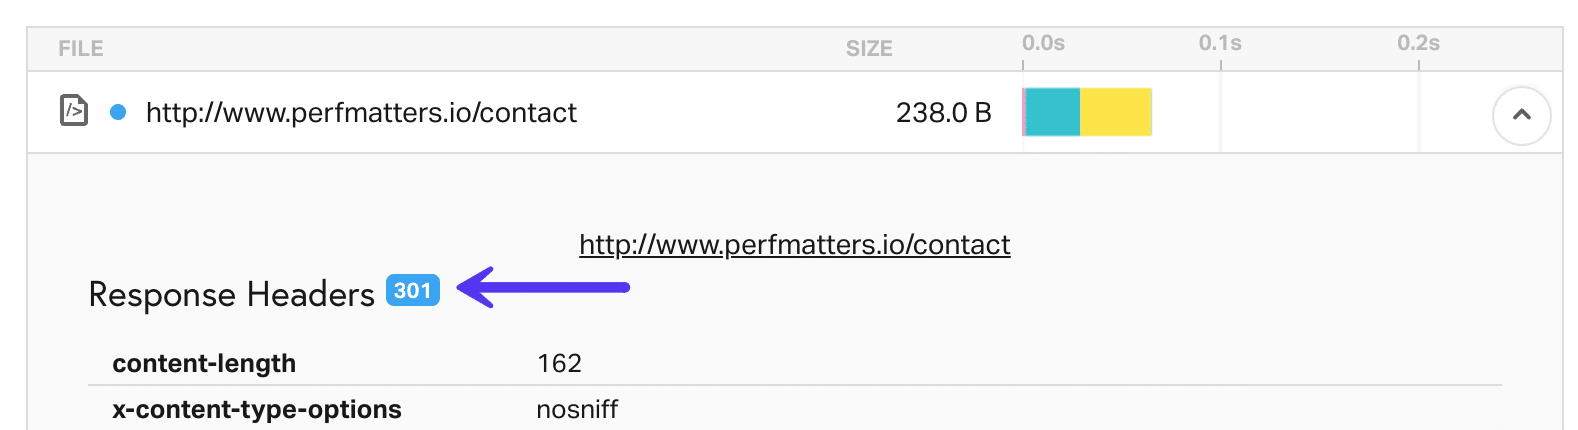
How much do redirects impact your site? Let’s do a little test. First, we run a speed test on our contact us page. We get a total load time of 417 ms, as you can see below.

We then modify the URL slightly and run another speed test to see the impact of multiple redirects. As you can see, the same page now takes 695 ms to load. That’s an increase of 66%. Yikes!

Check out our in-depth post on WordPress redirects, and the best practices for faster performance.
Add Expires Headers
This suggestion was previously called leverage browser caching. In simple terms, every script on your WordPress site needs to have an HTTP cache header attached to it (or it should). This determines when the cache on the file expires. To fix this, ensure your WordPress host has the proper cache-control headers and expires headers setup. Kinsta has these headers in place on all of our servers.
Check out the steps on adding caching headers to your server manually and read our guide on how to add expires headers.

The other issue is that you don’t have access to add the caching headers when you’re loading third-party scripts, as you don’t have any control of their web servers. Common culprits include the Google Analytics script and marketing pixels, like Facebook and Twitter. To fix this, you can host your Google Analytics script locally (although this isn’t officially supported) with a third-party plugin. WP Rocket also now has an option to host your Facebook marketing pixel locally.
Moving scripts locally can vary in how much it impacts your site’s performance. The one advantage is that you have complete control over the file and can serve it from your CDN. This also removes another third-party DNS request. However, it’s also important to remember that these files might already be cached in people’s browsers.
See our in-depth post on how to fix the leverage browser caching warning.
Remove Query Strings From Static Resources
Another common issue is dealing with query strings. Your CSS and JavaScript files usually have the file version on the end of their URLs, such as https://domain.com/file.min.css?ver=4.5.3. Some servers and proxy servers are unable to cache query strings. So by removing them, you can sometimes improve your caching.
Or you can add the following code manually to your theme’s functions.php file. A better alternative would be to use a free plugin like Code Snippets to add the code. This way, you don’t have to edit your theme directly.
function remove_query_strings() {
   if(!is_admin()) {
       add_filter('script_loader_src', 'remove_query_strings_split', 15);
       add_filter('style_loader_src', 'remove_query_strings_split', 15);
   }
}

function remove_query_strings_split($src){
   $output = preg_split("/(&ver|\?ver)/", $src);
   return $output[0];
}
add_action('init', 'remove_query_strings');
However, before you immediately strip out query strings on your site, it’s important to know why they are used. WordPress developers typically use versioning on files to get around caching problems.
For example, if they push out an update and change style.css from ?ver=4.6 to ?ver=4.7, it will be treated as a completely new URL and won’t be cached. If you remove the query strings and update a plugin, this could result in the cached version continuing to continue serving. In some cases, this could break the appearance of your site until the cached resource expires or the cache is completely flushed.
Also, some CDNs can cache query strings. The Kinsta CDN can and does by default. So if you’re a Kinsta client, query strings are already cached on your assets.

See our in-depth tutorial on how to remove query strings from static resources.
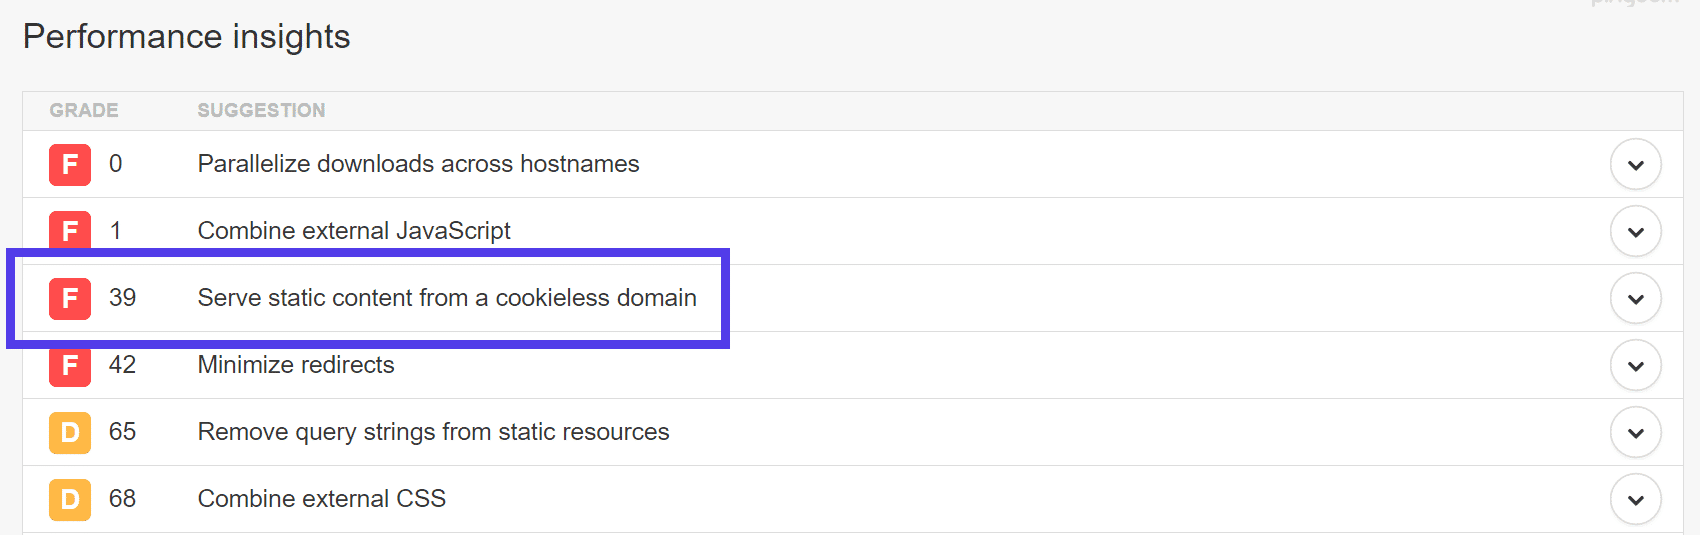
Use Cookie-Free Domains
We have an in-depth post on dealing with the serve static content from a cookieless domain warning. Often, you can ignore this warning as new protocols such as HTTP/2 now make this less important. A new connection is usually costlier than streaming everything over the same connection. However, two ways to solve this are using a CDN provider that strips out the cookies or creating a separate domain or subdomain.
For more information, check out our post on how to use cookie-free domains.
Compress Components with GZIP
The “Compress Components with GZIP” warning occurs when Pingdom detects an asset that hasn’t been compressed with GZIP. GZIP is a compression method used to reduce the size of text-based files like HTML documents and CSS/JS files. GZIP compression is enabled on the server and compresses web pages and assets before sending them to visitors. From our tests, we saw that enabling GZIP compression reduced the file size of a request by over 78%.

At Kinsta, you won’t have to worry about enabling GZIP because every Kinsta site already benefits from Brotli compression, a faster alternative to GZIP compression. It’s all thanks to our unique Cloudflare integration. This means your Kinsta-hosted site is faster than the competition using GZIP and loads rapidly for those on smaller devices.
If you still see the “Compress Components with GZIP” after enabling GZIP on your server, it’s possible that a server hosting an external asset required by your site does not have GZIP or Brotli compression enabled. If that’s the case, there isn’t anything you can do on your end to change the server behavior.
Parallelize Downloads Across Hostnames
The “Parallelize Downloads Across Hostnames” warning results from a limitation of HTTP/1.1 and web browsers being limited to the number of concurrent connections they can make to a host; typically, it’s six connections. This warning is typically seen on websites with a large number of requests. In the past, the only way to get around this limitation is to implement what they call domain sharding.
However, suppose you use a web host or CDN provider that supports HTTP/2. In that case, you can safely ignore this now as multiple resources can now be loaded in parallel over a single connection. But you can also check out our tutorial on how to fix the parallelized downloads across hostnames warning by implementing domain sharding.

Specify a Cache Validator
This warning refers to missing HTTP caching headers which should be included on every origin server response, as they both validate and set the length of the cache. If the headers aren’t found, it will generate a new request for the resource every time, increasing your server’s load. These headers include last-modified, ETag, Cache-Control, and Expires. Like with the leverage browser caching warning, your WordPress host should automatically add these headers. If you have third-party requests you are seeing this on, there is nothing you can do as you don’t have control over their web servers.

Read our in-depth post on how to fix the specify a cache validator warning.
Specify a Vary: Accept-Encoding Header
We have an in-depth post on fixing the Specify a Vary: Accept-Encoding header warning. This is an HTTP header and should be included on every origin server response, as it tells the browser whether or not the client can handle compressed versions of the content. This is automatically added to all Kinsta’s servers.

Pingdom Response Codes
The following section in the Pingdom speed test tool is the response codes. Response codes also referred to as HTTP status codes are like a short note from the web server that gets tacked onto the top of a web page. It’s a message from the web server letting you know how things went when the request to view the page was received. Some common ones are:
- 200: “Everything is OK.” This is the code delivered when a web page or resource acts exactly the way it’s expected to.

Example of Pingdom 200 response code - 301: “The requested resource has been moved permanently.” This code is delivered when a web page or resource has been permanently replaced with a different resource. It is used for permanent URL redirection.

Example of Pingdom 301 response code - 404: “The requested resource was not found.” The most common error message of them all. This code means that the requested resource does not exist, and the server does not know if it exists.

Example of Pingdom 404 response code
You can read more about the different response codes in our in-depth post on HTTP status codes.
Content Size and Requests by Content Type
The following sections are the content size by content type and the requests by content type. Each of these is useful to quickly see what takes up the most resources on your web page. According to HTTP Archive, images generally make up 43% of an average web page’s total size. We also see this to be the case as well usually. However, as you can see below on this site, it is not always the case.
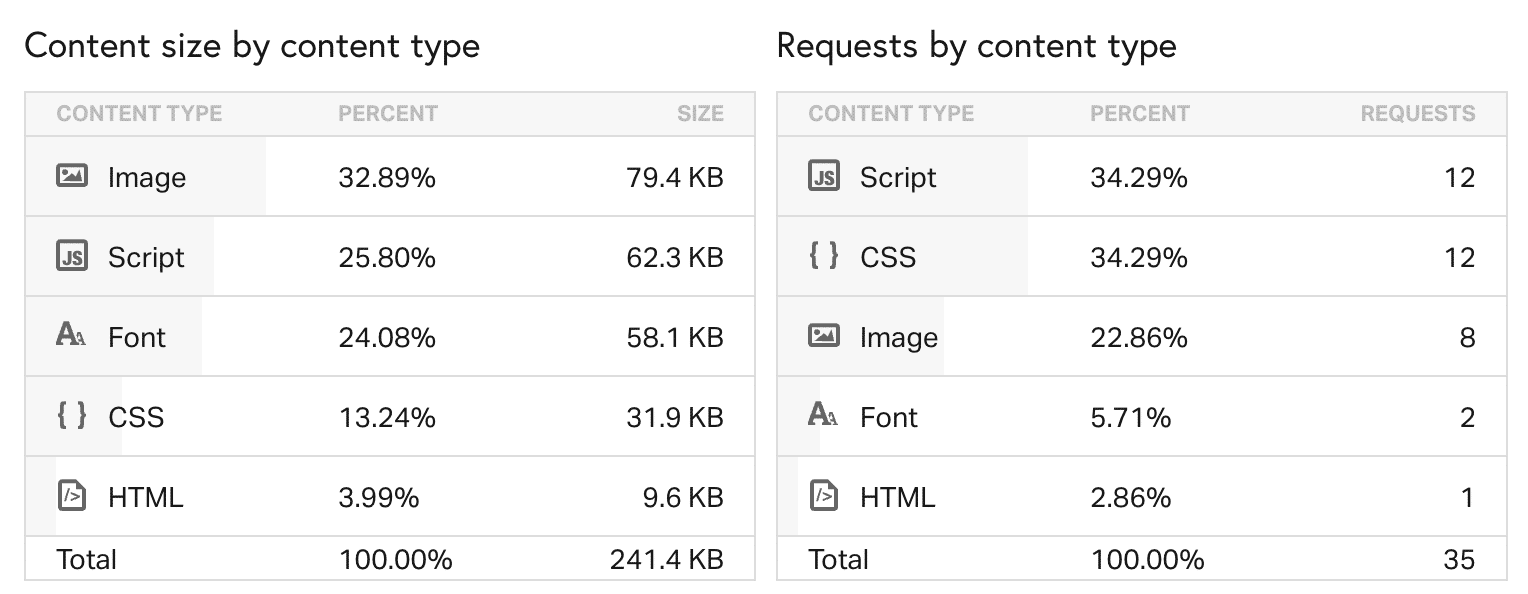
For optimizing your images, we highly recommend reading our in-depth post on how to optimize images for the web and about WebP. There are many great tools and plugins to compress your images further and ensure they aren’t the bulk of your website’s page load. And in our case above, the site is taking advantage of using large font awesome icons in place of images. This can be one great strategy that makes a huge difference. And of course, we have some additional tips in our page speed guide on how to decrease your content size further.
Content Size and Requests by Domain
The content size and requests by domain section is an excellent way to quickly see which external services and scripts are on your website. In our example, you can see that we have all of our assets loading from our CDN. Then there is the initial HTML DOC load for the website from the web server, and an external call to the Google Analytics domain. Depending upon your site, you might have more external services, such as Facebook, Twitter, Hotjar, SumoMe, AdRoll, New Relic, CrazyEgg, etc.

Generally, the fewer external requests you can make, the better because each external service introduces latency, TLS handshake delays, DNS lookups, etc. Make sure to read our in-depth post on identifying and analyzing external services on your WordPress site.
Generally, it’s best to reduce the number of requests as much as possible and host the assets in one place, such as moving them to your web server or CDN. One example would be font awesome. Instead of linking to the external script for font awesome, download it, and serve it up directly.
Pingdom Waterfall Chart
And last but not least, we have the Pingdom speed test tool requests section, which generates a waterfall chart of all the individual requests on your web page (as shown below). You can then analyze each request to see what is causing delays and performance issues on your site. We mean this when we say we are doing a waterfall analysis. Below is a more in-depth summary and or definition of what each status color means.
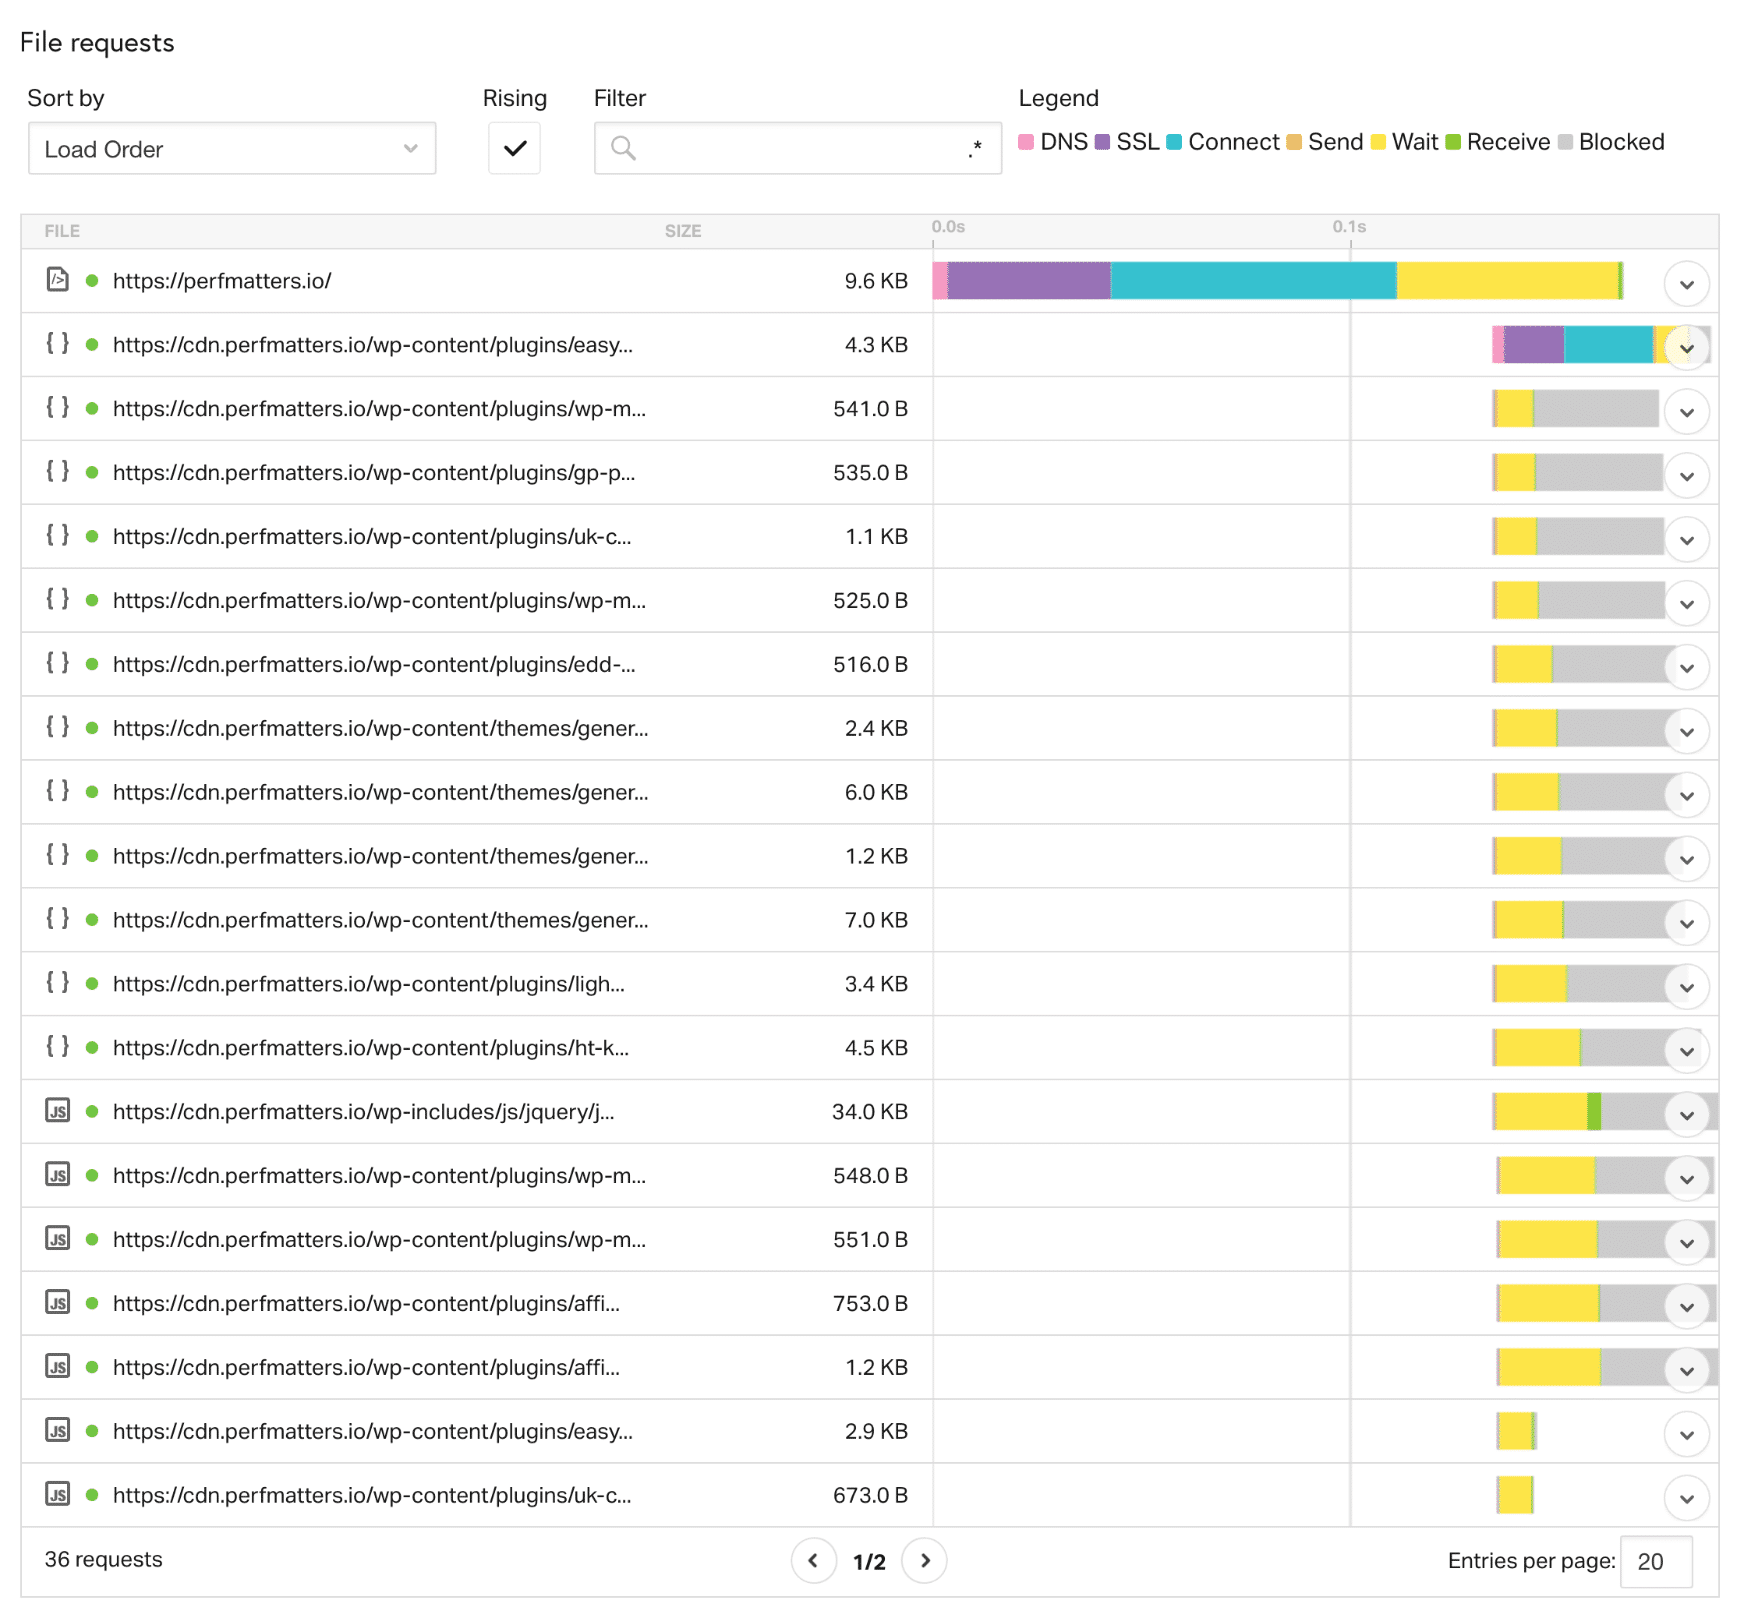
DNS (Pink)
So what is DNS? Well, think of it as a phone book. There are servers called Domain Name Servers which hold the information about your website and which IP it should be routed to. When you first run your website through Pingdom, it performs a fresh lookup, and it has to query the DNS records to get the IP information. This results in some additional lookup time. The location of the DNS server also matters.

When you run your website through Pingdom more than once, it caches the DNS because it already knows the IP information and doesn’t have to perform the lookup again. This is why your website appears faster after running it through Pingdom multiple times.
As you can see in the screen below, on the 2nd test we ran, the DNS lookup time on the initial DOC load was 3.6 ms. Typically it will drop to 0 ms as it should, as the request is already cached. This is one area a lot of people misinterpret!

Also, you can further optimize it by using a premium DNS service, plus it comes with a lot of extra benefits. Our Cloudflare’s free DNS is also fast! Check out Cloudflare’s Automatic Platform Optimization.
Other reasons why your website might appear faster after multiple tests. One of those is if you are using a content delivery network (CDN). For those not familiar with a CDN, it is a network of global servers that cache your content (JS, CSS, Images, etc.) in locations closer to the visitor. When you first run your website through Pingdom, you might have to grab the assets from the CDN fresh. A CDN cache works much like DNS. Once it is cached, it is much faster on consecutive loads.
Another tip on speeding up DNS is to use DNS prefetching. This allows the browser to perform DNS lookups on a page in the background. You can do so by adding some lines of code to the header of your WordPress site. See some examples below.
<!-- Prefetch DNS for external assets -->
 <link rel="dns-prefetch" href="//fonts.googleapis.com">
 <link rel="dns-prefetch" href="//www.google-analytics.com">
 <link rel="dns-prefetch" href="//cdn.domain.com">
Or, if you are running WordPress version 4.6 or newer, you might want to use resource hints. Developers can use the wp_resource_hints filter to add custom domains and URLs for dns-prefetch, preconnect, prefetch or prerender.
SSL (Purple)
The purple status color stands for your browser’s time to do an SSL/TLS handshake. Whenever you run a website over HTTPS, there is an SSL certificate and extra time involved due to the encryption process (SSL/TLS handshake). On our example domain, we have a certificate on both our web server at Kinsta and our CDN, KeyCDN. So there is an SSL negotiation time on both the initial HTML doc load from the web server and our assets.

While there is slight overhead to running HTTPS, it isn’t crucial now thanks to HTTP/2, a new protocol helping speed up the web! Due to browser support, HTTPS is required to utilize HTTP/2. Check out our ultimate guide to HTTP/2.
It’s also important to note that even in 2018, not all providers yet support HTTP/2. This includes both the web hosting side and the CDN side. So when you are shopping around for hosting and CDNs, make sure both support it! Kinsta is proud to support HTTP/2 for all of its WordPress clients.
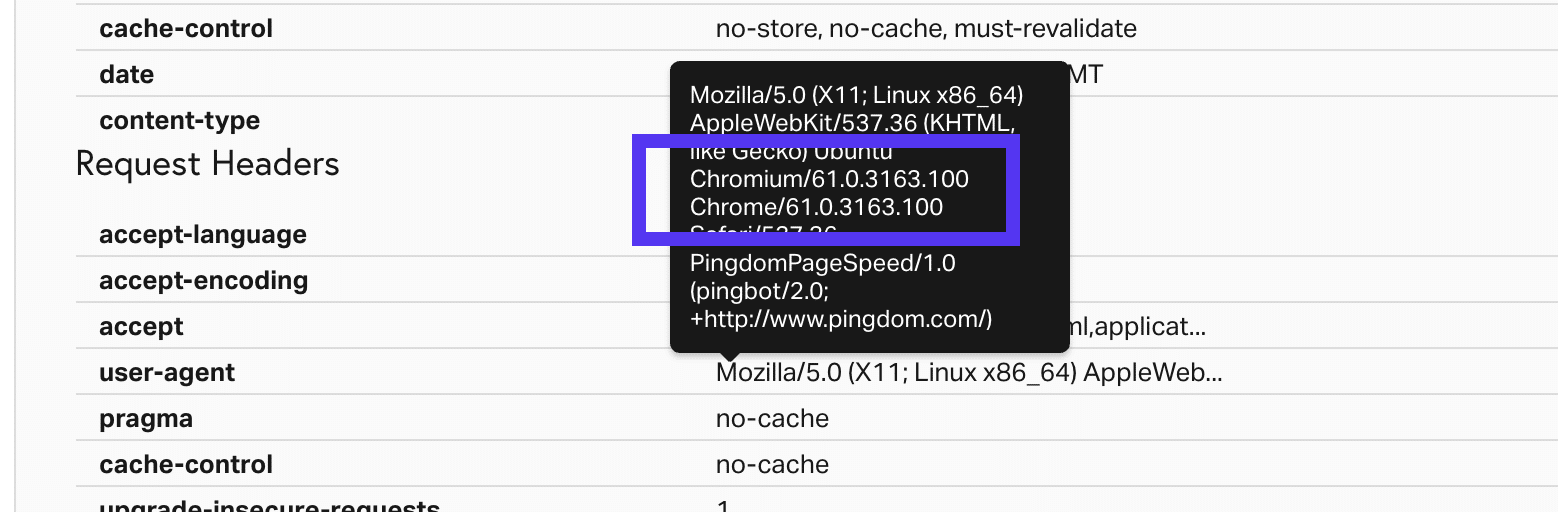
As of mid-2018, Pingdom finally upgraded its tool to use Chrome 60 and higher. You can see the user-agent being used in the request header. Previously they were using Chrome 39, and Chrome didn’t support HTTP/2 until version 49. So we are glad to say that the Pingdom tool now shows all the advantages of HTTP/2 when running tests! 👏
Connect (Teal)
The connect time in Pingdom refers to the TCP connection, or the total time required to create a TCP connection. You don’t need to understand how this works, but this is simply a communication method between the host/client and the server that has to take place.

Wait (Yellow)
Pingdom’s wait time refers to the time to first byte, also known as the TTFB in some tools. TTFB is a measurement used to indicate the responsiveness of a web server or other network resource. Generally, anything under 100 ms is acceptable and good TTFB. If you are approaching the 300-400 ms range, you might have something misconfigured on your server, or it might be time to upgrade to a better web stack.
The easiest way to decrease your TTFB? The two best ways are effective WordPress caching and a CDN. So let’s run a couple of tests.
TTFB Without WordPress Host Cache
We first ran a test after clearing the cache on our WordPress site. This means it has to preload the cache again. Our total load time was 541 ms, and the TTFB (wait time) on our initial request was 185.2 ms.
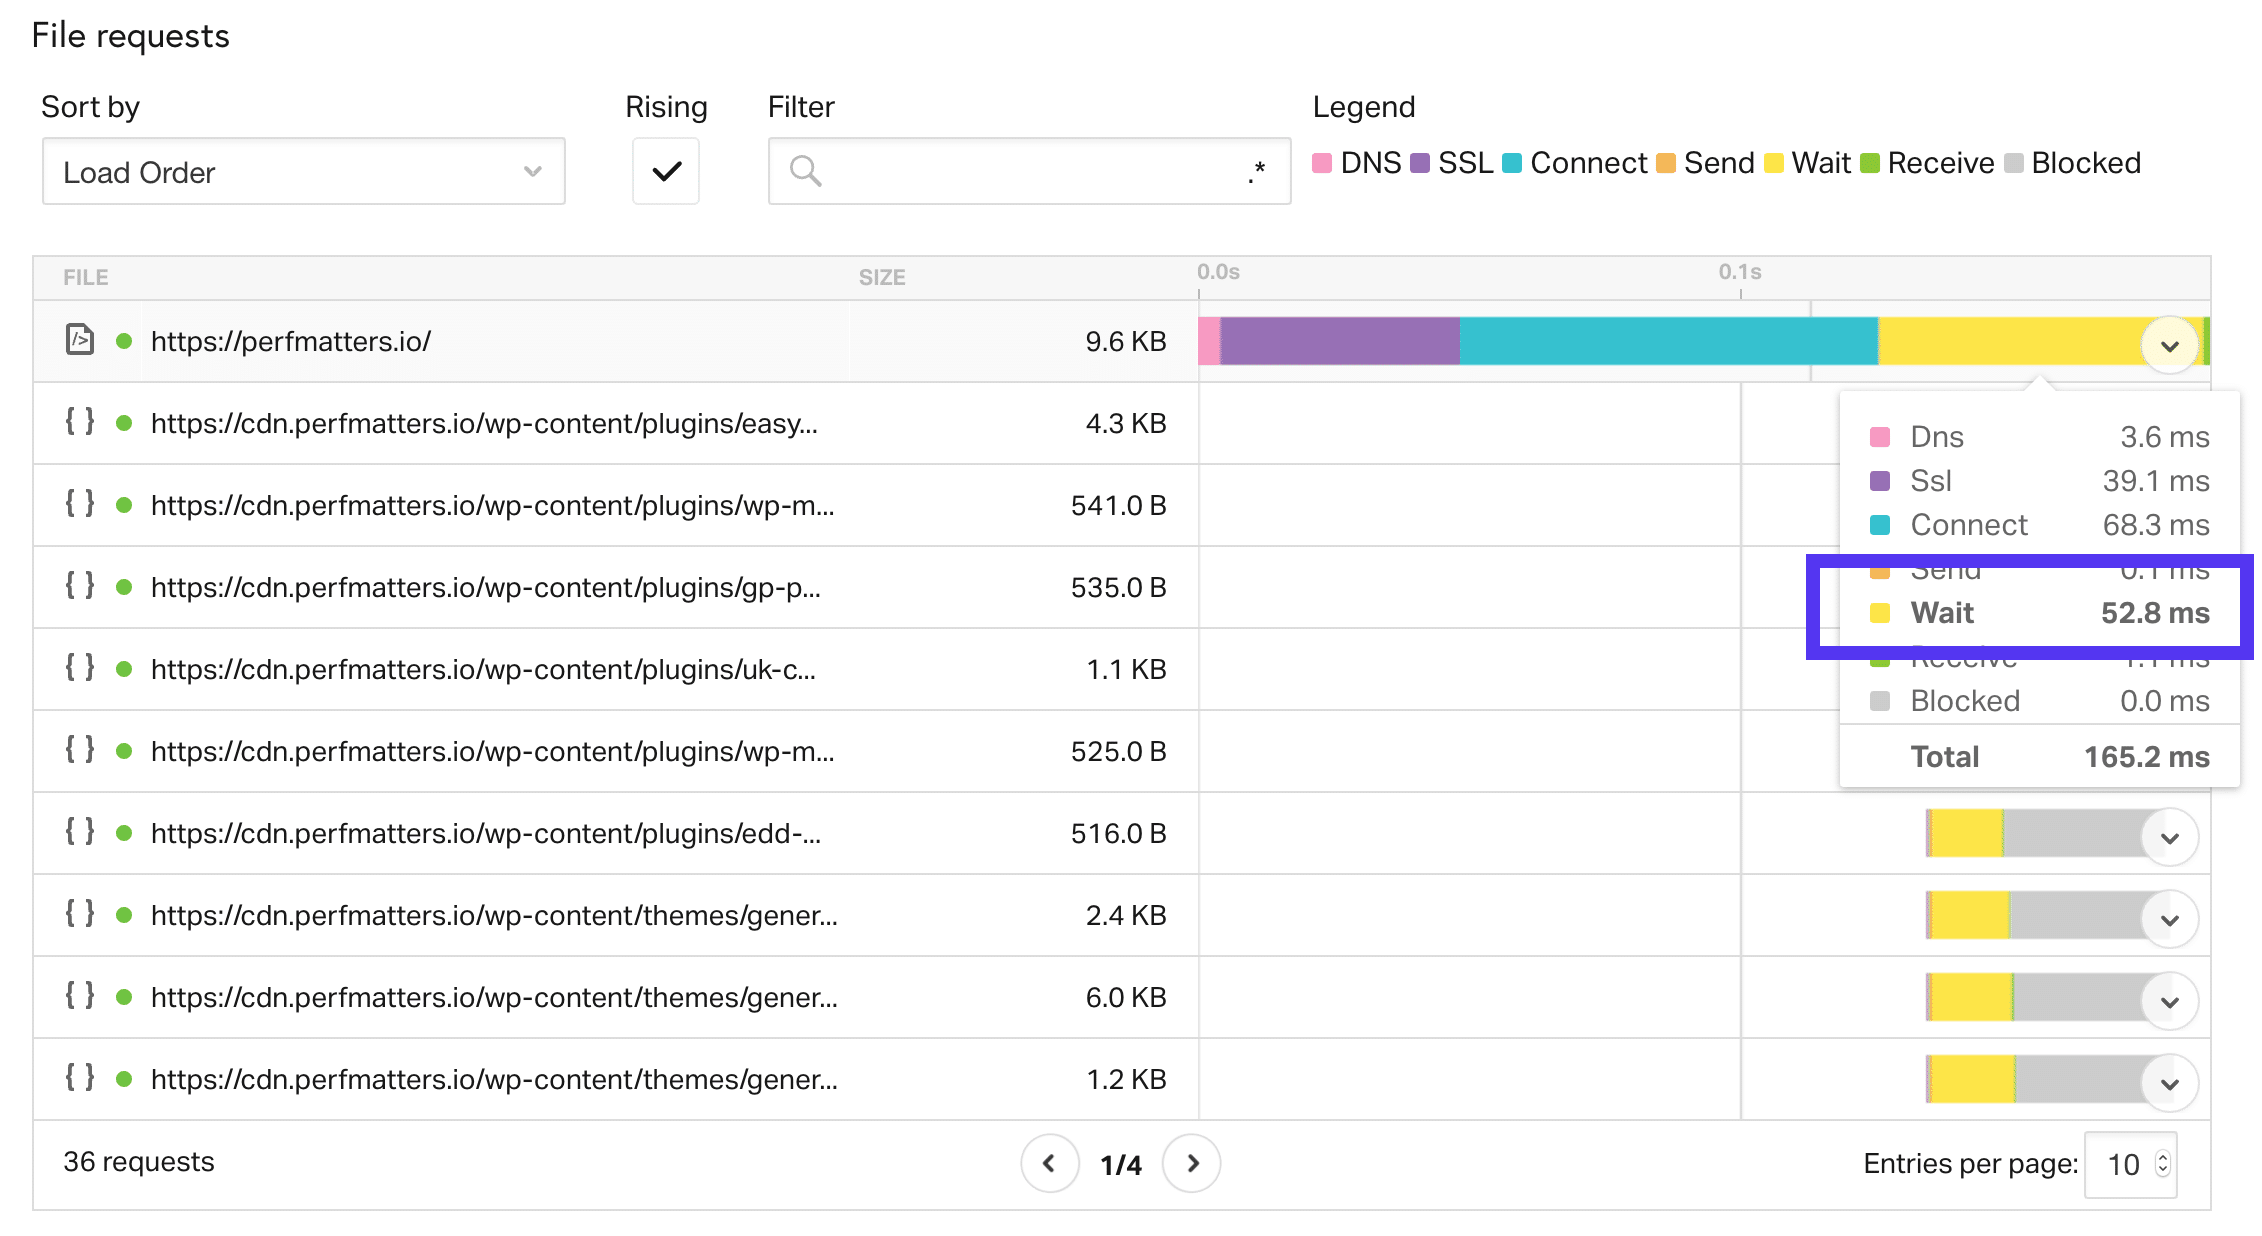
TTFB with WordPress Host Cache
We then reran the test. It is now serving directly from cache. As you can see, our total load times dropped down to 392 ms, and the TTFB on the initial request is now 52.8 ms! That is the difference caching makes.

If you have a website serving visitors in different parts of the country or around the globe, the other easy way to drastically decrease your TTFB is to use a CDN. We again ran a few tests to show the difference.
TTFB without CDN
We first ran a test with our CDN disabled, and as you can see, our total load time was 1.93 s, and our average TTFB on an asset was around 176 ms.

TTFB with CDN
We then enabled our CDN and reran the test. Our total load times dropped to 1.21 s, and our average TTFB on a CDN asset is now 4.6 ms! What a difference a CDN can make.

Another essential thing to note is that we chose the “Pacific – Australia – Sydney” location to perform this test. Why? Because we wanted to show you the real improvement that can be had. Our WordPress site in this example is hosted by Kinsta in a central location in the USA. By performing the test against Australia we can show how the Kinsta CDN caching increases the speed and reduces the TTFB.
And, of course, having a good WordPress host with a carefully thought-out architecture is also crucial to lowering your TTFB.
Send (Orange) and Receive (Green)
The send and receive status’s in Pingdom don’t need much of an explanation. The send time is simply when it takes for the web browser to send data to the server. And the receive time is the time it takes for the web browser to receive data from the server. Both of these will usually be very low or non-existent in your tests.
HTTP Response Headers
You can also click on an individual request while doing your waterfall analysis and see the HTTP response headers. This provides valuable information. In the screen below, we can instantly see things such as gzip is enabled on the web server, and that it’s being served from cache (HIT, which would show MISS otherwise), the cache-control headers, expires headers, the browser user-agent, and more.

Case Study Domain Configuration
If you got this far down in our waterfall analysis post, you are in for a treat. It is always annoying to see people share tips and case studies but not share how they got there. So below is our exact configuration for the case study domain used above! Feel free to replicate it.
Architecture
- The case study domain is hosted with Kinsta in the USA. Kinsta currently offers 29 different data centers to choose from.
- Kinsta uses HTTP/2, Nginx, MariaDB, which contribute to the fast load times.
- The site is using KeyCDN, which powers the Kinsta CDN. Free CDN bandwidth is included in all hosting plans.
- The site is not using any caching plugin. Kinsta caches everything at the server level, which greatly simplifies things!
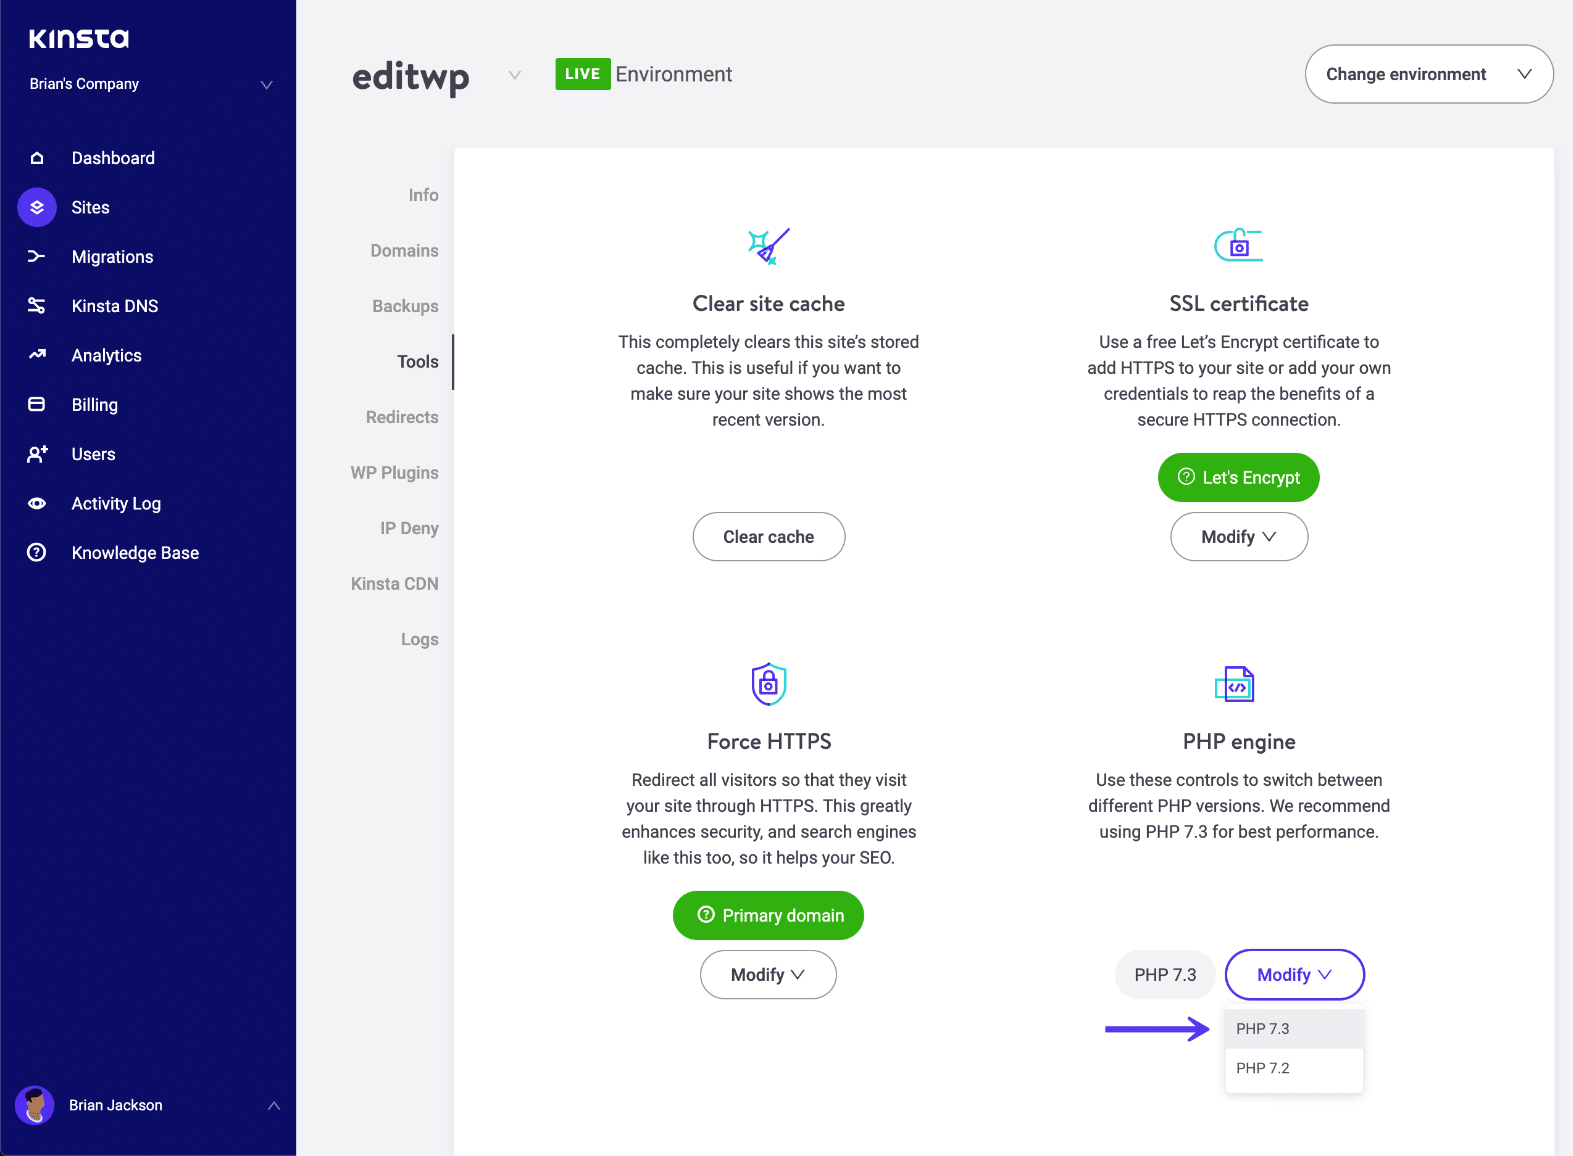
- The site is using PHP 7.3. Newer versions of PHP have always shown great performance improvements. Check out these PHP benchmarks. Kinsta allows you to switch between the two with the press of a button.
WordPress Plugins and Theme
Here is a list of the plugins that impact the performance of the WordPress ecommerce site.
- The premium Imagify plugin is used to compress images.
- The free Safe SVG plugin is used to upload SVG images to the WordPress site.
- The premium GeneratePress WordPress theme was used to build the EDD site.
Recommended Tutorials for Further Reading:
- How to Eliminate Render-Blocking JavaScript and CSS
- How to Disable Emojis in WordPress
- How to Disable Embeds in WordPress
- How to Score 100/100 in Google PageSpeed Insights with WordPress
- How to Diagnose High Admin-Ajax Usage on Your WordPress Site
Summary
As you can see, knowing how the Pingdom speed test tool works a little better and what all the charts mean can help you make a more data-driven decision when it comes to performance.
A waterfall analysis is crucial to know how your assets load and how they are impacted by your WordPress host, physical location, a CDN, etc. We hope this post helped you better troubleshoot your site’s speed and performance.
Got any other great Pingdom tips? Please let us know below in the comments!

Brian has a huge passion for WordPress, has been using it for over a decade, and even develops a couple of premium plugins. Brian enjoys blogging, movies, and hiking. Connect with Brian on Twitter.

