
If you have a website, chances are you’re using Google Analytics to track how many people visit it and how they behave on it.
Google Analytics is a powerful tool, yet most people don’t use it to its full potential.
With it, you can track the ROI for your online marketing, set up custom segments, goal tracking, filter your site data to find underperforming pages, and lots more.
In this guide, you’ll learn how to use Google Analytics to improve your website, how to set it up plus we’ve included some video resources to further help you.
But first, let’s cover the basics:
Prefer to watch the video version?
What is Google Analytics?
Google Analytics is a free reporting service offered by Google to track website traffic. It helps you find out about the people visiting your site and their browsing behaviors.
It looks like this:
It’s one of the popular website tracking platform with almost 70k uses according to BuiltWith’s Mega Technology Dataset:

Although there are several good alternatives, Google Analytics is one of the most adopted analytics tools in the market.
Why Use Google Analytics?
Regardless of the type of website you are running, having a better understanding of your visitors and how they behave on your site is going to help you get better results.
But if that isn’t enough, here are some reasons why you should use Google Analytics:
- It is free – There’s no catch here, Google doesn’t charge you to use Analytics, which is pretty helpful considering the amount of data you can pull from it.
- It is fully automated – Once you’ve added the tracking code to your website, Google Analytics will automatically track, record, and store your data.
- You can create customized reports – Using Google’s in-built tools, you can create custom drag-and-drop reports pretty simply (more on that later)
- Integrate with other tools – Easily link up your Analytics with other Google tools like Google AdWords and Google Search Console.
That’s not even mentioning all the site-specific things you can learn from Google Analytics like why visitors are bouncing off certain pages, the age/gender/location of your audience or the kind of content you should write.
What Does Google Analytics Track?
By giving you access to data about your website, Google Analytics lets you take this information and make decisions.
In very simple terms, the data that you can get from Google Analytics can be broken down like this:
- Acquisition – find out how you get traffic to your website.
- Behavior – find out what people are actually doing on your website.
- Conversions – find out how visitors turn into customers on your website.
Now you know what it is and what it can track, let’s run through a brief Google Analytics setup:
How to Set up Google Analytics (in 3 Simple Steps)
Follow these simple steps to get Google Analytics set up and ready to track on your website:
1. Setup Your Google Analytics Account and Add Your Site
The first step is to make sure you are signed in to your Google Account that you want to manage your analytics with.
Then, go to the Google Analytics setup page and hit Start measuring:

Now you need to add an Account name and leave the data sharing boxes ticked (you can untick them if you want to, they won’t change anything with your data).
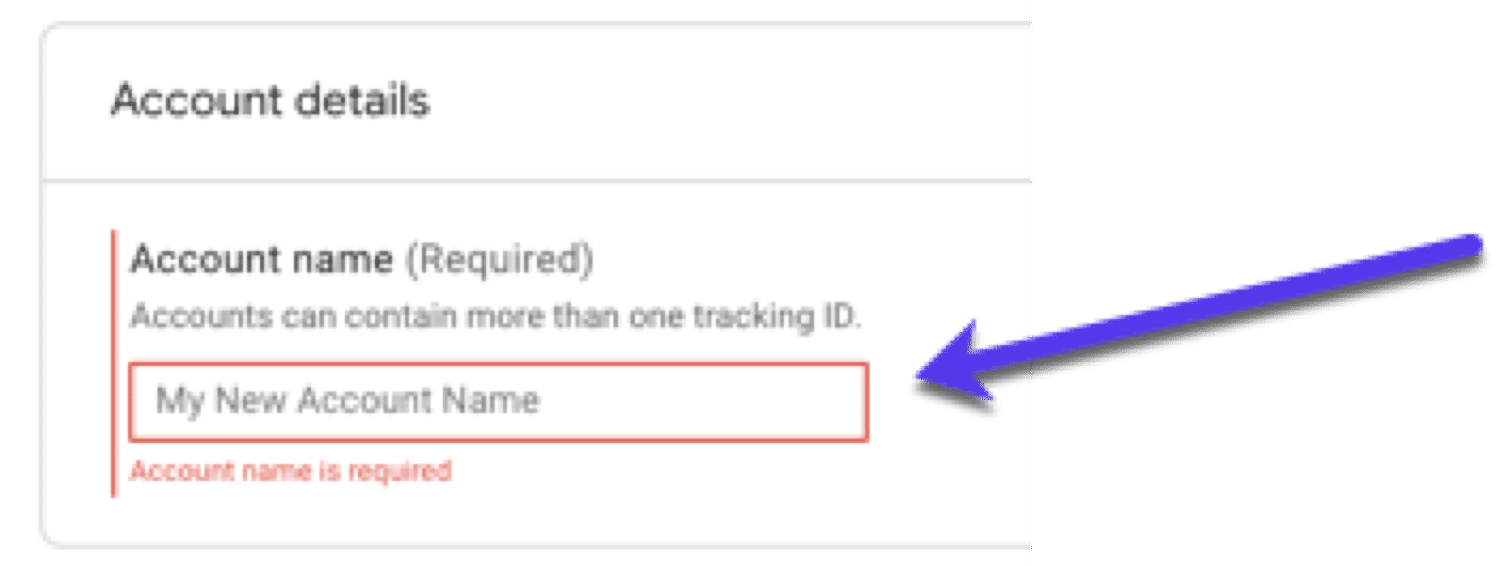
Once you’ve added that, hit next.
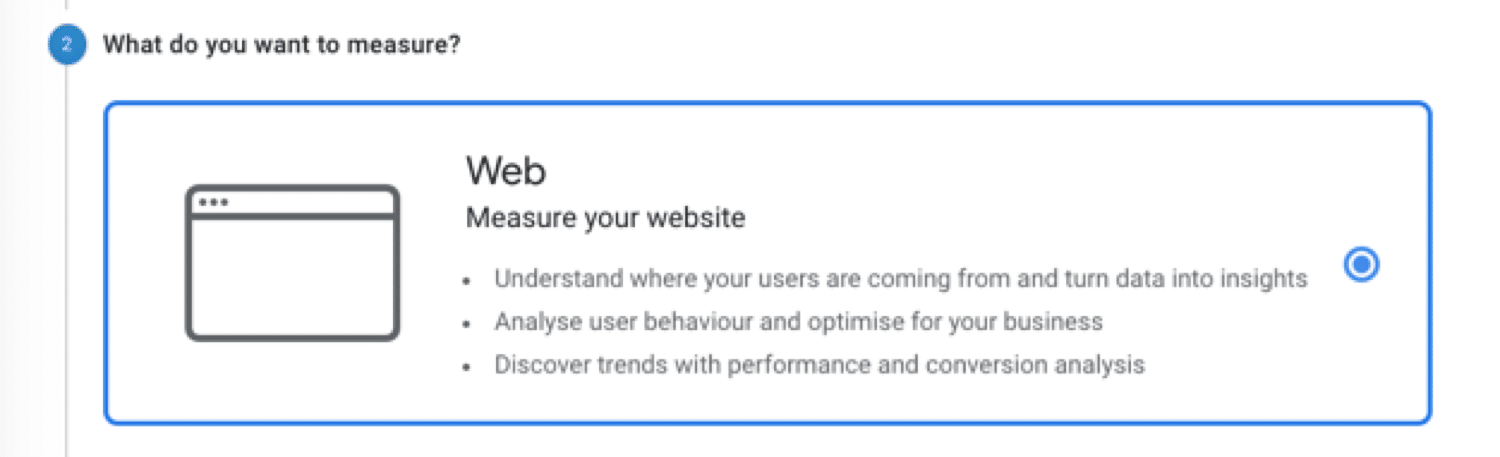
Now you need to choose the type of property you want to measure: websites, apps or both. Most people are going to be setting up Google Analytics to track a website, so select that and click on next.
Now you’ll be able to add some details about your site:
- Website Name – self-explanatory.
- Website URL – make sure to choose http or https from the dropdown menu then add your URL.
- Industry Category – choose the area that best describes your site.
- Reporting Time Zone – pick the time zone you are in.
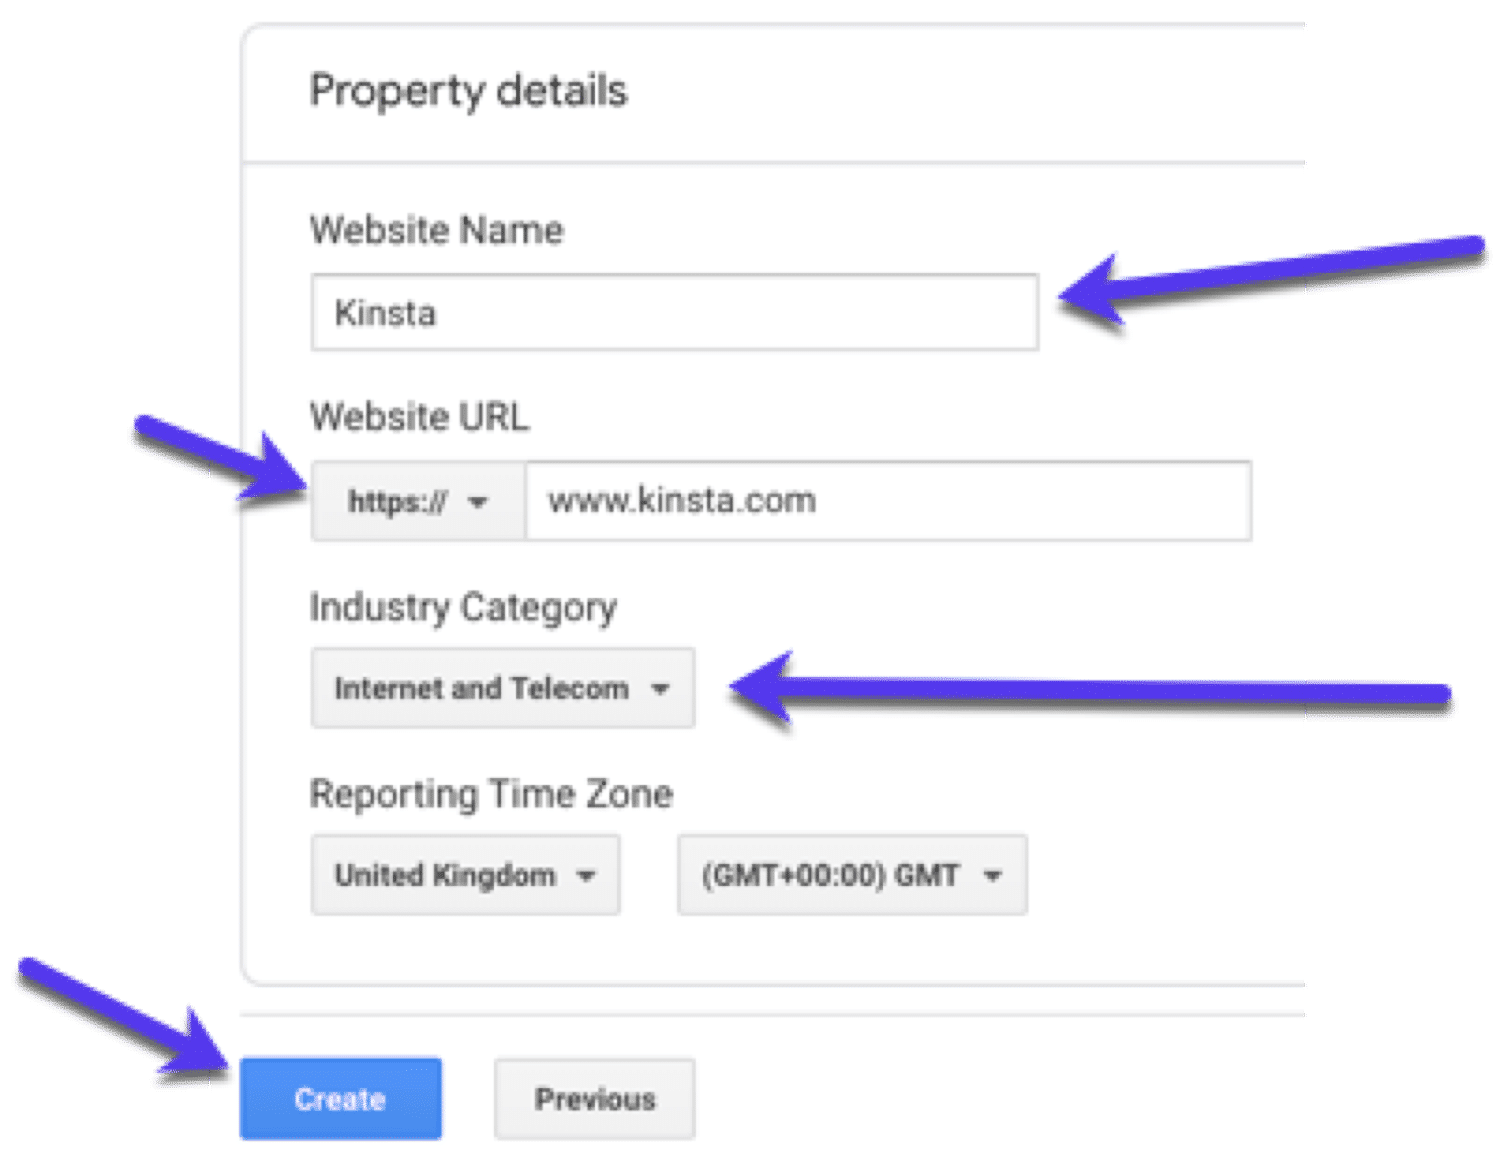
Once you have completed this section, click Create and you will be prompted with some terms of service to agree to. Tick both of these and press Agree.
2. Install Your Google Analytics Tracking Code
Now you’ll see your unique tracking code:
To track your website using Google Analytics, this code must be installed on every page of your site (before the </head> tag).
Installing the code will depend on the type of site you have and how comfortable you are making the changes yourself.
Let’s run through two different ways:
Manually Install Google Analytics
Some WordPress themes have a dedicated section to drop your tracking code into but most of them don’t. That’s why you should always be using a child theme to prevent your GA script from being overwritten after every update.
Your Google Analytics script should be added to your header.php file, before the closing tag </head> to install it across every page of your site.
If your theme doesn’t have this feature, you could try using a plugin to create them:
Install Google Analytics Using a Plugin
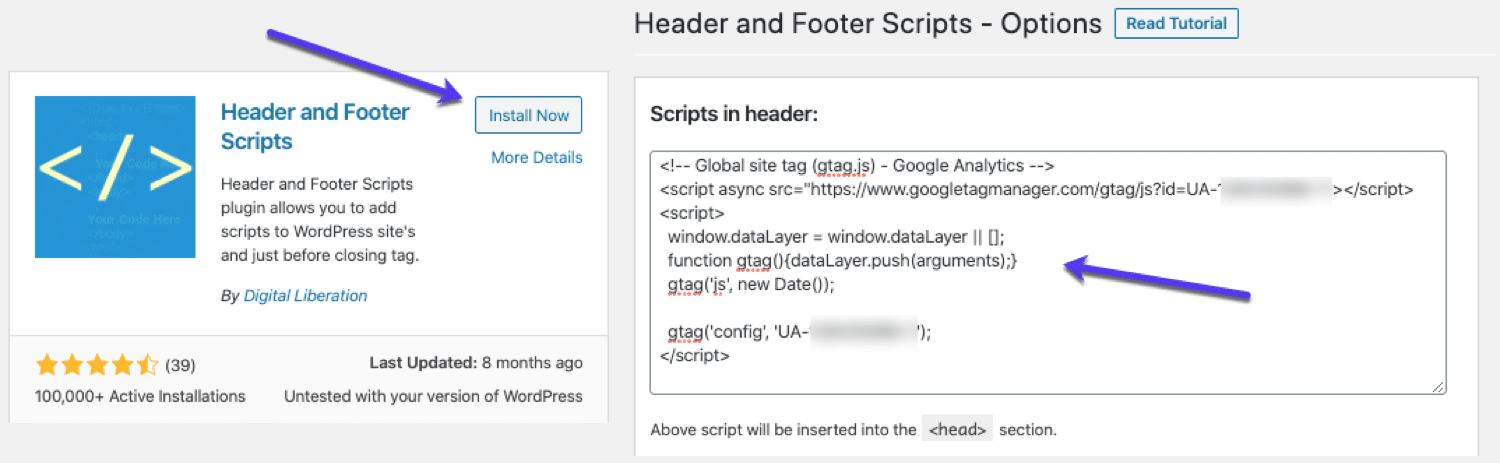
One of the easiest ways to add Google Analytics to WordPress (for both beginners and experts) is to use a plugin like Header and Footer Scripts.
This is probably the easiest (and safest method) for adding a Google Analytics code to your WordPress site.
Just install the plugin and add your tracking code to get started tracking:
Want more options for your WordPress site? Check out our ultimate guide on how to add Google Analytics to WordPress.
3. Test Your Google Analytics Tracking Code
Once you’ve added the code to your site, you need to test that Google Analytics is actually tracking.
This is pretty easy.
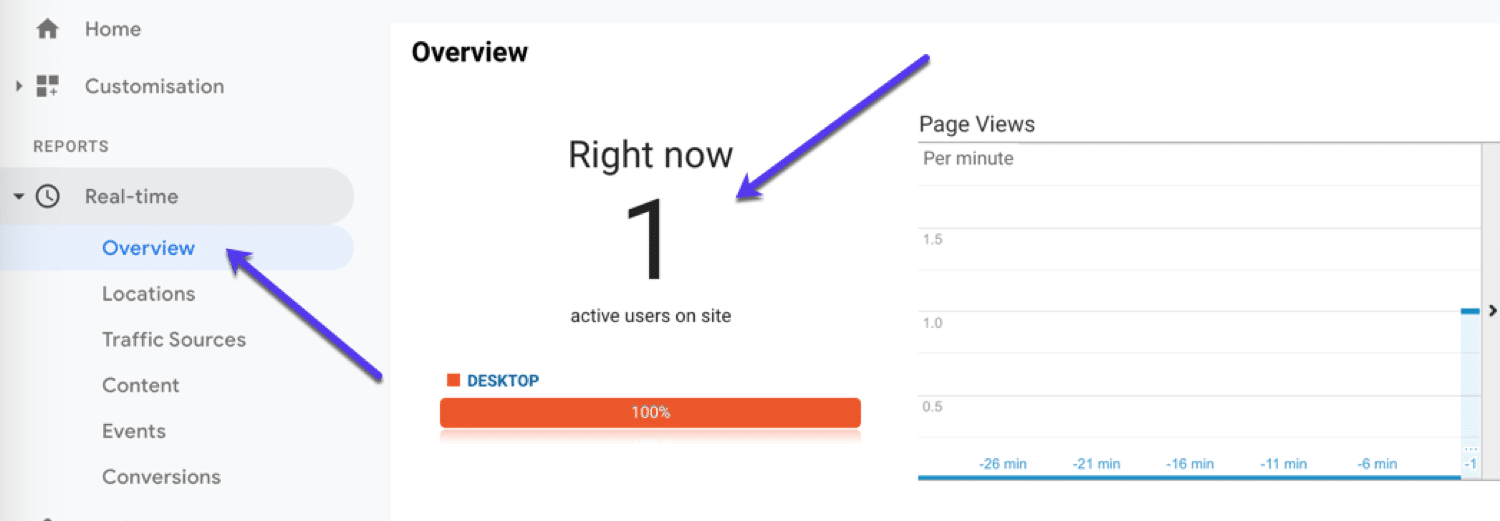
In Google Analytics, go to Realtime and then Overview. This will show you what is happening on your site right now.
Now go open your site in a different browser (or incognito mode) tab and wait for Google Analytics to pick up your visit. If your tracking code has been installed correctly, you’ll see something like this:
Before moving on, make sure to link Google Analytics with Google Search Console to have a better, more integrated picture of your data.
Now that you are all set up, let’s explore what metrics you’ll find inside Google Analytics.
Google Analytics Metrics and Dimensions Explained
Before we jump into how to read Google Analytics reports, it’s worth understanding what the metrics and dimensions mean.
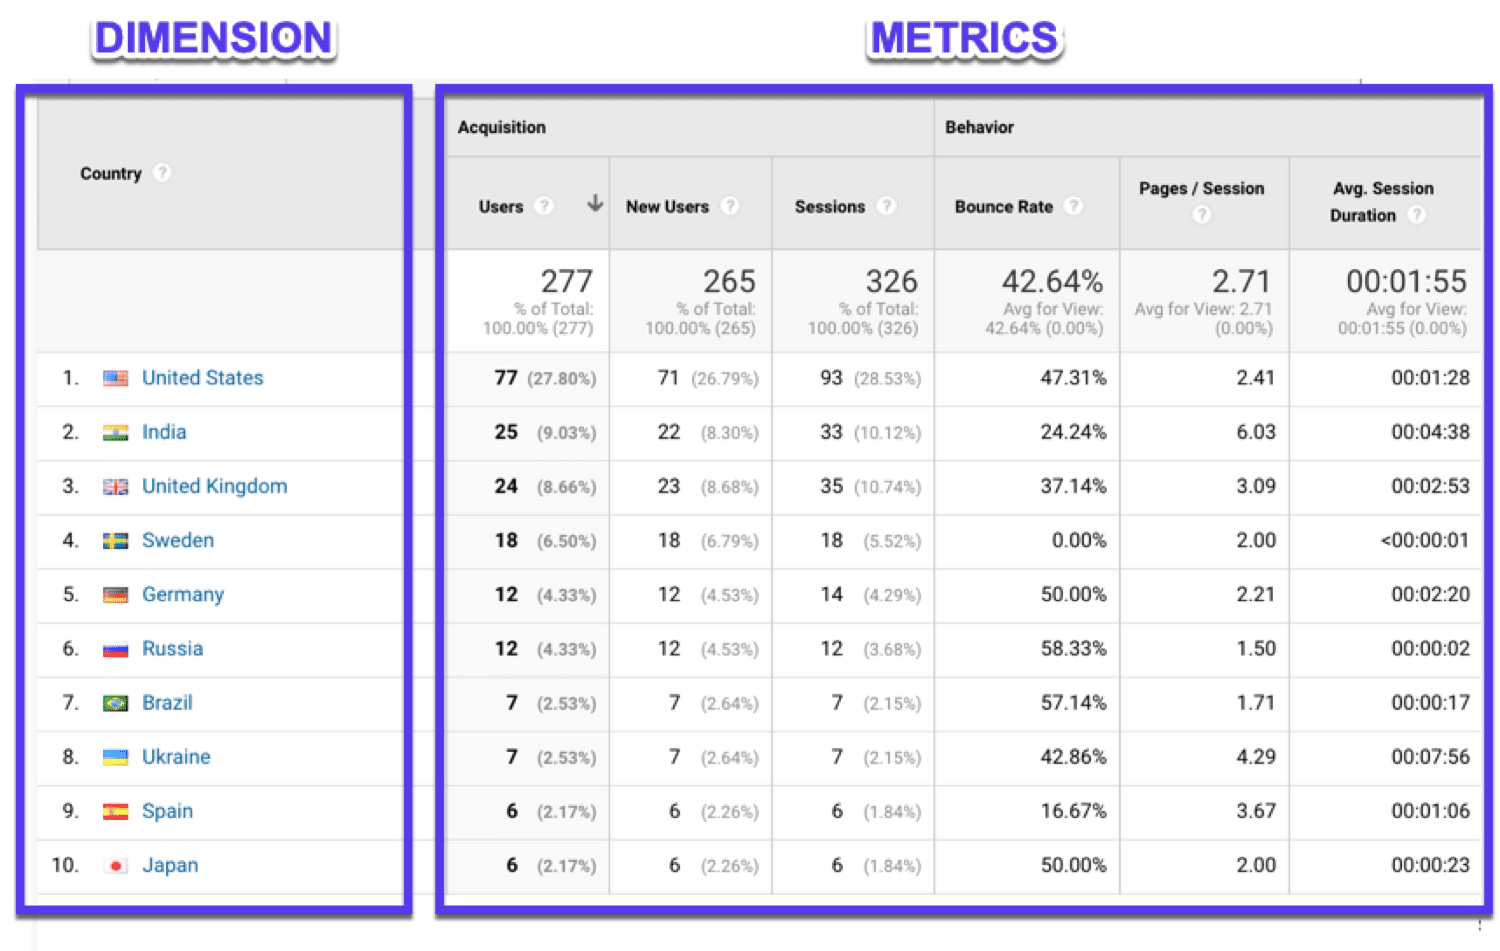
All Google Analytics reports are based on dimensions and metrics:
- Dimensions are the elements of your data.
- Metrics are the measurements for those dimensions.
For example, if you are looking at where people visiting your site are located, the dimension would be the location (the data element) and the amount (measurement) would be the metrics:
Example Metrics
Here are some of the most important metrics in Google Analytics to pay attention to:
- Traffic – visitors to your website.
- Traffic Source – where visitors are coming from (direct, referring, search engines, social).
- Session – a group of user interactions taking place within a given time frame.
- Average Time Spent – how long someone spends on your site.
- Average Pages Per Visit – number of pages a user visits.
- Top Pages – the most popular pages.
- Exit Pages – the pages where most people leave your site.
- Bounce Rate – the percentage of single-page visits divided by all sessions.
- Unique Users vs Returning Users – how many people are brand new to visiting your site vs regulars.
- User Behavior Flow – how visitors have browsed your site.
- Location – where users are browsing from.
- Age – their age bracket.
- Site Speed – how fast your site is (here’s our ebook on how to speed up your WordPress site).
Now let’s go over the Google Analytics reports you’ll find and how to read them:
How to Use Google Analytics Reports
When you first log in to Google Analytics, you’ll see this “Home” dashboard which acts as an overview of your site’s performance:
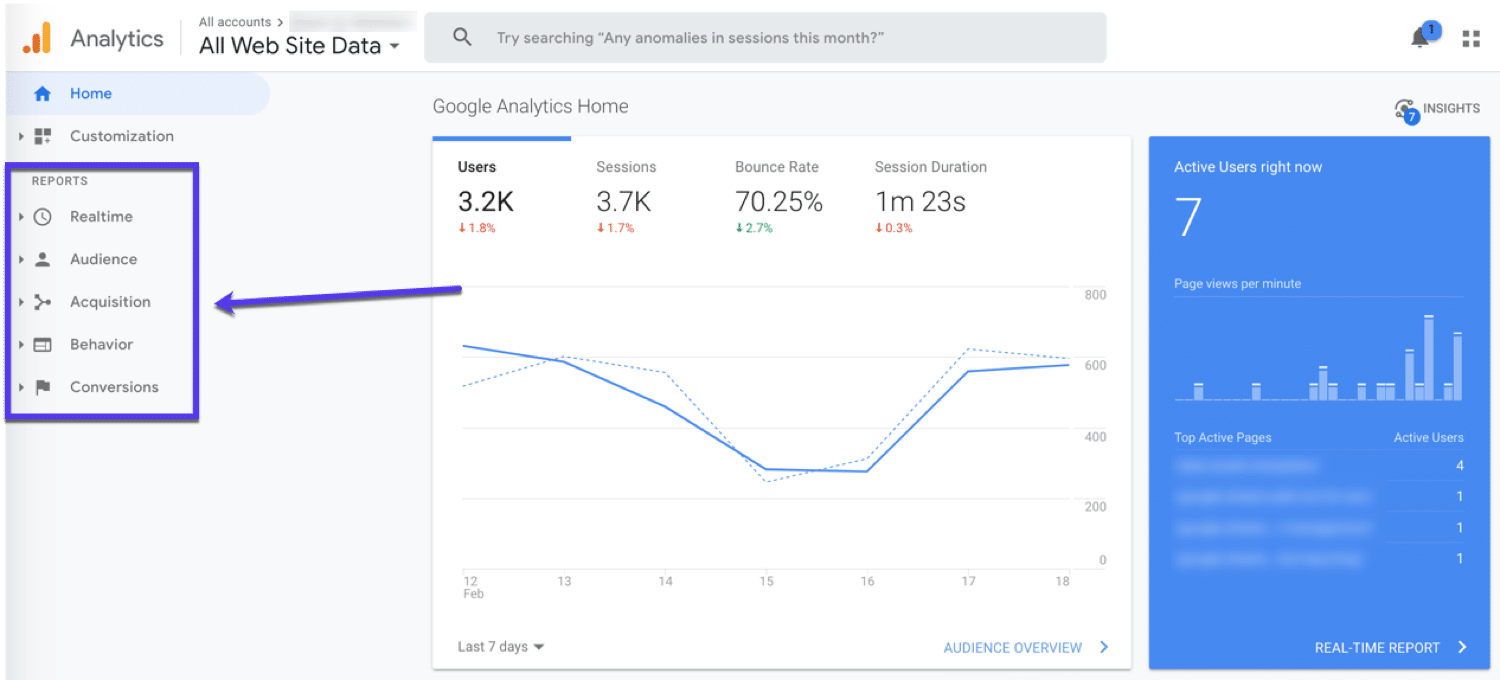
Google Analytics reports are the preset reports listed in the left-hand sidebar, under the following sections:
- Realtime.
- Audience.
- Acquisition.
- Behavior.
- Conversions.
The information in these reports is preset by Google Analytics and gives an insight into the data across your site, from audience demographics to the channels they find your website through.
By clicking on those reports, you’ll get lots more options for exploring your data (but beware of referral spams). Let’s take a quick look at each report:
Realtime Report
The Realtime report shows you what’s happening on your site right now:

You can see how many people are viewing your site, the pages they are visiting, where they are located in the world and more.
With the Realtime report, you can:
- See how much traffic you’re getting from a newly published blog post.
- Know if a sale or event is driving views.
- Make sure URLs you’ve just set up are working as they should.
Audience Report
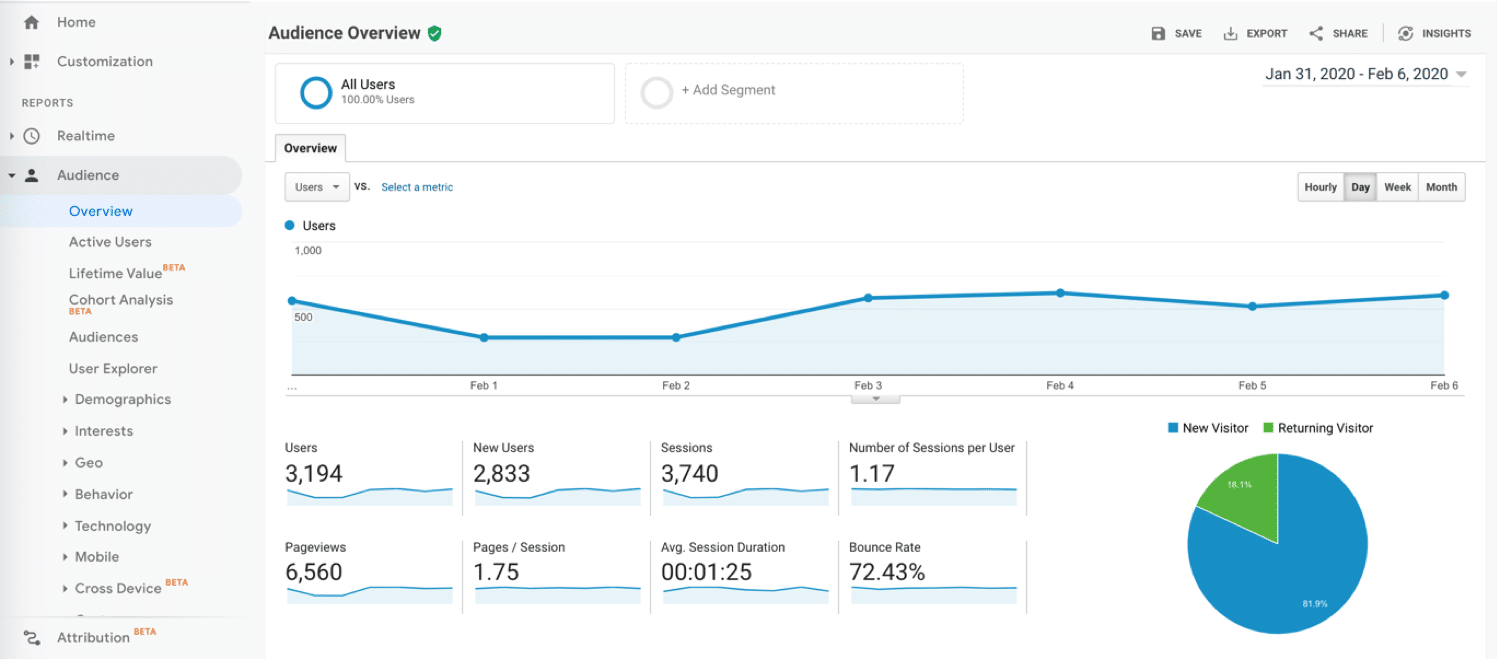
The Audience Report gives an overview of your website in terms of the people (aka audience) visiting your site:
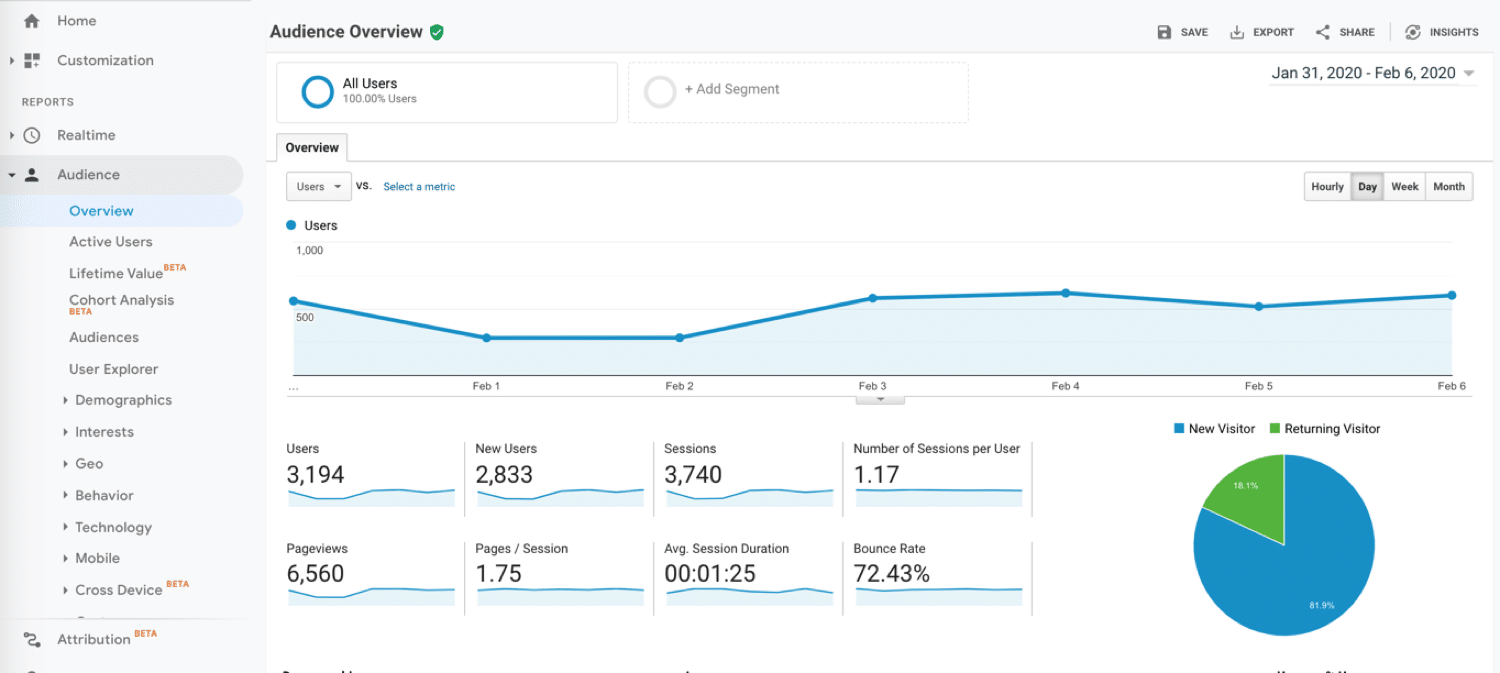
In this report, you’ll be able to drill down and find out more about your audience like:
- Demographics.
- Interests.
- Location.
- Behavior.
- Technology.
Using this data, you can better understand your audience and then make informed decisions about your website.
For example, you may notice that the bulk of your traffic is visiting your site on mobile but most goal conversions are done on desktop. Maybe there is something you can improve for mobile devices to help increase conversion.
Acquisition Report
The Acquisition Report gives an overview of how your website is getting traffic:
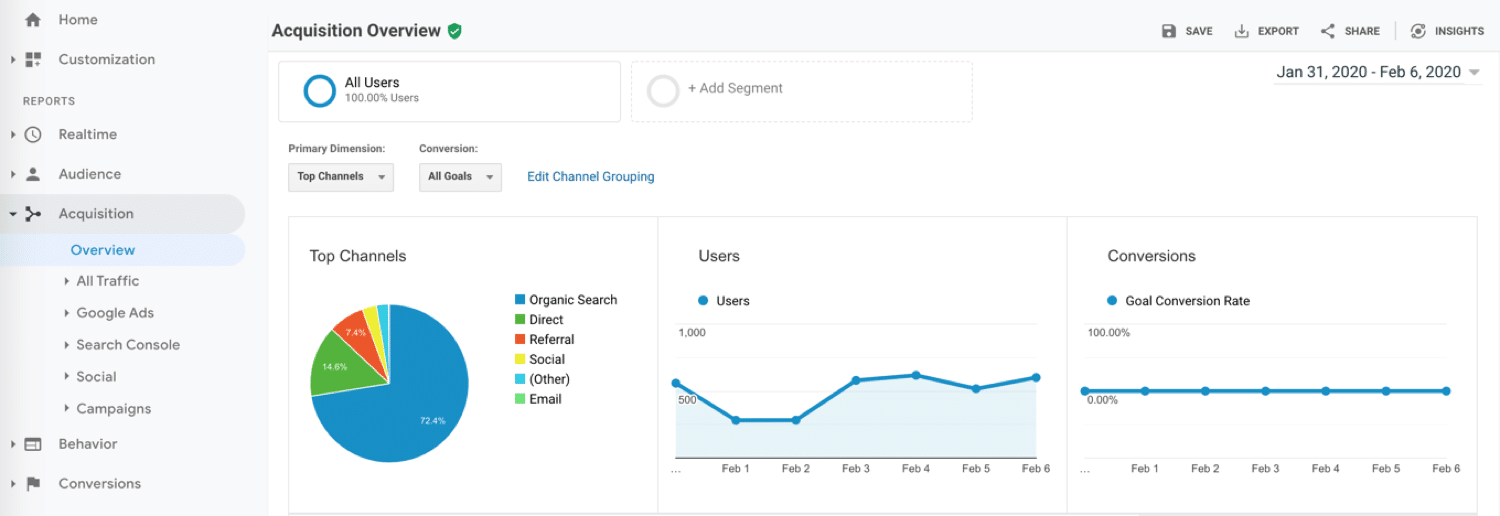
In this report you’ll be able to see your traffic broken by source (aka, where it came from):
- Organic – SEO traffic from Google and other search engines (here’s an extensive guide on how to improve your SEO strategy).
- Direct – someone visiting your site by manually typing in a URL.
- Referral – a visit from another site.
- Email – a visit from an email or email list.
- Social – someone visiting from a social media platform.
- Paid Search – someone visiting from paid ads.
- Display – someone visiting from a display advertisement.
- Affiliate – someone visiting from an affiliate link.
- Other – if Google Analytics doesn’t know how to categorize your traffic.
Behavior Report
The Behavior Report gives an overview of what visitors do on your website:
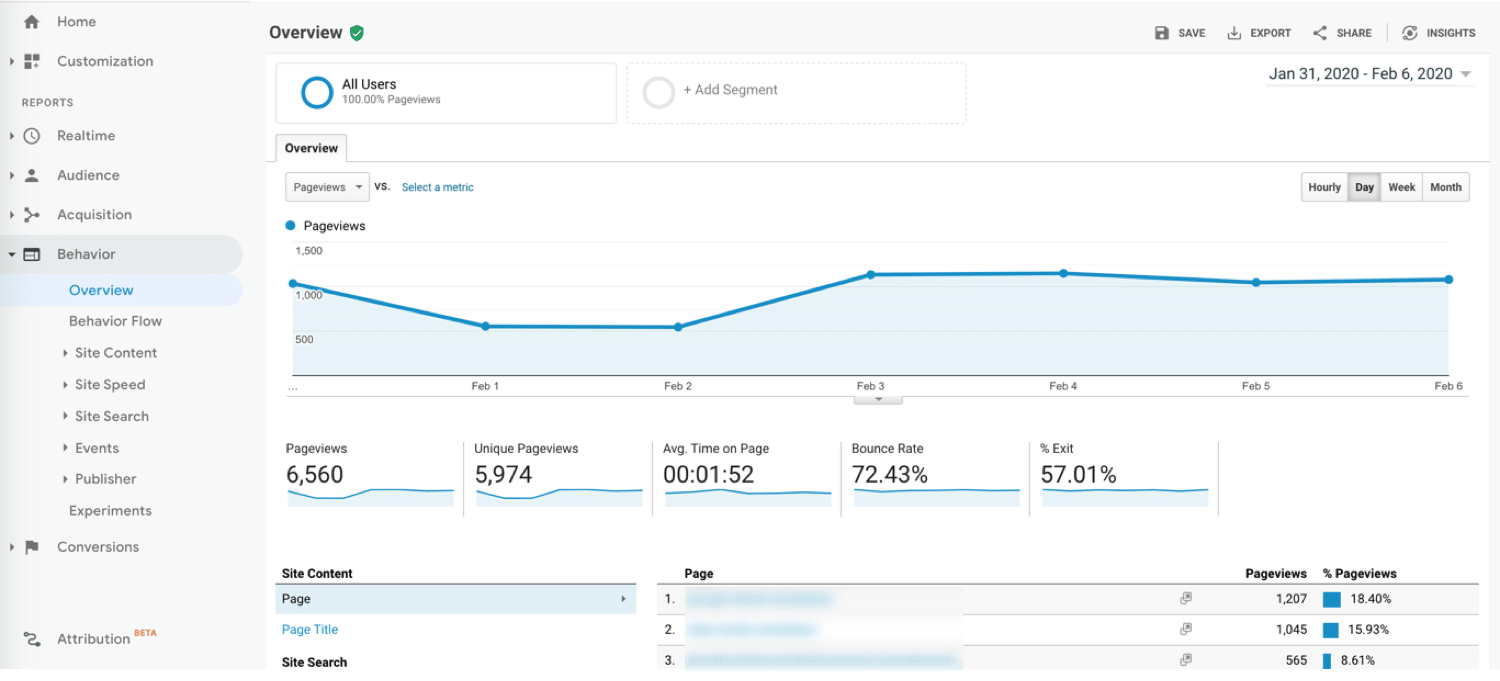
In the report, you’ll be able to focus on individual pages of your website and understand your visitor’s behavior. You’ll be able to get an overview of:
- Pageviews and unique pageviews.
- Average time spent on pages.
- Bounce rate and exit rate (here’s an in-depth guide on how to reduce bounce rate on your site).
You can also review how the content is performing by page URLs, titles, search terms or events.
Conversions Report
The Conversions Report gives an overview of how your visitors are (hopefully) converting on your website:
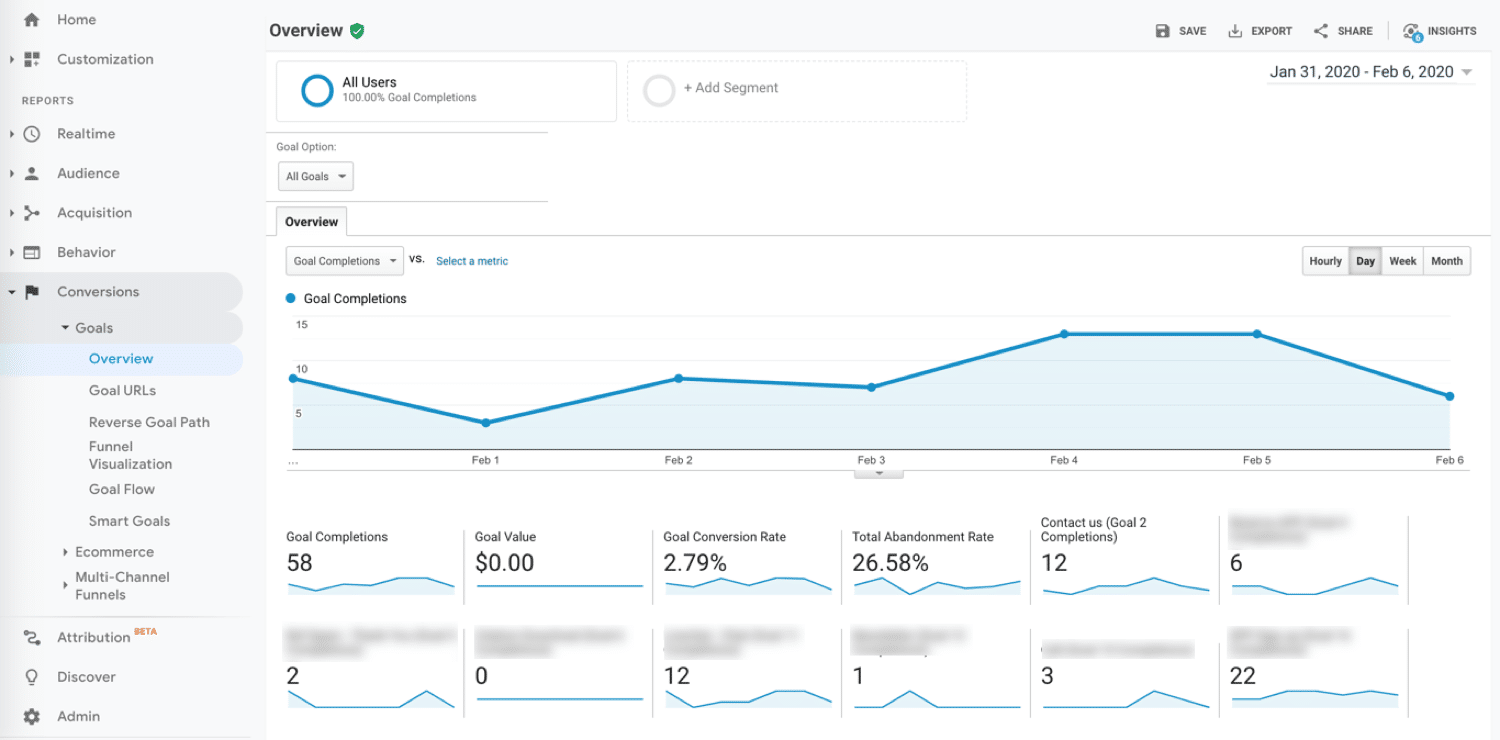
If you have a website, chances are you have a goal/conversion you want to achieve for people visiting.
This can be different depending on the type of site you run:
- Ecommerce sites want their visitors to order a product.
- Bloggers want their visitors to stay longer on pages and read to increase their ad revenue.
- B2B and SaaS businesses want visitors to sign up to their email list to keep them informed on the latest news and features (like the one we curate here at Kinsta).
Boosting sales/signups in these areas can be as easy as applying some conversion rate optimization tips based on Google Analytics data.
Regardless of the goal/conversion you want to track, Google Analytics allows you to measure all of these (plus many more).
What Is a Goal in Google Analytics?
A goal is a conversion that you have defined. It is dependent on what you want to monitor. When it comes to goals, there are four main types:
- Destination: completed when a user gets to a specific page (think product listing, order confirmation, or thank you page).
- Event: completed when a pre-set event triggers (like watching a video or sharing something to Twitter).
- Duration: completed when a user’s session lasts longer than a predefined time.
- Pages/screens per session: completed when a user views a set number of pages per session.
(You’ll be able to find out more detailed steps on setting up goals later on in this guide)
Use Filters for More Accurate Reporting
In Google Analytics, Filters are used to break up data into smaller groups. They can be used to include only specific traffic types or exclude specific data.
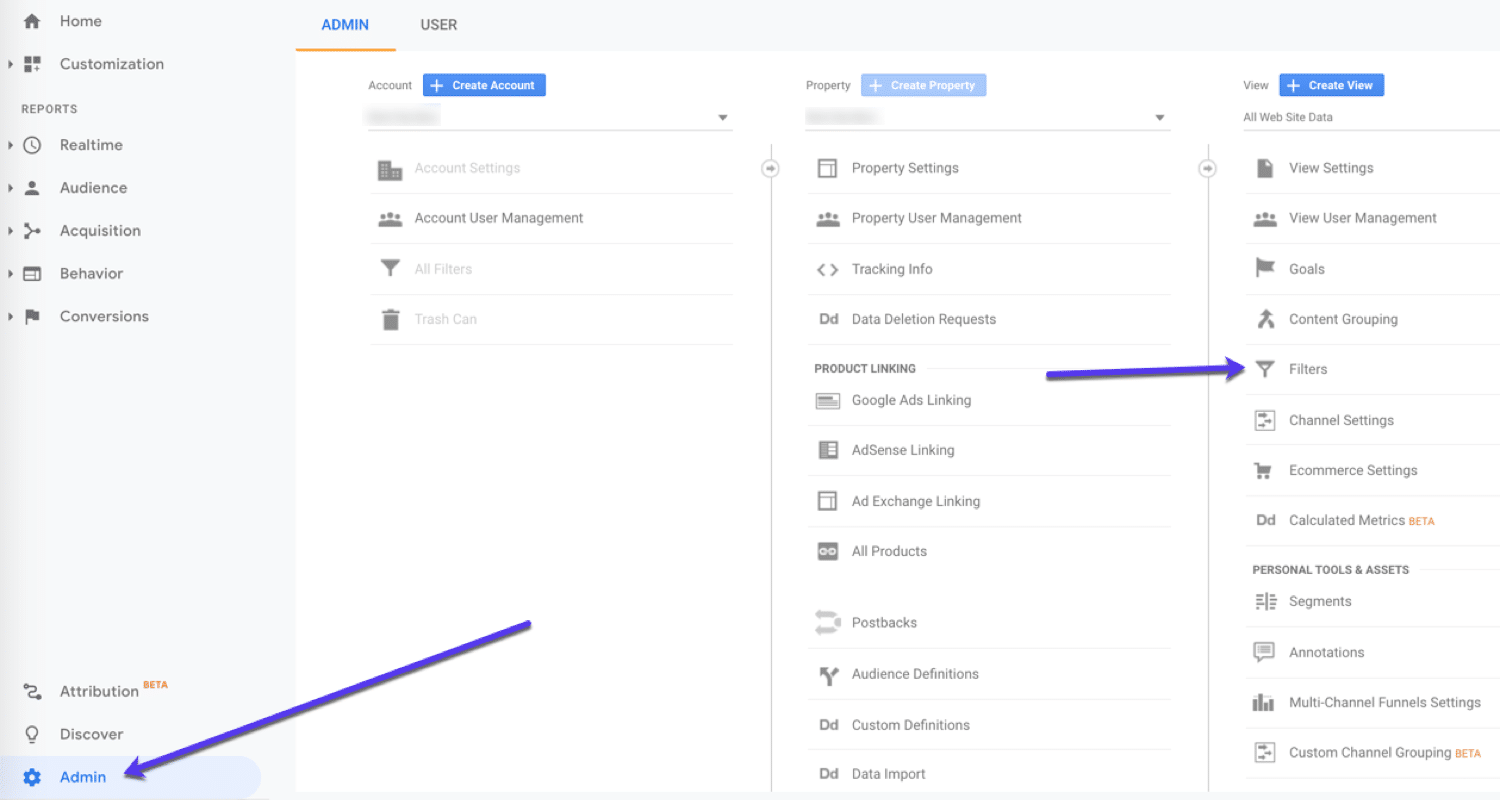
To use filters, go to the Admin panel and then select Filters:
Here’s a really simple filter to block your IP address so you aren’t skewing your data by visiting your own site.
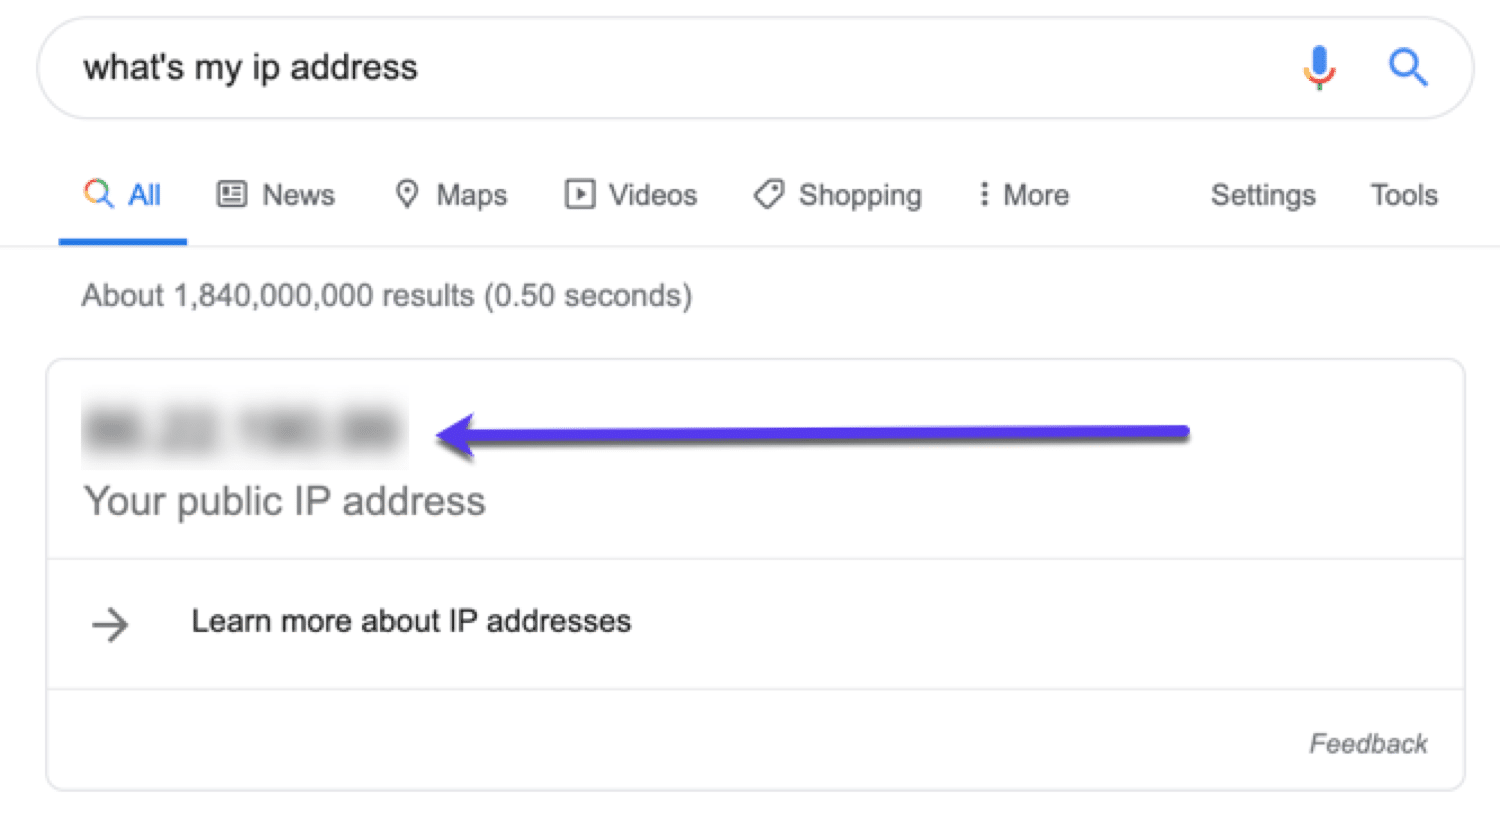
The first step is you need to find out your IP address.
This is simple: we have a tool for that at Kinsta what’s my IP address or you could just Google it:
Copy your IP address and then open up Google Analytics. Go to the Admin panel, and then, under View, select Filters:
Now click +Add Filter and fill out the details:
- Filter name – Exclude my IP.
- Filter type – Select Predefined.
- Now select Exclude, traffic from the IP addresses and that are equal to.
- IP address – add your IP.
It should look something like this:
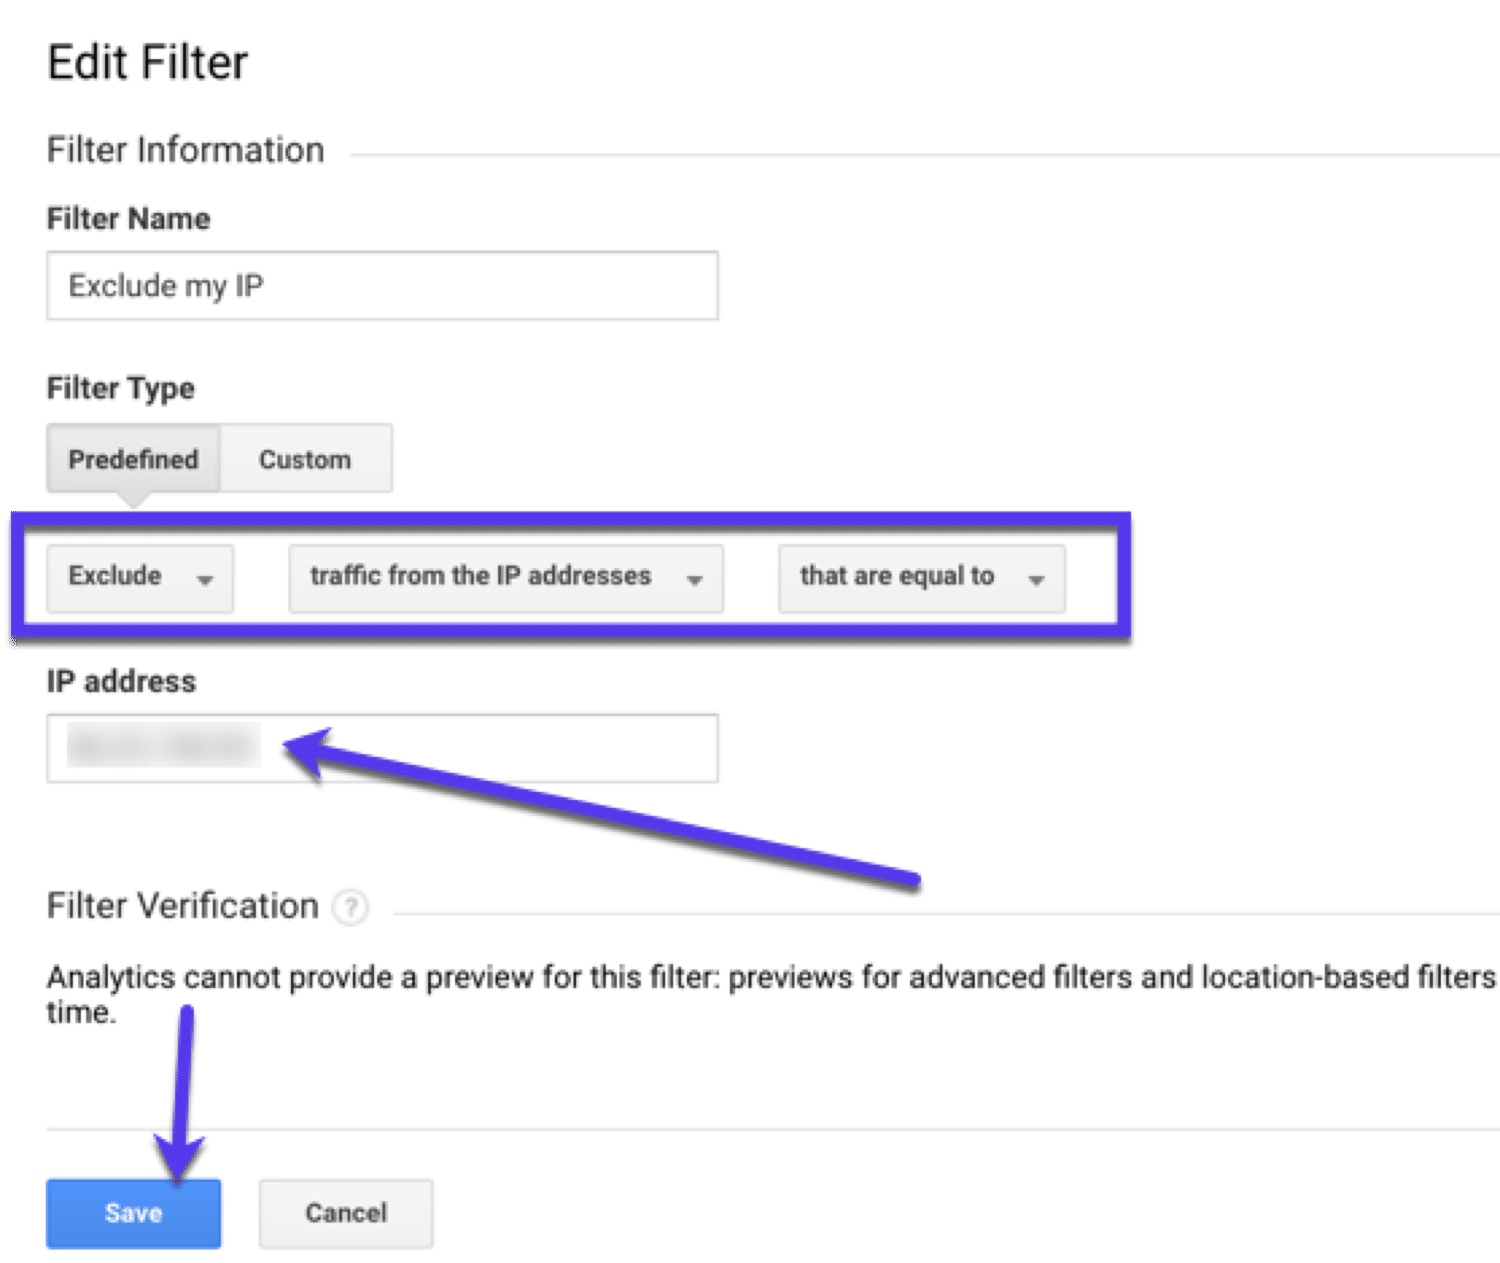
Now save your filter.
7 Ways to Use Google Analytics to Improve Your Website
So, now you’re all set up, you know what reports and metrics you can view, there’s a key question we need to answer to.
What can you do with Google Analytics to improve your website and business?
I’m glad you asked…
Here are seven things you can do in Google Analytics, now that you know how to use it properly:
Let’s explore these in more detail:
1. Create Custom Dashboards and Reports
Want to see your most important analytics data without having to dig through the rest of Google Analytics?
Then you should make use of Google Analytics custom dashboards and reports. In the left-hand panel, just click on Customization and you’ll see them:

You can pick just the data you want to see, and organize it in a way that works for you. This means you can make your own report simply by adding widgets and moving them around.
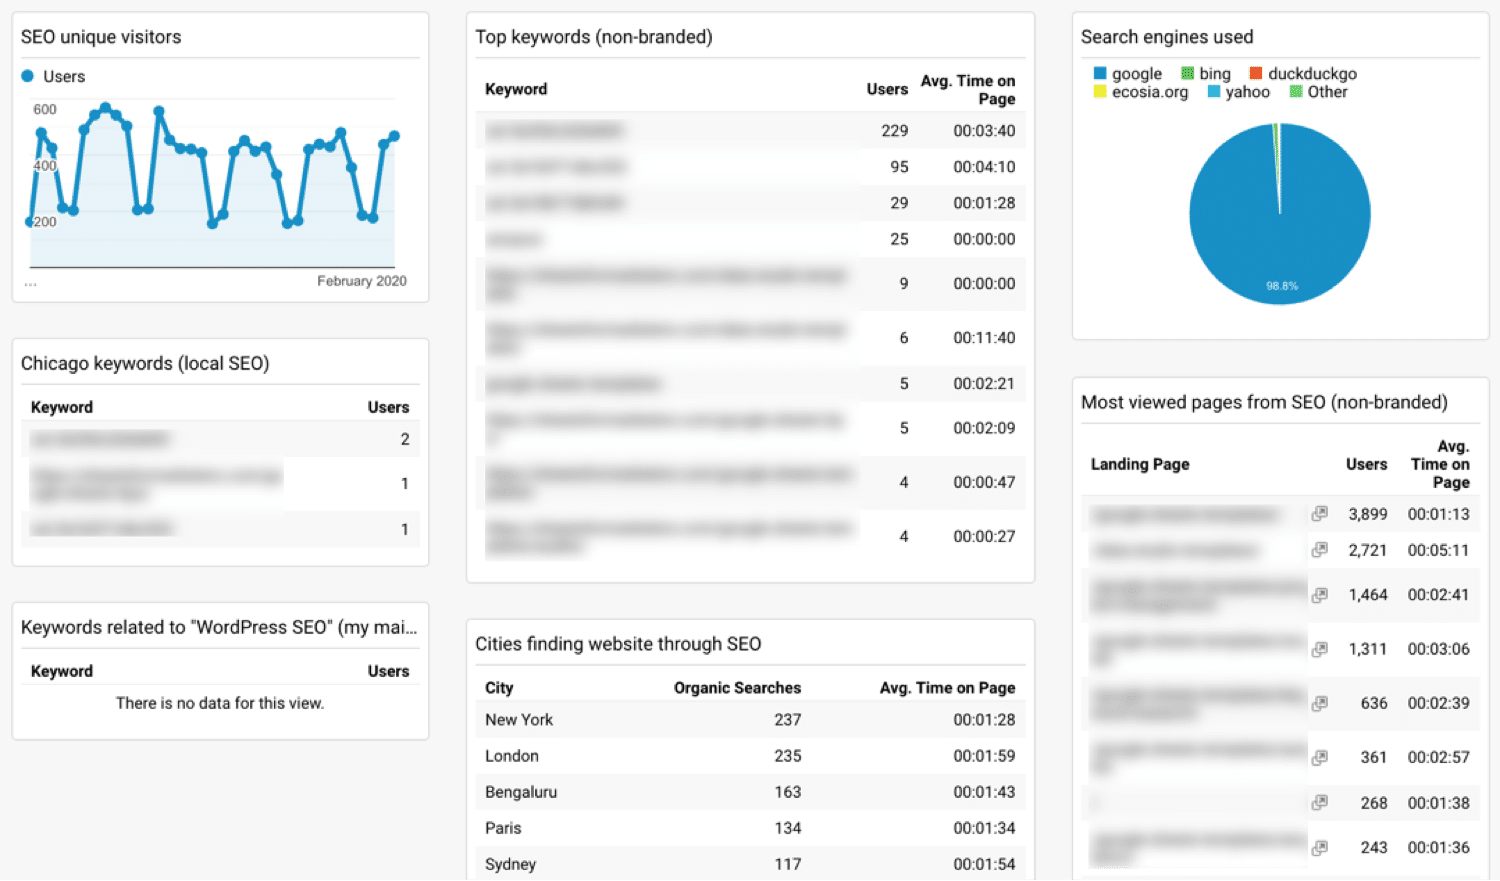
Here’s an example of a custom dashboard that is focused on SEO:
Want to know the best thing about custom dashboards though? You can use pre-built templates.
Here are some free Google Analytics dashboards you can make copies of:
If there is one (or more) piece of data you want to see at a glance every time you log in to your Google Analytics account, be sure to set it up in the Dashboards area.
How to Make Google Analytics Custom Dashboards
If you need more help setting up Google Analytics dashboards, you can follow the instructions in this video:
2. Use Custom Segments to Understand Your Data Better
One of the best ways to explore your data in Google Analytics is by using simple and advanced segments.
What Is a Segment in Google Analytics?
A custom segment is a defined grouping of your Analytics data. Segments allow you to track different types of users, so you can understand how your site can better serve them.
You can use them to drill down into the data you’ve collected.
For example:
You may want to segment all your site visitors based on a particular country or city if you want to focus on local traffic. Another segment could be users who visit a specific page on your site.
Or maybe you want to compare mobile vs desktop visitors. By creating a mobile segment and a desktop segment, you can compare the data side by side.
How to Create a Google Analytics Segment
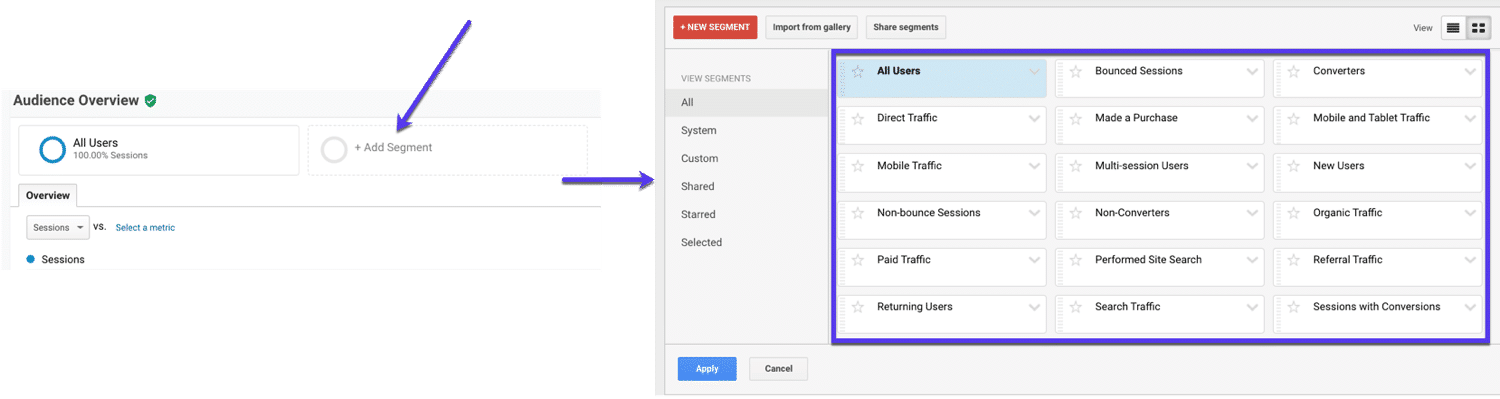
There are pre-made segments waiting for you inside Google Analytics.
Just open Google Analytics and click +Add Segment and you’ll be able to browse and apply the existing ones that have been pre-built (by Google) for you:
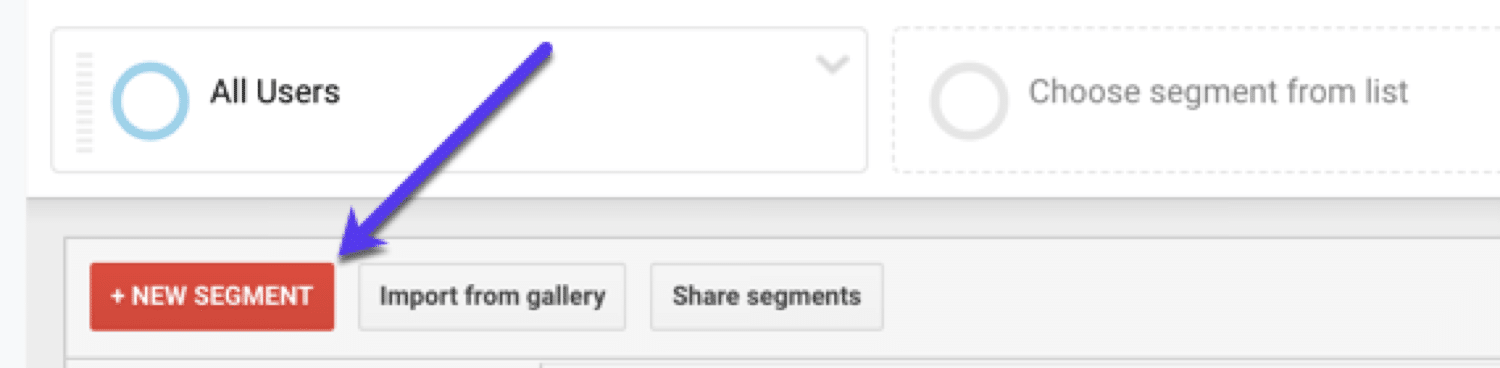
If this isn’t enough want, you can create your own segment:
How to Create a Custom Google Analytics Segment
To add a custom segment, click the red +New Segment button:
From here, you can choose how you want to segment your users:
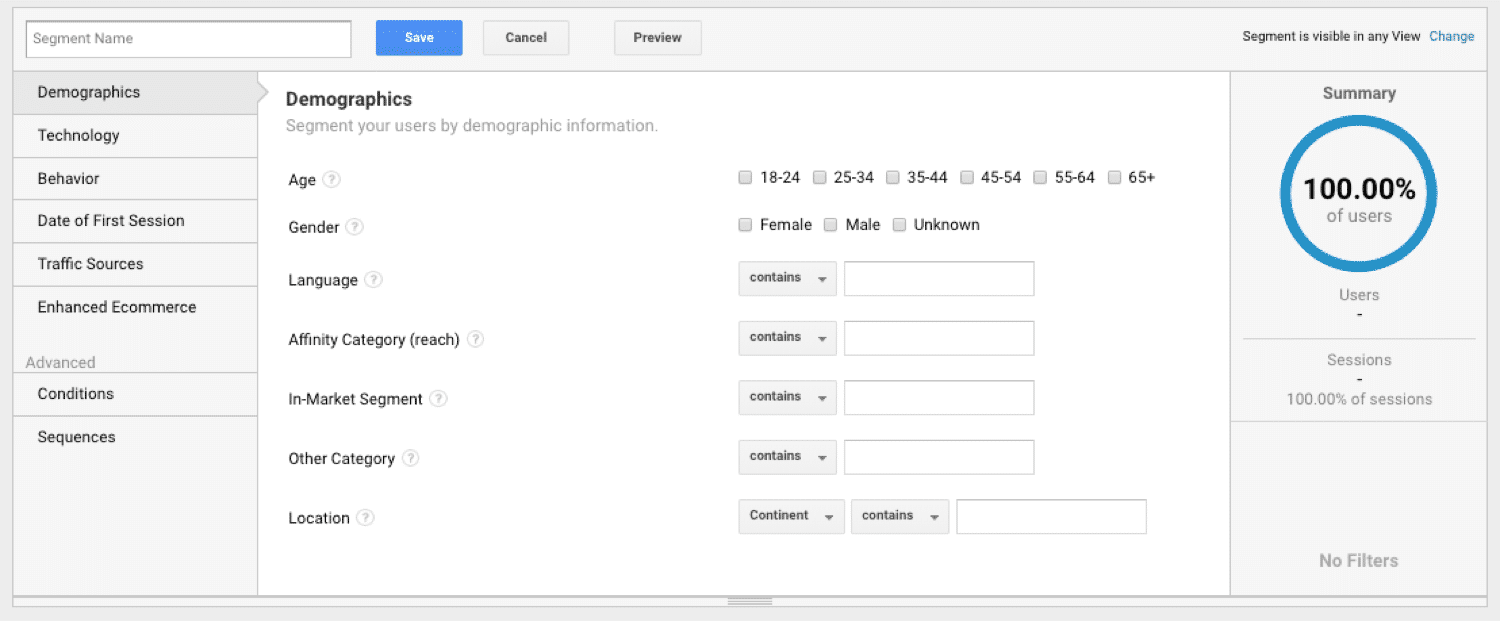
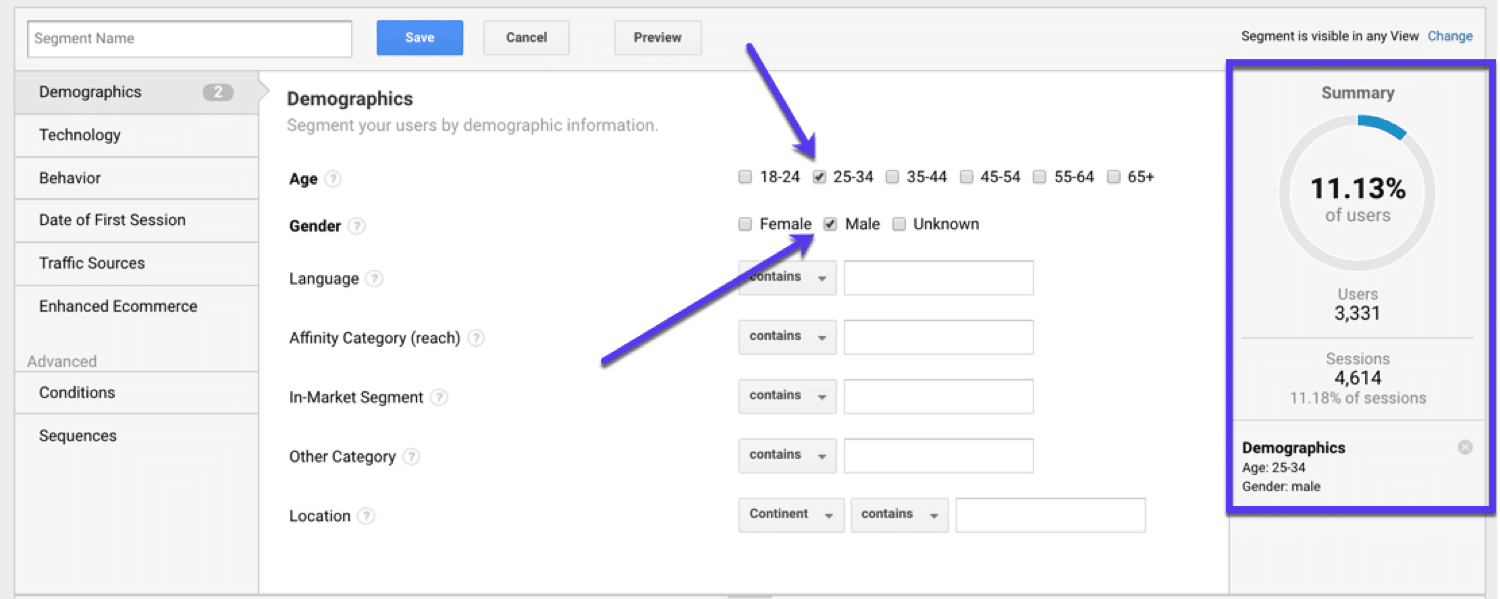
As you begin to apply filters, you’ll see the summary (to the right) start changing. This shows you the percent of users you have segmented as well as the user and session data.
For example, here’s what it would look like if I selected Males between ages 25-34:
Maybe you want to drill down even further and segment by 25-34 Males who visited your site via SEO (aka from Google).
Go to Traffic Sources and select google in traffic source:
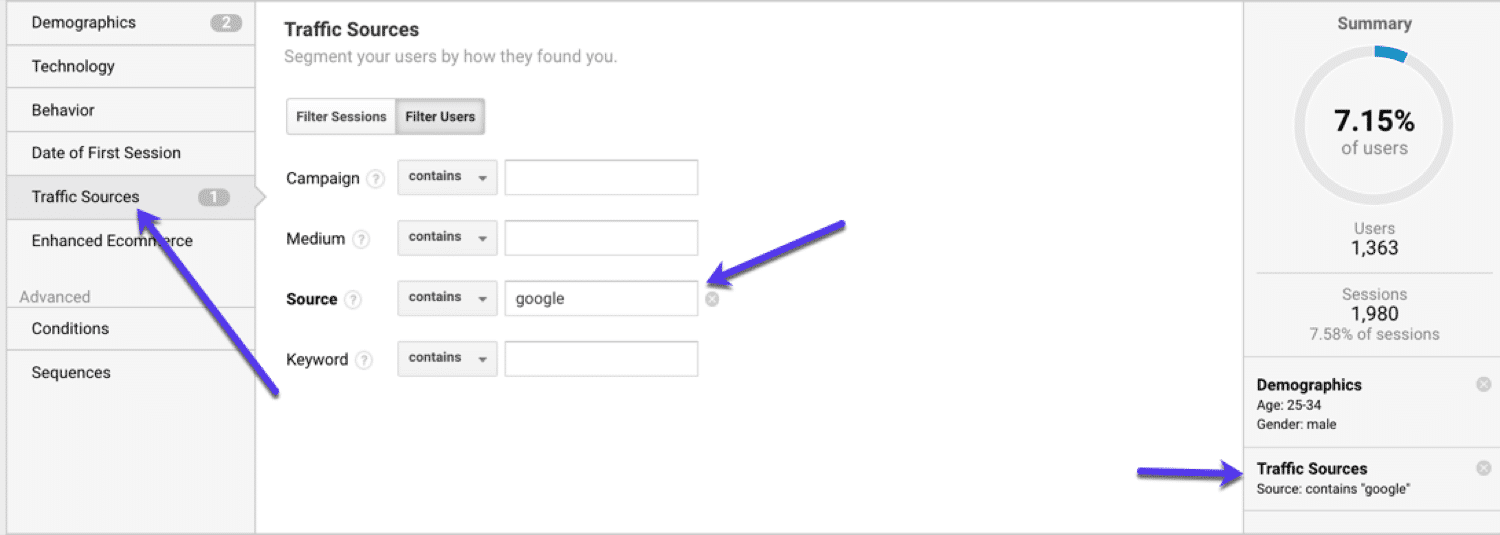
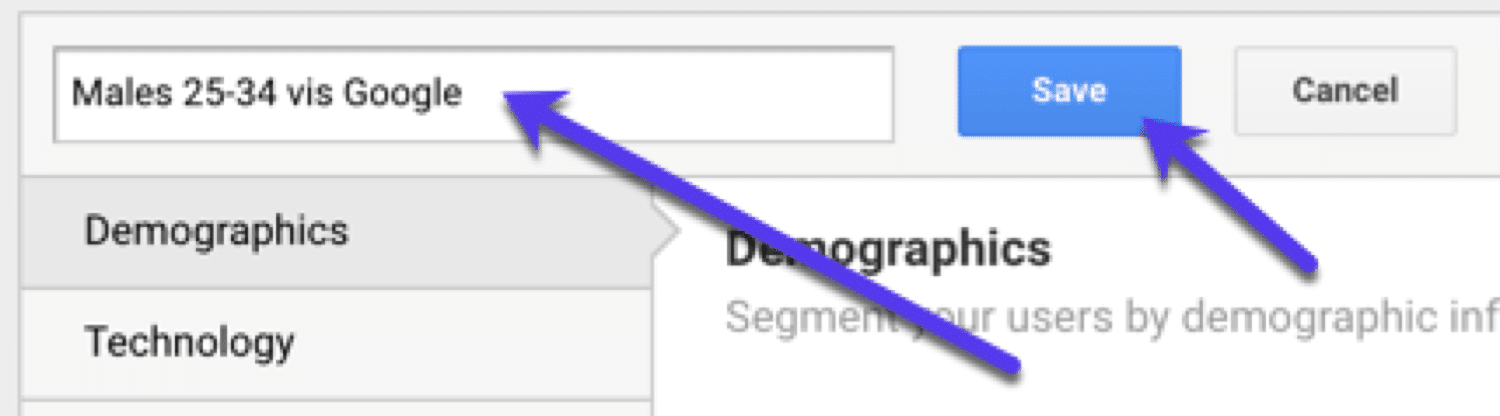
Once you are happy with your segment, give it a name and save it:
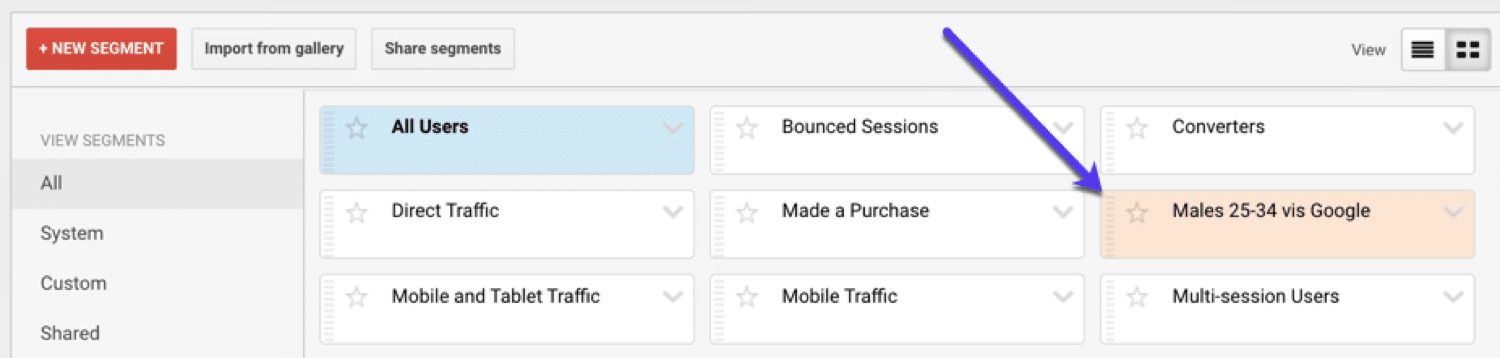
Now, when you apply a segment, you’ll be able to apply this custom one you just created:
Need more help setting up segments? Check this out: Google Analytics Advanced Segments Explained.
This video shows you how custom segments can help you to break down your existing traffic and get a better view of your data.
3. Track Your Goals (And Use Conversion Funnels)
A goal is a completed activity (conversion) that contributes to the success of your website. It can be based on destination, event, duration or pages/screens per session.
Setting up goals allows you to better understand the ROI (return on investment) of your site. By tracking goals you can understand what is working on your site and what needs improving.
How to Setup Goals in Google Analytics
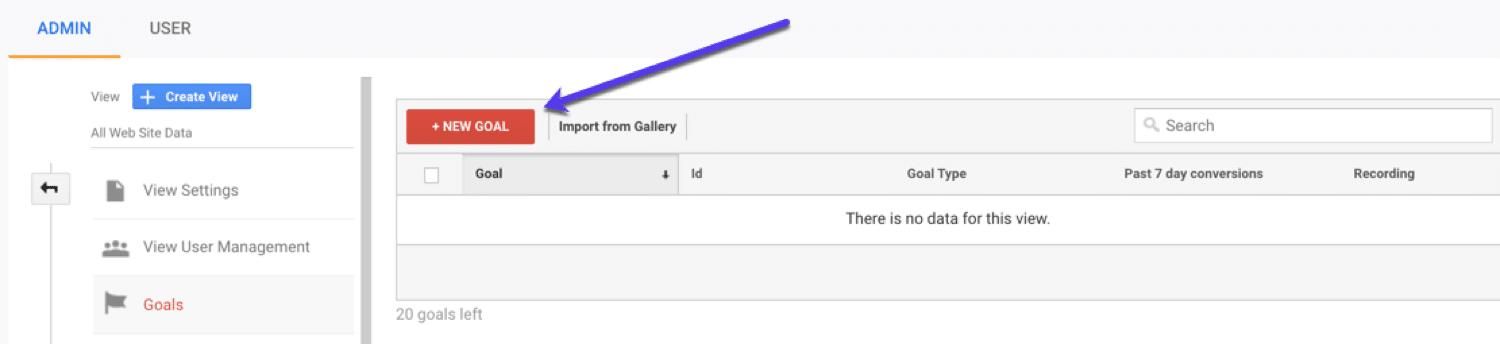
To set up goals, got the Admin section of Google Analytics and then navigate to Goals:
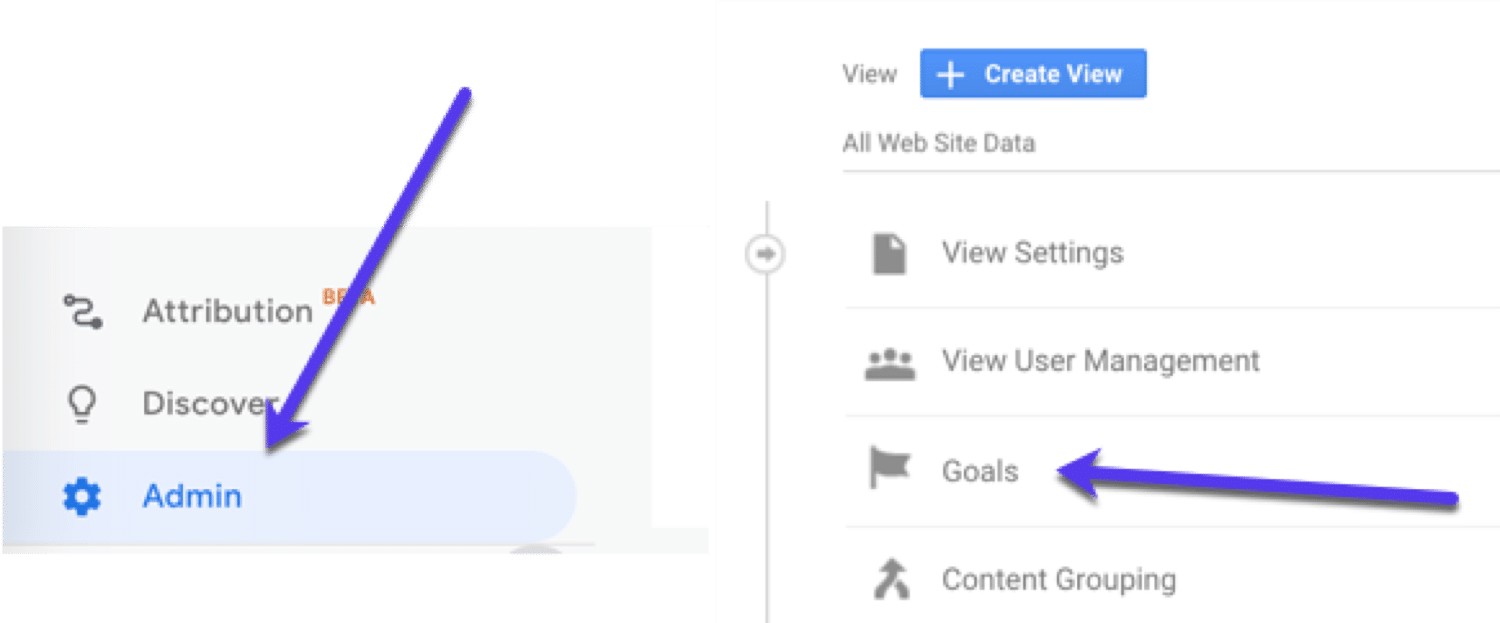
Now you’ll be able to add a new goal:
Select the most appropriate description of your goal from the next section. There are a few choices here, if you’re not sure, you can just select ‘Custom’.
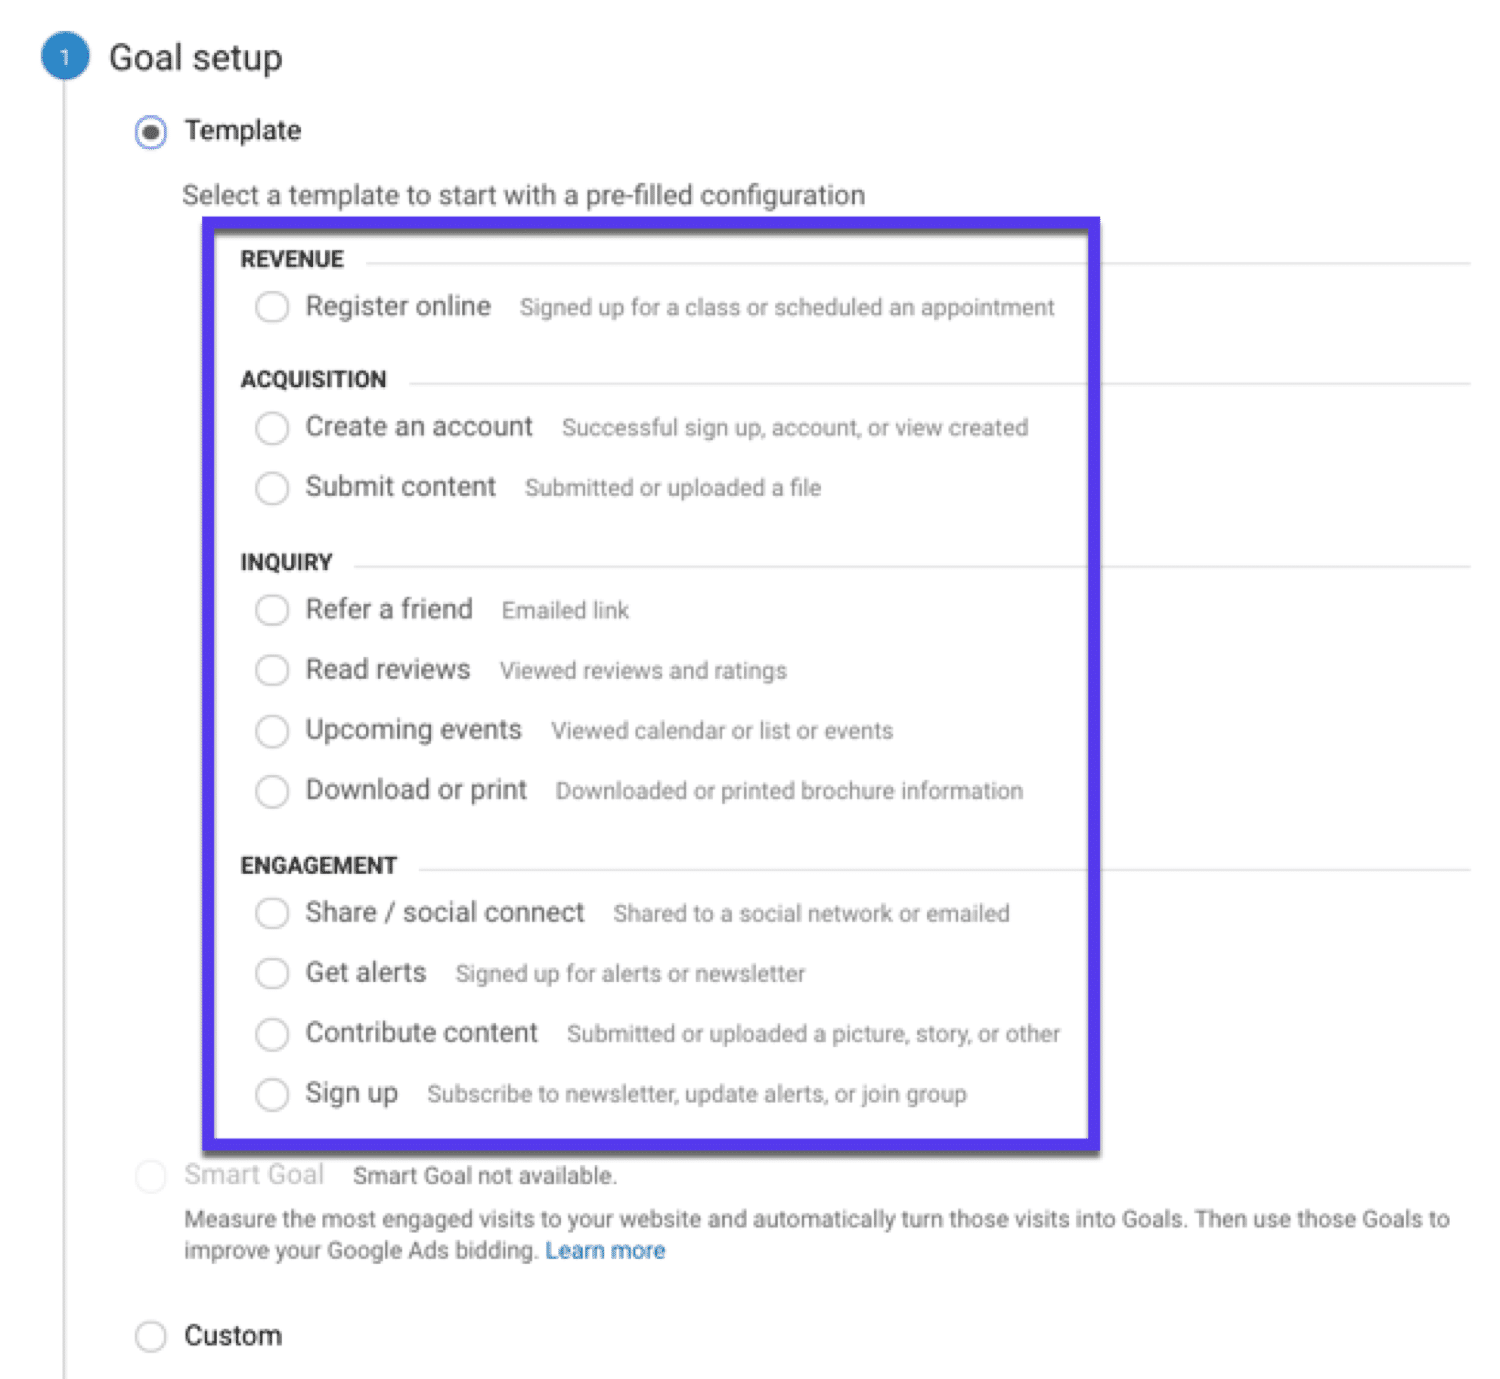
Next, you’ll need to give your goal a name. Give it something descriptive so that you know at a glance, what you are tracking.
The steps for setting up goals depends on what you want to track. I suggest watching this simple walkthrough and deciding on what method is going to work best for you:
4. Find Your Top Converting Pages (And Improve Them)
You’ve built enough traffic so that people visit your site. But do you know what is better?
Converting them into customers.
Using Google Analytics, you can find out which pages bring in the most traffic and conversions and then work on improving them to bring in even more.
Here’s how to find you top converting pages:
Go to Acquisition > Search Console > Landing Pages and select a time frame (aim for at least 6 months).
Now you want to sort the table by a conversion goal. Assuming you’ve got goals set up, pick a conversion (dropdown top right) you want to investigate.
For example, let’s say we are interested in the people that complete a contact form on our site. Select that goal and then sort by that goal:
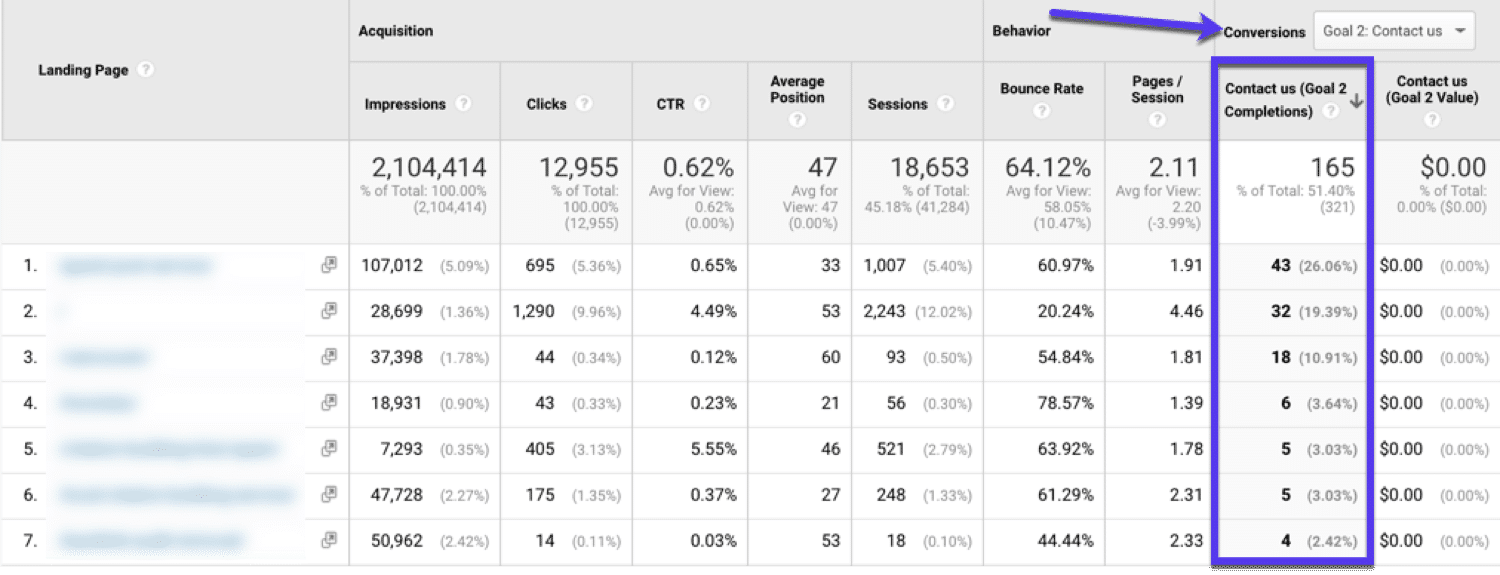
This will show us the top converting pages for that goal.
Now what? Well, now you need to try and improve that page’s conversion rate.
Here are a few things you can try:
- Look at the keywords that page ranks for and then compare against other ranking pages.
- Check how many backlinks the top-ranking URLs have using Ahrefs’ free backlink checker.
- Check what queries drove little traffic to your pages in Google Seach Console and update those pages with these new terms.
- Look at the results in Google and compare your site against your competitors.
- Use our SEO guide to make sure you aren’t missing anything important.
5. Find Low Hanging Fruit Pages to Improve
If you are using SEO to get people to your site, you are playing the long game.
You need to follow best practices (it’s easier if you use an SEO plugin), make sure your site is error-free, and create evergreen content to see your site gradually climb up the search engine rankings.
However, there are some things you can do for faster results.
In this case, your low hanging fruit targets are pages on your website that will see an uplift in traffic with just a few tweaks. These will be pages that are appearing on page 2 of Google and just need a bit more work to bring them to page 1.
But how do you find these pages? You need to connect Google Analytics to Google Search Console first.
Then, go to Acquisition > Search Console > Queries to see which search terms (aka keywords) are sending the most traffic to your site. Then click on Advanced:
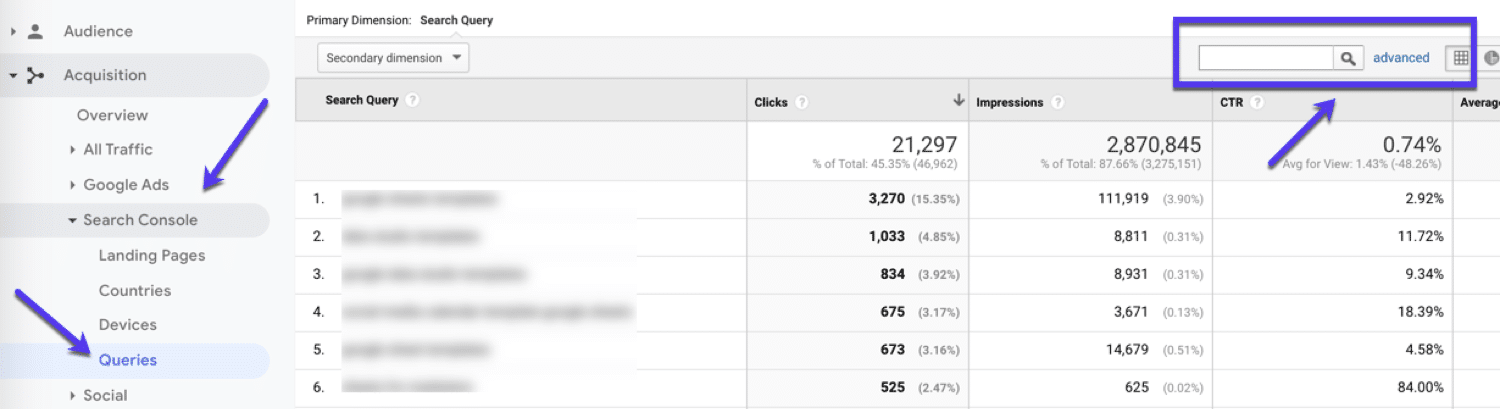
Using the Advanced filter, select Average Position as your metric and add Greater than 10 and hit Apply :
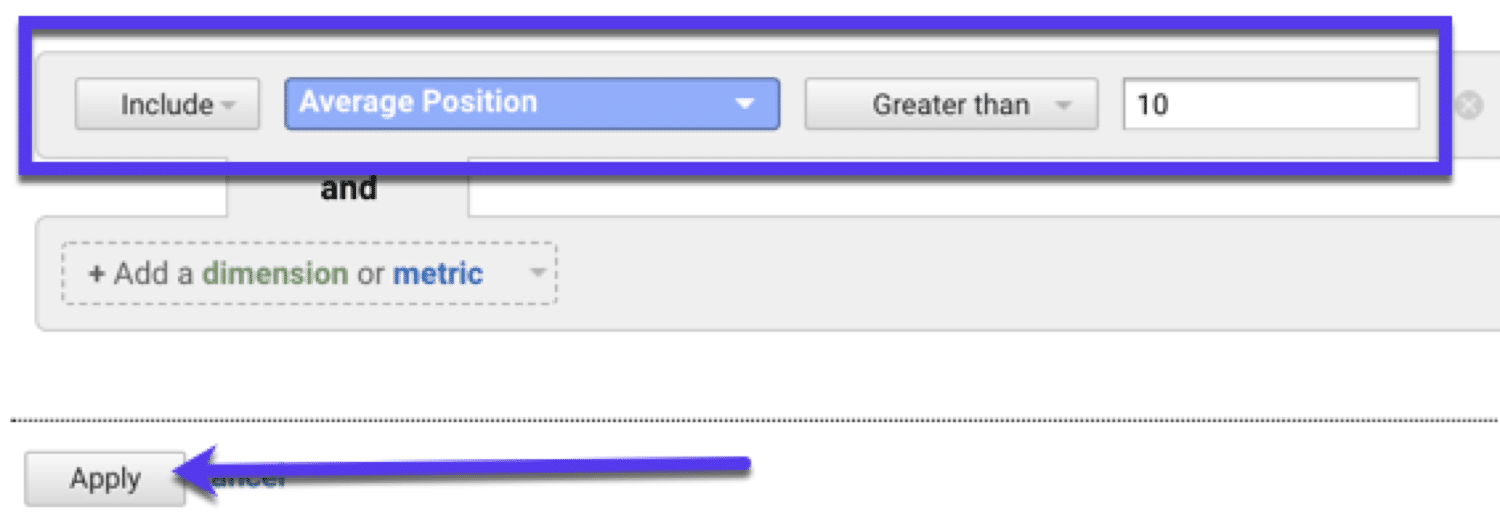
What will this show you?
This will show you pages that are ranking on page 2 (aka your low hanging fruit keywords):
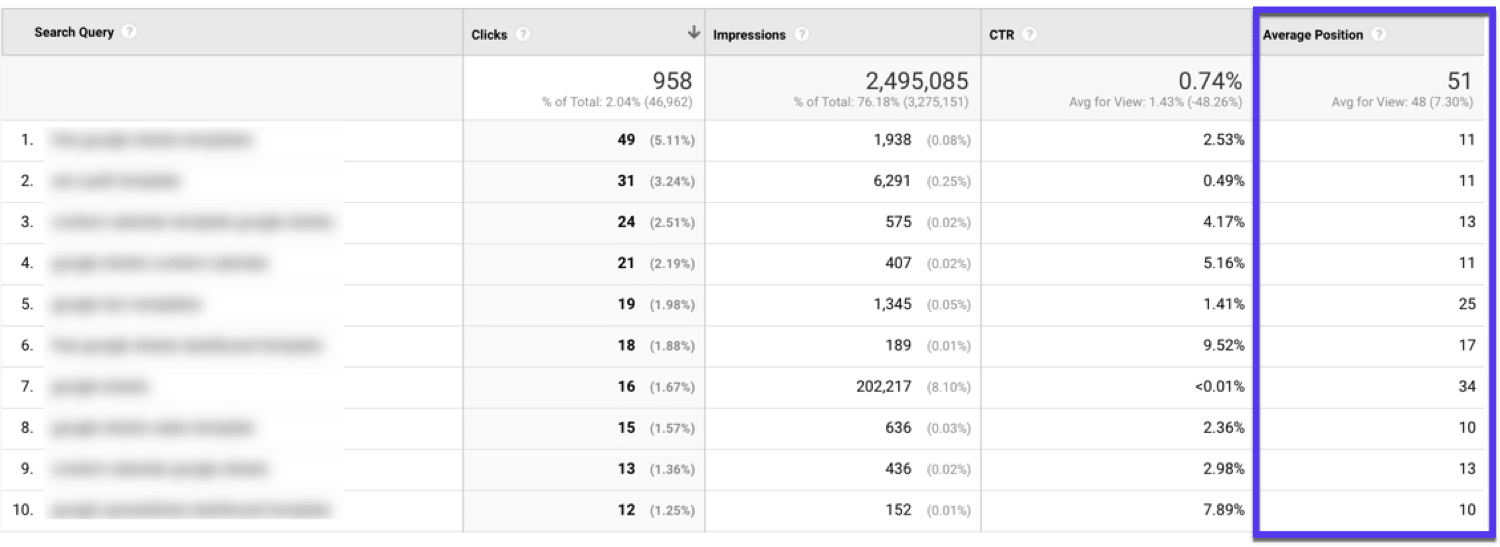
But what you really want to look at here is the relationship between clicks and impressions.
If you need a refresher:
- Impressions = the number of times your URL appears in search results
- Clicks = the number of times someone clicks your URL in search results
Now your clicks are going to be low as these are pages ranking on page 2 of Google. And let’s be real, no one goes to page 2 on Google.
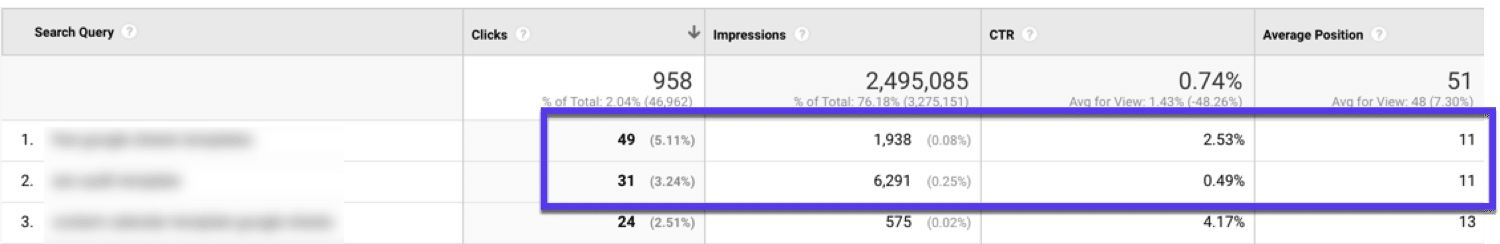
But if you’ve got high impressions, this means you could be getting more traffic if you just improved your position:
6. Uncover Underperforming Pages (to Boost Traffic)
It’s not always about finding the good stuff on your site. Sometimes you need to identify your worst performing pages and improve them.
Using Google Analytics, you can find pages that have declined and then republish them to regain their former glory (hopefully).
Here’s how:
Go to Acquisition > Search Console > Landing Pages and select a time frame (aim for at least 6 months) and then compare that to the previous year:
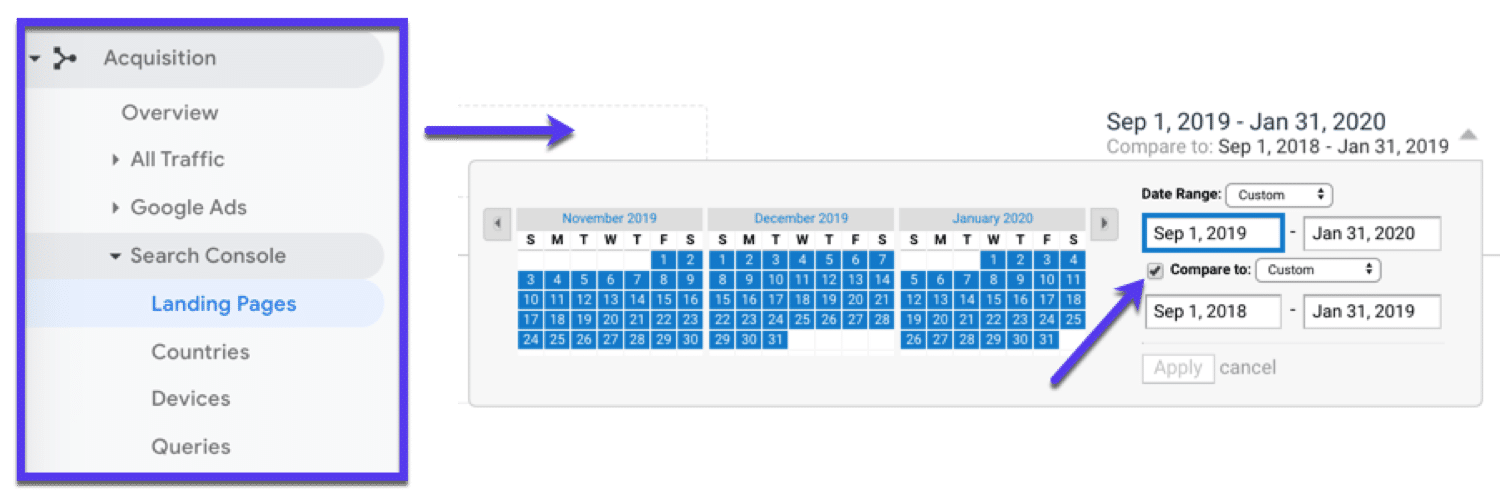
If you have a pretty new site, don’t worry if you can’t compare it to the previous year. You can select a date range you do have data for.
Now, sort by clicks:
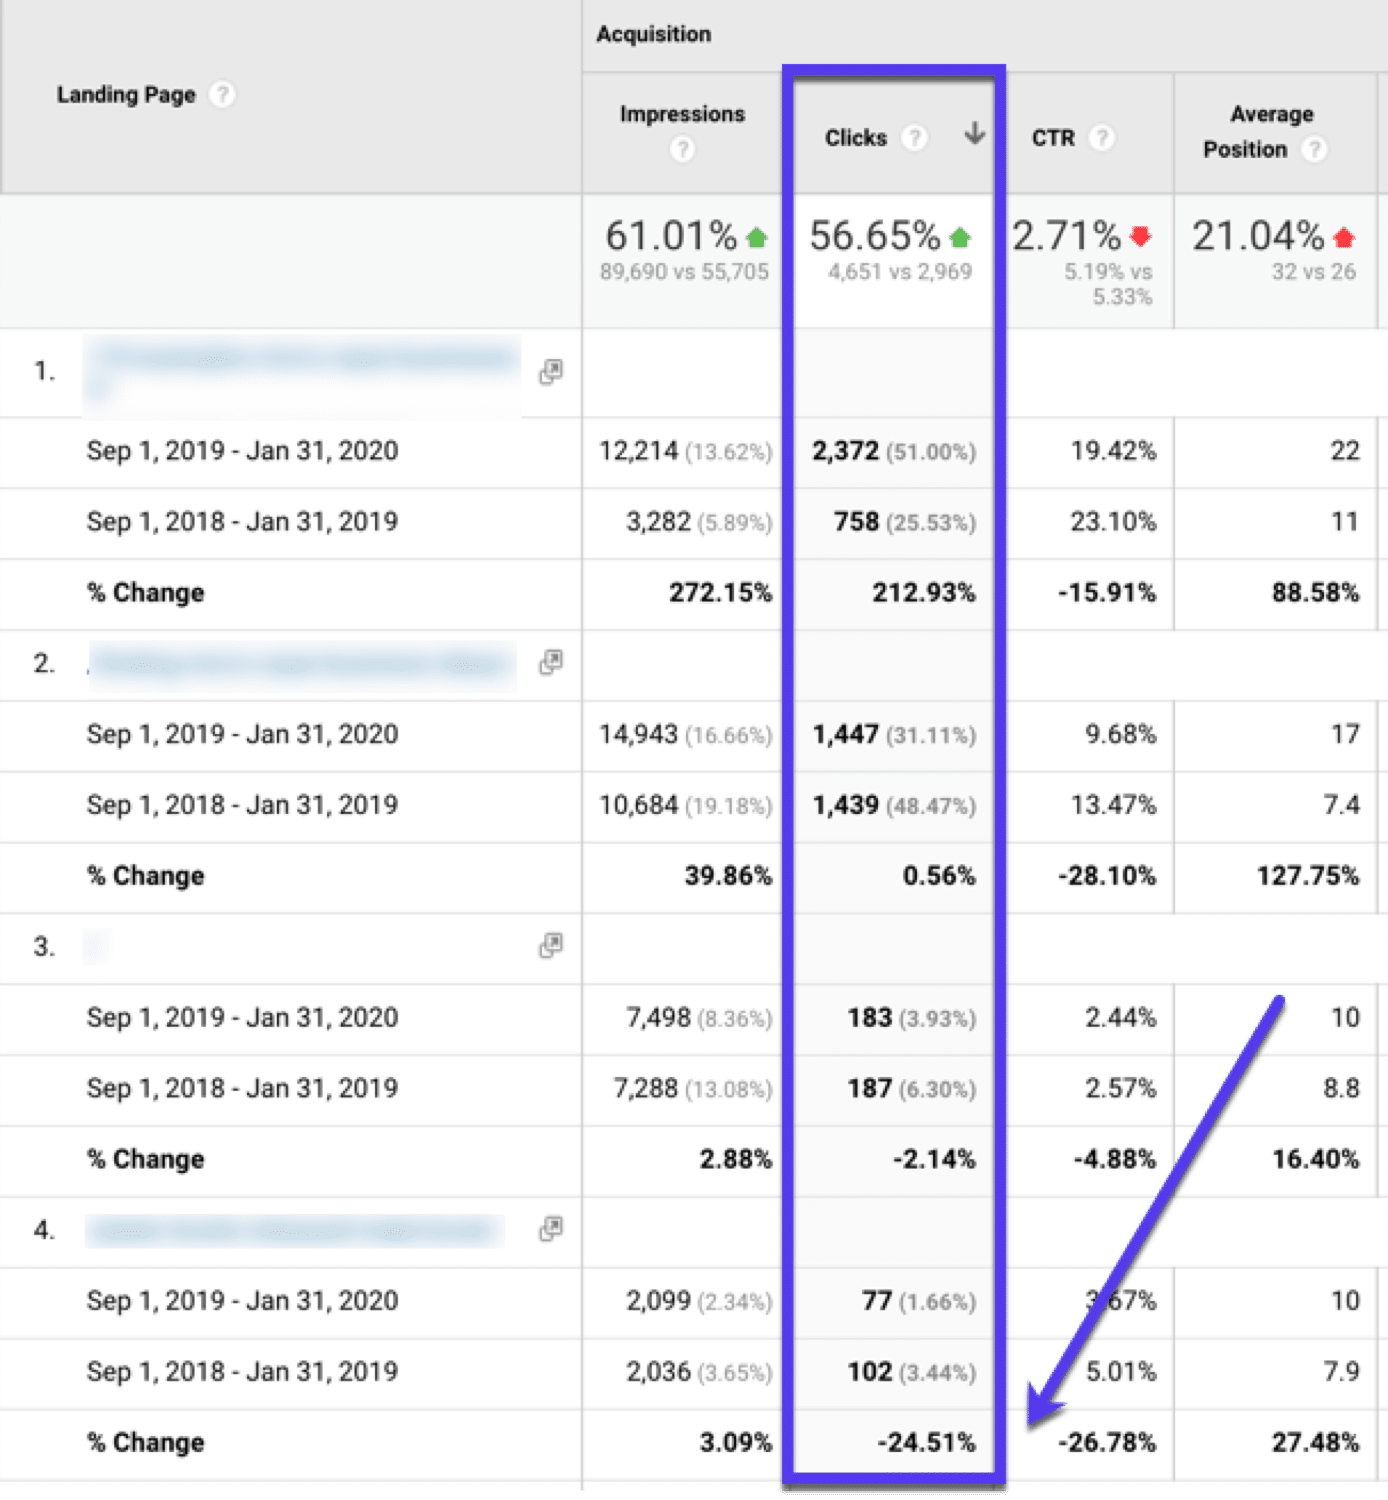
Scan through this and look for pages that have dropped significantly
Then look for reasons why they have declined and think of any updates you can make or ways you can increase traffic to them. This approach works also for optimizing the conversion rate.
7. Find (And Fix) Pages People Aren’t Engaging With
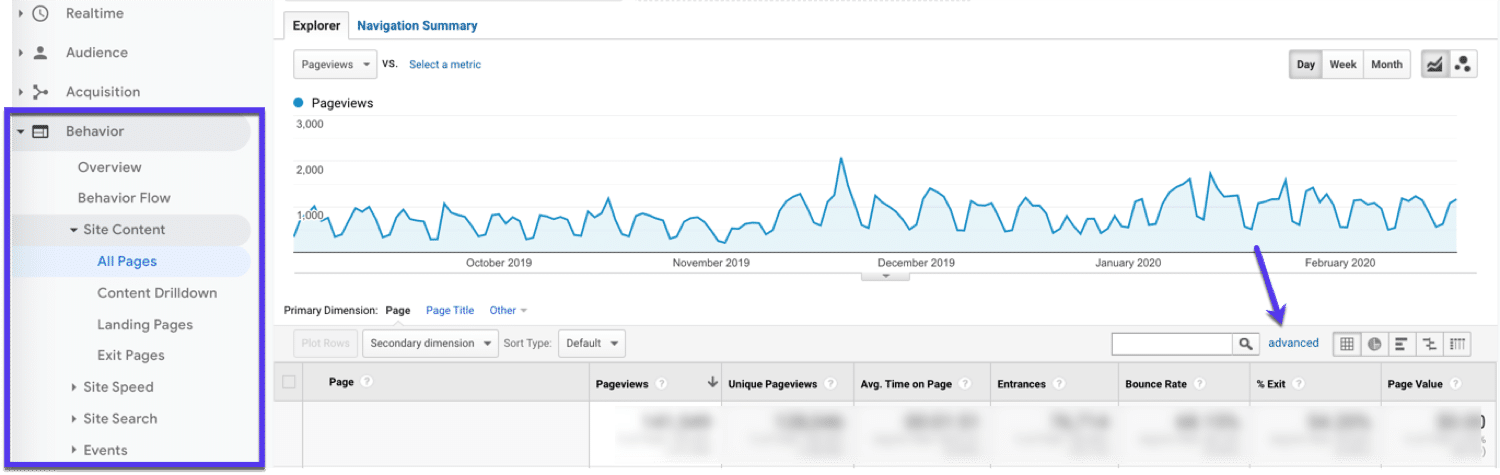
In Google Analytics, go to Behavior > Site Content > All Pages and click on Advanced:
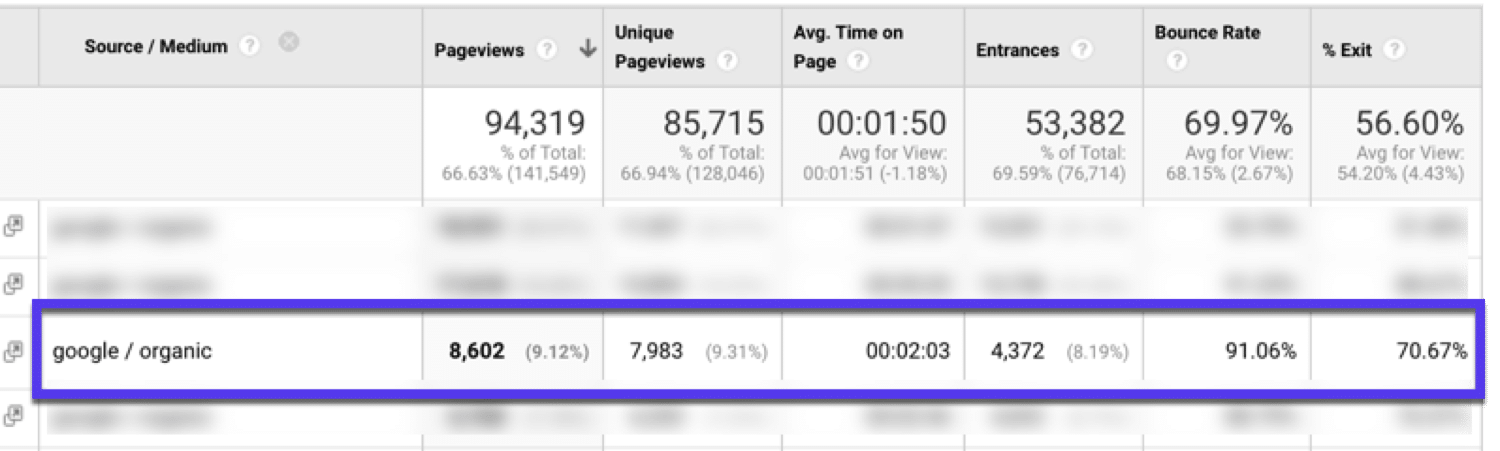
Now we want to add a Source / Medium dimension and add containing google / organic:
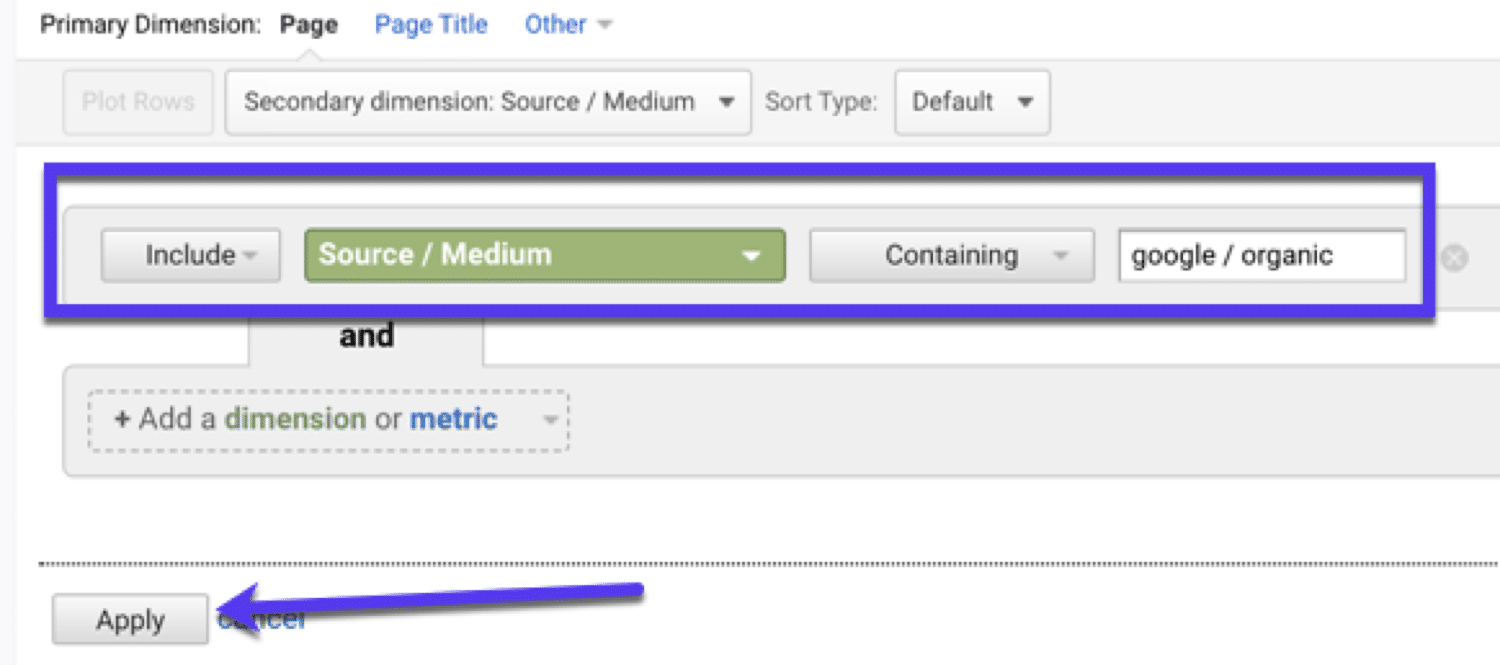
This will show your top-performing pages from Google only.
Now sort your data by the most views and pay attention to the Bounce Rate and % Exit columns:
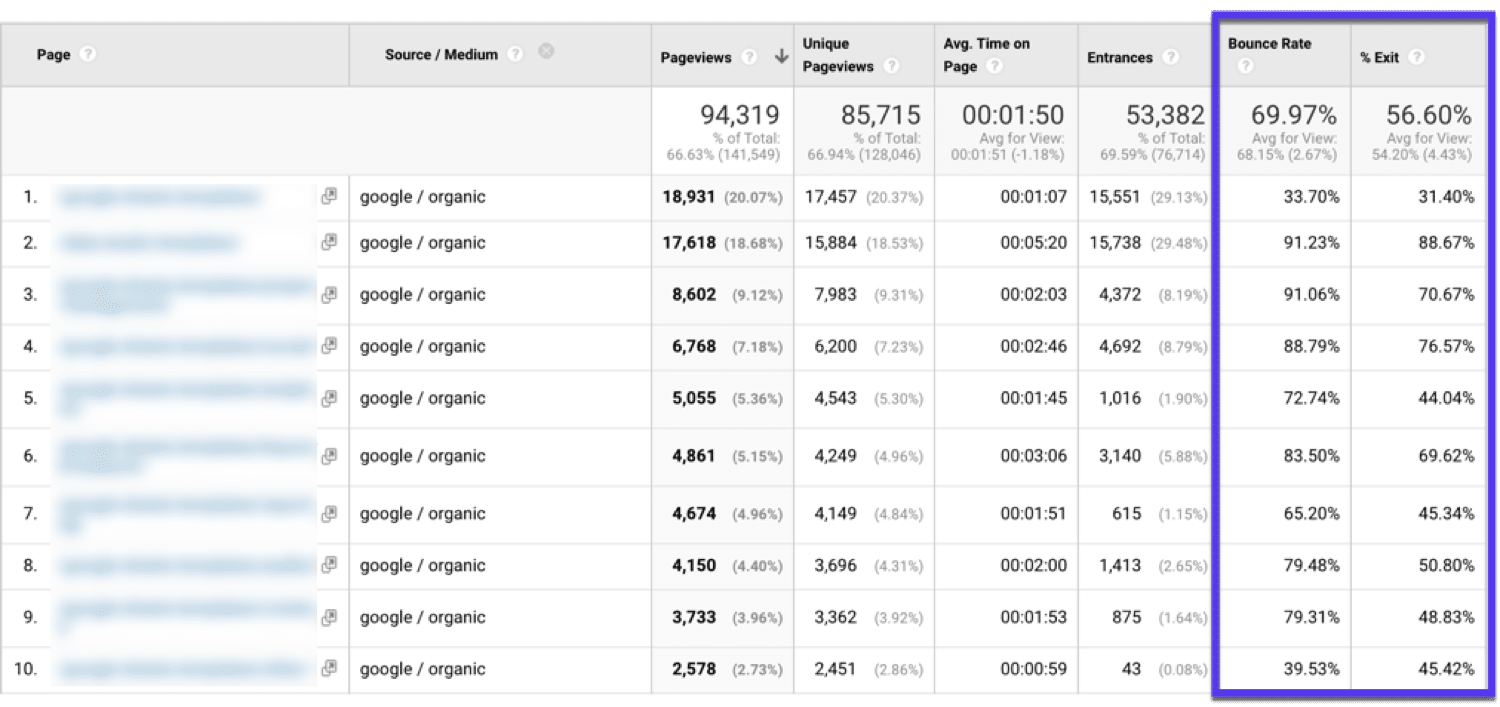
You’ll typically see pretty high bounce rates from search traffic to blog posts, so don’t worry too much about it.
What you want to look for are pages with both a high Bounce Rate and a high % Exits. Pages like this:
If you are seeing something like this, your page needs improving. There are lots of possible things you could do here to improve this number. That’s down to you to test.
But here’s a few things that could be holding your pages back:
- Your content doesn’t meet the search intent of users searching on Google.
- Your content is outdated and could do with a refresh.
- Your content doesn’t look good or maybe it isn’t mobile-friendly.
- Your website is loading slowly (so do some speed optimization)
- Your content isn’t in-depth enough.
Also, be sure to check out our guide on how to reduce bounce rate for more tips.
Attribution Models and Google Analytics
Wouldn’t it be great if you understood what steps a visitor on your site took before they converted? Thankfully, you can…
Enter: attribution models.
What are Attribution Models?
Attribution models are used to give credit to different stages of the customer journey. Think of them as a framework for seeing which marketing channels result in the most conversions.
By using attribution models, you can get a better idea of how each marketing channel is performing or, as Google defines them:
An attribution model is the rule, or set of rules, that determines how credit for sales and conversions is assigned to touchpoints in conversion paths.
6 Different Types of Attribution Models
So, what model should you use? There are different types of attribution models, each with their own benefits and drawbacks.
Here are some of the most common types of attribution models:
- Last Interaction Attribution – all credit goes to the last touchpoint before a visitor converts.
- First Interaction Attribution – all credit goes to the first action taken by a visitor in the conversion process.
- Last Non-Direct Click – gives credit to a single interaction, but removes any direct interactions (like a user going typing in your URL).
- Linear Attribution – gives equal credit to each touchpoint along the visitor’s journey.
- Time Decay Attribution – gives touchpoints closer to the time of conversion more credit (vs older touchpoints)
- Position-Based Attribution – (also called U-shaped attribution) credit here is equally assigned. In Google Analytics, the first + last touchpoints get 40% of credit and then 20% is distributed equally between the rest.
In Google Analytics, you can also create custom attribution models. With a custom model, you get to choose your own set of rules for giving credit to touchpoints.
Find out more about building a custom attribution model here:
Now, attribution models can be pretty complex. So let’s pick out three of the most popular (and useful ones) you can use.
First Interaction Attribution (With Example)
All credit goes to the first action taken by a visitor in the conversion process.
First Interaction attribution is pretty simple, which is part of its appeal. If converting visitors quickly or bringing new top of the funnel customers in is your goal, this is a good model to use.
Just keep in mind this model ignores everything that happens after the first interaction. So you could potentially be missing out on important marketing channels interactions.
First Interaction Example Explained:
- A visitor finds your website via a referral site, like Twitter.
- Twitter as a channel will get credit for any sale or conversion that happens AFTER that interaction.
- If a week later, the same user clicks on a paid ad taking them to your site, the credit is still given to Twitter.
Last Interaction Attribution (With Example)
All credit goes to the last touchpoint before a visitor converts.
Similar to First Interaction, Last Interaction gives 100% of the credit to the last click (interaction).
With many people viewing sites across multiple devices and browsers it can be difficult to track their entire journey accurately. In this way, Last Interaction is pretty accurate.
The drawback here is that everything that occurs BEFORE that final interaction is ignored. So you may be missing out on understanding important interactions (touchpoints) that happened before that last-click.
Last Interaction Example Explained:
- A visitor clicks on one of your Google Ads, then leaves.
- A few days later, they research you and go to your website via a search engine.
- While there, they sign up to your email list.
- A few days later again, they type in your website, go there directly, and make a purchase.
- Last click would be attributed to the DIRECT visit here.
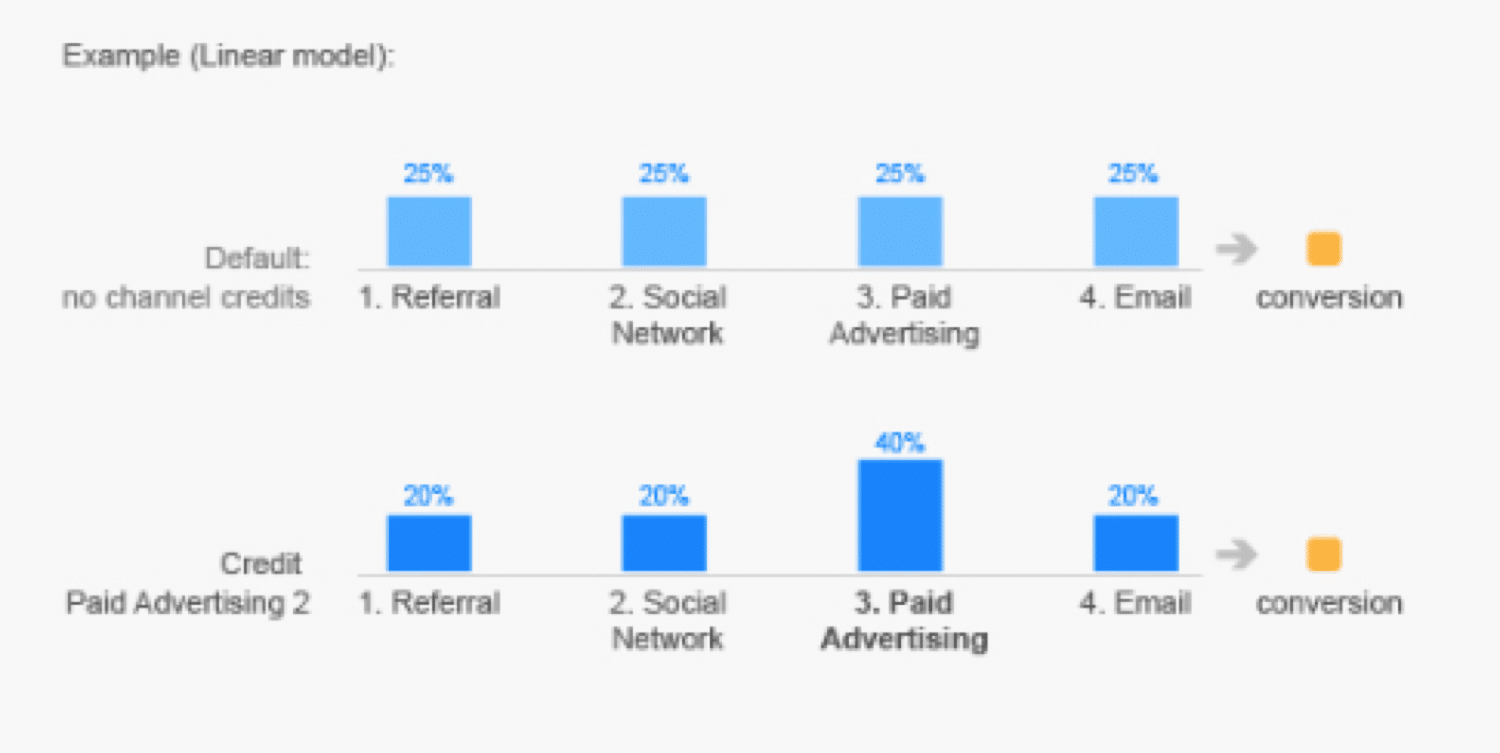
Linear Attribution (With Example)
Gives equal credit to each touchpoint along the visitor’s journey.
Linear Attribution is a more balanced look than First & Last Interactions. By splitting up the credit, you can see how your whole marketing strategy is working.
However, because it assigns equal importance to all channels, you may be getting a skewed view of how things are converting.
Linear Attribution Example Explained:
- A visitor clicks on one of your Google Ads.
- Then they research you and go to your website via a search engine.
- While there, they sign up to your email list.
- A few days later, they type in your website, go there directly and make a purchase.
- Linear Attribution would divide the revenue by these four channels (Ads, Organics, Email, and Direct) giving 25% credit to each.
Comparing Attribution Models
Not sure which model to use? You can use the MCF Model Comparison Tool in Google Analytics to compare attribution models and decide which is best to use.
Just pick an attribution model in the tool, and the table will show the number of Conversions for each channel (according to that model).
Attribution models aren’t perfect at all. Nevertheless, they can bring up a more detailed view of how your visitors and users engage with your site.
Google Analytics FAQs
Here are answers to some of the most frequently asked questions about Google Analytics:
How Much Does Google Analytics cost?
Google Analytics is free to use. However, there is an enterprise solution called Google Analytics 360 and this will cost you around $150,000 a year. Don’t worry: the standard version is more than enough for most people.
How Much Is Google Analytics Certification?
The Google Analytics Individual Qualification (IQ) test is a measure of proficiency in Analytics and it is completely free. You can find out more about it on Google’s official Analytics IQ support page.
How Often Does Google Analytics Update?
According to Google, Google Analytics’ site statistics latency is 24-48 hours. However, Google doesn’t specifically state how long it takes to update all the information that may be associated with your account.
What Is Google Analytics Property Tracking ID?
The property ID in Google Analytics is the identifier, which is associated with your account, and what it’s used by Google Analytics to collect your site data. You can find it by going into the Admin panel and select ‘Tracking code’:
How Does Google Analytics Work?
Google Analytics works by adding a bit of JavaScript code to pages on your website. When a visitor lands on your website, this JavaScript code references a JavaScript file and is tracked in for Analytics.
Where to Put Google Analytics Code?
The short answer is: on every page you want to track.
Don’t worry, though, you don’t need to manually copy and paste the code onto every single page. Check out this in-depth guide on how to add Google Analytics to WordPress sites.
Summary
Data empowers you. If you don’t track things on your website, you’re left in the wild and all your decisions will be based on gut feelings. That’s not always the best approach.
Google Analytics is a powerful tool that gives you access to a lot of actionable data that you can apply to grow your website. And when paired with other analytics, it’s really a must-have for growth.
To learn out about Google’s latest version of Google Analytics, check out our guide to GA4.