
It’s official: Google Analytics 4 (GA4) has replaced Universal Analytics (UA).
Google has now officially switched off UA. This means that as of July 1, 2024, all data in UA was deleted. To ensure your important data is being tracked, it is essential to have a GA4 property in place.
If you’re having a hard time adjusting with the shift to GA4, our deep-dive into GA4 covers everything from essential steps required to setup an account, to exploring the exciting new features available that can help you to gain valuable insights about your site visitors. We also dig into the main differences between UA and GA4, and give some useful tips on how to make sure your data is properly tracked and available for your reporting.
So let’s jump in and embrace the change to GA4!
What is GA4?
GA4 is the latest generation of Google Analytics, which provides a more privacy-focused approach to tracking users across websites and apps, relying less on first-party cookies to remain compliant with future developments in privacy regulation policies.
Google has achieved this by upping its game in machine learning, using modeling to “fill in the gaps” when users choose not to accept cookies, essentially allowing GA4 to continue providing insights into user engagement, while keeping their data anonymous.
When was GA4 first launched?
Google first announced the launch of GA4 in July 2019, which was only available in beta at that time. This was followed by a hard launch in October 2020, when it became the default platform for all new GA properties.
While GA4 took some time to be fully adopted by many, as businesses became more aware of privacy, questions were being raised about how well UA was set up to deal with user data.
Why did Google update UA to GA4?
Businesses were relying on insights from Google Analytics for more than a decade, measuring user engagement to get an understanding of their online performance and using the data to make informed decisions.
While GA4 provides similar insights, Google completely overhauled UA and its underlying data models, making it impossible to migrate data from UA to GA4.
This caused an uproar in the digital marketing community, as many website owners had been collecting data and tracking seasonal trends for years. The prospect of starting from scratch was far from ideal.
The General Data Protection Regulation (GDPR)
With the introduction of the General Data Protection Regulation (GDPR) in 2018, businesses were forced to take privacy more seriously and get a better grasp of how they handled their users’ data.
Google’s UA became a focal point as an analytics tool that collected extensive user data, leading to increased publicity and growing concerns that its use might violate GDPR regulations.
GA4 and the future of analytics
GA4 is Google’s response to a cookieless future, claiming to “fill in the gaps” for those users who opt out of tracking consent, using AI and machine learning to analyse existing data to make predictions on user behaviour.

What does this mean for Google Analytics users?
UA was shut down on July 1, 2024, with all historical data being deleted.
If you started using Google Analytics after October 14, 2020, it’s likely that your property was already created with GA4. UA was the default for all properties created before that.
If you didn’t get around to creating a GA4 property and you didn’t opt out of automatic property, Google should have already created a GA4 property for you.
GA4 vs UA: Key differences
Google first introduced UA in 2012 with the goal of providing a more robust approach to Google Analytics users for collecting data. Unfortunately, the platform was built on foundations that were simply not set up for the web as we know it today.
GA4 is a complete overhaul of UA, built with a focus on tracking complete user journeys across multiple devices, allowing it to follow user sessions as they move between different devices.
1. Data models
Data models are used to instruct Google Analytics on how to manage the information gathered from users on a given website. One of the biggest differences between GA4 and UA is how these data models work, which is the main reason why Google wasn’t able to seamlessly migrate users from UA to GA4.
The UA data model used sessions and pageviews, which were first developed over 15 years ago, at a time when smartphones and tablets had not yet fully emerged.
The session-based model collected data from user interactions that occured within a specific time frame. This system was always flawed, since a single user could trigger several goals within a single session, but only one conversion was counted.
The GA4 data model uses events and parameters and has been built with cross-platform tracking at its core, which means you can expect to see more accurate reporting as your users switch between devices.
The end of four attribution models
Google also announced the sunset of 4 attribution models in Ads and Analytics:
- First click
- Linear
- Time decay
- Position-based
While the last-click model will still be available (if the advertiser manually selects it), data-driven attribution is now the default attribution model.
According to Google, these models aren’t built to handle evolving consumer journeys. On top of this, very few conversions in Google Ads were using one of the four models, so Google decided to keep things simple by removing these options completely.
Why is my traffic different in GA4?
As the methods for gathering user data changed, it’s unlikely your historic traffic data will match up between the two versions of Google Analytics, which is why there was no easy way to migrate from UA to GA4. The same goes for other metrics, including bounce rate and conversions.
2. Data privacy
As websites continue to evolve and users become more conscious of data privacy, often opting out of session tracking, Google Analytics needed to implement significant changes to continue providing relevant insights to website owners.
GA4 addressed some of these issues by using AI to create models based on the available user data. This helps provide a good understanding of how users who aren’t tracked interact with websites.
Is GA4 GDPR compliant?
GA4 takes privacy much more seriously than its predecessor, with a number of privacy settings that can be configured to limit tracking. However, the fact remains that Google still stores user data on US-based servers, which, according to Matomo, is against General Data Protection Regulation (GDPR). This effectively means that all websites collecting data from users based in the EU are not GDPR compliant.
There have already been several high-profile cases in Europe that led to websites being forced to remove Google Analytics in order to follow GDPR guidelines. This has caused many website owners to consider other Google Analytics alternatives.
In fact, a Twitter poll from SEO guru Aleyda Solis suggested that nearly 34% of those that took part were considering ditching Google Analytics for another analytics tool.
The Italian Data Protection Authority (Garante della privacy) found that Google unlawfully transfers user data to the US, including IP addresses, browser details, operating systems, screen resolutions, selected languages, and the date and time of website visits. This puts websites in violation of GDPR laws.
Google Analytics: 4 features you need to know
Not all features from UA were included in GA4, but there are some shiny new features you’ll be pleased to hear about.
1. GA4 conversion tracking
With UA, goals were configured using Events, Destinations, and Duration. For example, you could create the goal “Form Submit” and associate it with an event that was triggered when a visitor submits a form. Alternatively, you could add a “Checkout Completion” goal, which was triggered when a visitor landed on your checkout page.
GA4, on the other hand, tracks all conversions using events. You can set any events that are important to your business as conversions.
Difference between GA4 & UA conversion tracking
UA was limited in how it counts conversions, recording only one conversion per session for each goal. This means that if a user submits a form more than once during a single session, UA conversion tracking would only show a single conversion. The number of goals that could be set up per View in UA was also limited to 20.
GA4 dropped ‘goals’ and now tracks conversions, increasing the maximum number of conversions per property to 30 (50 for Google Analytics 360). While this might seem like an upgrade, it was previously possible to have 20 goals for each View. Therefore, 30 conversions may not have been sufficient when migrating UA properties containing multiple Views with multiple goals.
GA4 conversions can only be created using event-based tracking, which is based on Pageviews, Scrolls, Outbound clicks, Site search, Video engagement, and File downloads.
To set up conversion tracking in GA4, you just need to associate a specific event with a conversion.
GA4 also counts all conversion events, regardless of how many conversions occur from a single user in a single session. For this reason, you may notice some discrepancies when comparing GA4 conversion data with UA.
How to add conversions in GA4
Start by clicking Configure and then Events from the left menu, then select all of the events that you want to track as conversions, marking them as conversion events.
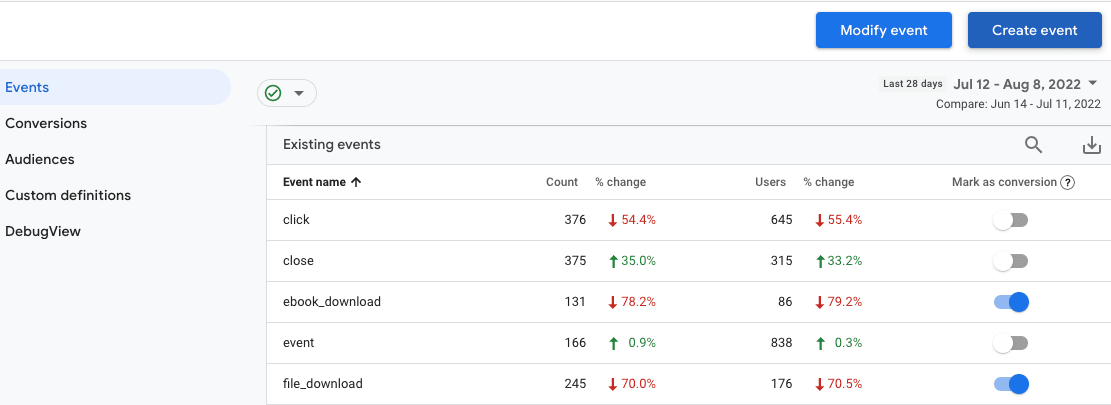
Now click Conversions to view the list of conversions that you added.
Much like UA conversions, GA4 conversions are only tracked from the time they are created, so you won’t see new conversions in your historical data.
How to create Custom Conversions in GA4
To create a custom conversion in GA4, you can either select Create event to create a new event or Modify event to edit an existing event. Make sure to add the event name using the correct casing. Once saved, mark your new event as a conversion.
Check out Google’s detailed guide for more information on setting up custom events.
GA4 conversion rate
You can track the conversion rate of any conversion event using User conversion rate, which is the percentage of users who triggered a conversion event, and Session conversion rate, which is the percentage of sessions in which a conversion event was triggered.
This data can help you to understand how your conversion events are performing, giving you insights to improve conversion rate optimization.
2. GA4 ecommerce tracking
GA4 brings to the table new ecommerce dimensions and metrics that allow you to easily check a product by name and how many times it was purchased (in your country and in others if that’s your case).
Now the platform can also process item-level custom parameters. This means that you can create parameters to collect data related to an item’s color, size, or rating.
Speaking about reports, the Monetization reports in GA4 allow you to track how much revenue was generated from your website, along with additional data to help you understand which areas of your site performed the best. To check the Monetization reports, click Reports from the left navigation and then click Monetization.
The Monetization overview report provides a summary of your revenue performance across your site and app.
The Ecommerce purchases report allows you to see more granular data related to the revenue generated from specific products and interactions with these products.
Find out more about setting up ecommerce event tracking for your websites and/or apps.
3. GA4 reports
GA4 comes with a host of pre-built reports that can be used to track your websites and apps.
GA4 reporting UI
GA4 reports can be found under each section in the left menu but also in the snapshot reports provided in the main Home dashboard. You can expand any of the snapshot reports by clicking the links in each report card.
Each of the reporting sections in GA4 comes with an overview dashboard containing some key reports. These are fully customizable, so you can create reports that focus on the metrics and dimensions that are most important to your business.
In addition to these, you can also add comparisons, applying filters to compare against the default data. This adds additional series to the chart, allowing you to easily compare trends for different segments over time. Each comparison can contain one or more filters (e.g. country, device, operating system, etc.)
Saving reports in GA4
You may have noticed there is no Custom Reports tab GA4. To create custom reports in GA4, you need to head over to the Explore section from the left menu and start a new exploration. You can either create a new report from scratch using the Blank option or use one of the prebuilt templates.
How to create the landing pages report in GA4
We’re all familiar with reports that show visits to specific landing pages over time, whether you’re looking to find your most visited ones during a specified period of time or using filters to drill down to specific landing pages.
While GA4 doesn’t have a landing page report in the default dashboards, it’s easy to set this up.
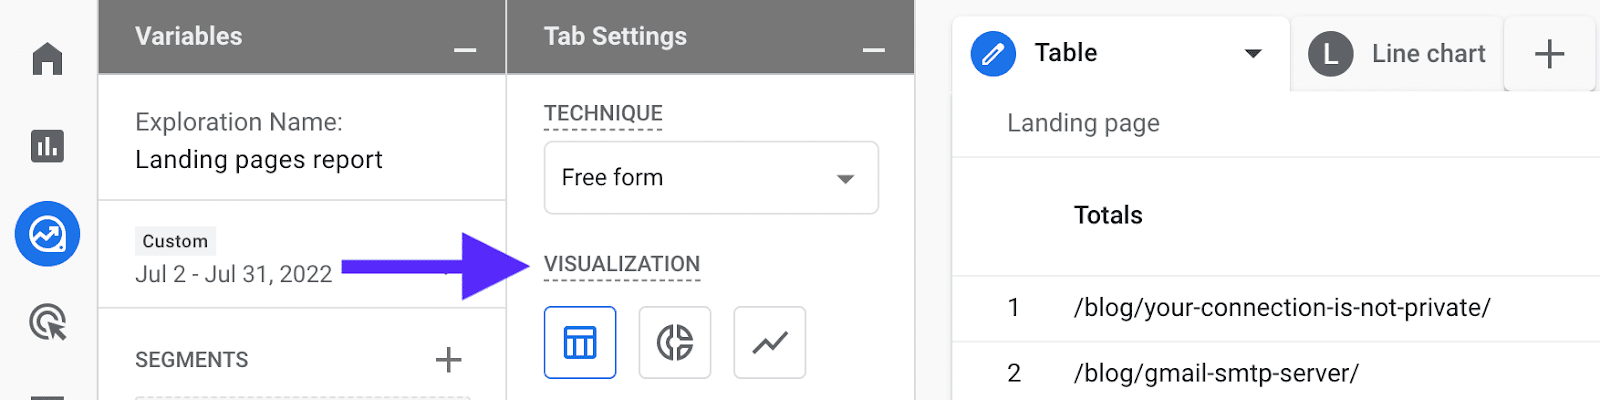
- Click Explore in the left menu, then click Blank to start a new exploration.
- Give your report a relevant name (e.g. Landing pages report), then set your desired time frame.
- Click Dimensions and search for Landing page. Select the checkbox, then click the Import button.
- Click Metrics, then select each of the metrics that you would like to include in your report. For example, Total users, Bounce Rate, Conversions, and Total revenue.
- Double-click each of the dimensions and metrics that you added to move them into your report.
- If you’re looking to filter landing pages to see a specific page or group of pages, scroll down under Tab Settings, then click Filters and choose which dimension or metric you would like to filter. For example, to see all blog posts, you could set Landing page to contains /blog/.

Choosing filters
You can choose the type of report you want (e.g. table, donut chart, line chart, etc.) by selecting one of the options under Visualization.
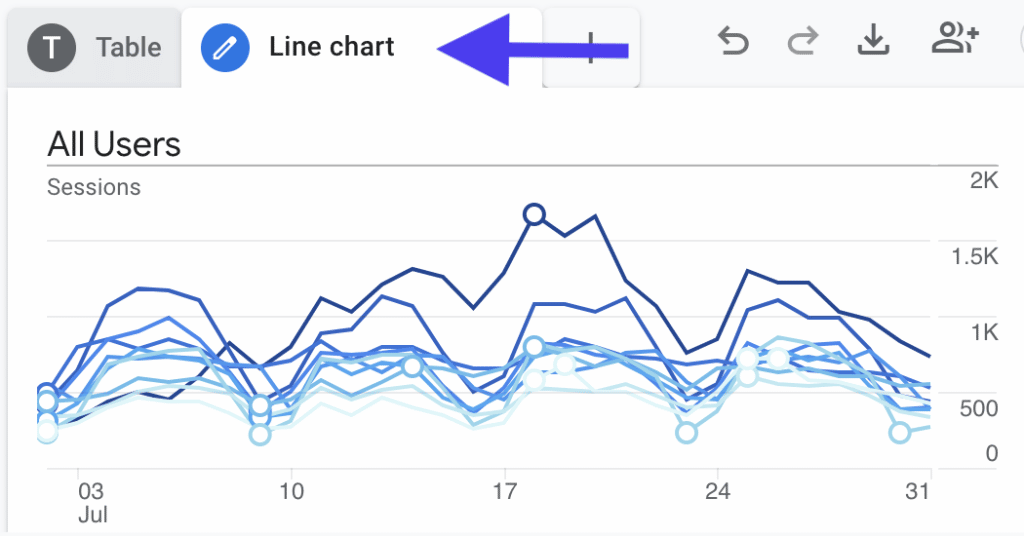
If you want to add more than one visualization (e.g. table and line chart), you can duplicate the first form and switch the visualization for the duplicated report.
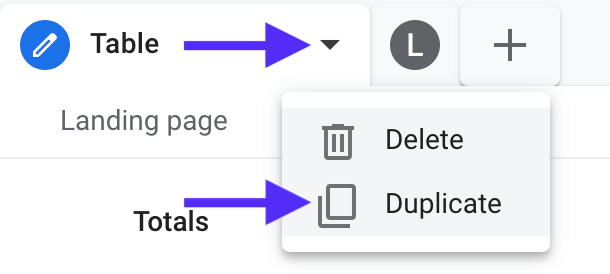
You can then update the form names to give them a relevant title by double-clicking the title.
Funnel reports
Custom funnel reports are available to all GA4 users. It is possible to see each step your users took to complete a desired action. There’s also a new User purchase journey report, which can show you how many users drop off between each step in your purchase funnel.
4. Data Streams
In UA, views allow website owners to create subsets of properties with their own unique configuration settings. In GA4, views have been replaced by data streams.
What are GA4 Data Streams?
Data streams are GA4’s answer to Views in UA. According to Google, a data stream is “A flow of data from your website or app to Analytics.” Data streams are categorized into 3 types:
- Web (for websites)
- iOS (for iOS apps)
- Android (for Android apps)
A common UA setup was to create an “unfiltered view” for all data, with no filters in place (e.g. IP filters to exclude internal traffic or spam filters to exclude patterns associated with spam); a “test view” for testing filters out to make sure they didn’t have any unexpected outcomes; and a ‘main view’, with all filters applied and goal tracking in place.
In GA4, you don’t have the option to create multiple views, but instead, have the ability to create multiple data streams.
How to set up Data Streams
To add a data stream, click Admin at the bottom of the left menu. First, select the account and property you want to update, then click Data Streams from the property column, and then Add stream, selecting either iOS app, Android app, or Web.
To add a data stream for your website, enter your Website URL (this is your domain, e.g. domain.com), and set a Stream name, e.g. “Kinsta web stream”.
Enhanced measurement is selected by default, which automatically collects page views and other events. You can disable this by clicking the toggle (this can also be done later if necessary).
Google advises that in most cases, only one data stream is necessary for each type (web/app), as adding multiple web streams can lead to inconsistencies. You can find out more about this in Google’s guide to structuring your GA4 account.
You’ll need to add the Analytics tag to your site before any data shows up in your new GA4 property. Check out this guide to adding the GA4 tag on your WordPress site.
5. Subdomain tracking
One of the main benefits of the new gtag.js snippet is that it sets cookies at the highest possible domain level, meaning GA4 can track users across all subdomains without any additional configuration required. You’ll just need to add your tracking code to all pages on the subdomains you want to track. You can even use the same data stream, so no need to worry about setting anything else up.
6. GA4 UTM tracking
Google has added support for most UTM tracking parameters, so you can continue to add these to track campaigns in GA4. These can then be found in the Traffic acquisition report.
7. GA4 search bar
The search bar in GA4 allows you to get instant reports based on your search. The auto-suggest feature can help surface related questions as you start typing, which can save you time and help you easily find reports.
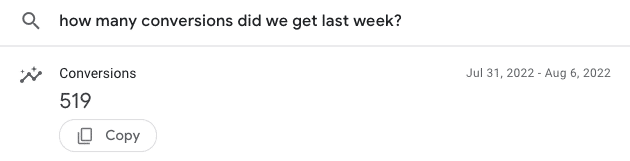
The GA4 search box also supports instant answers, so you can ask questions like “how many conversions did we get last week?”
The GA4 search box also sources Google support docs, so can be very useful in helping answer questions about setting up your GA4 account.
There’s also the possibility to find more information about the web or app data stream by typing the keyword “Tracking” or the app stream ID. The same applies if you type the keyword “Property” or the current property ID.
8. Data sampling
Data sampling allows us to make educated estimations on large data sets by analyzing smaller subsets of data to find meaningful insights.
The example Google gives is to imagine you were given the task of estimating the number of trees in a 100-acre area with uniform tree distribution. One could either count all the trees in one acre and multiply by 100 or count all the trees in half an acre and multiply by 200. This would provide a fairly accurate representation of the entire area.
So, although sampling makes it possible to quickly analyze huge amounts of data, the results will not be 100% accurate. This might be ok if you’re looking to get a quick snapshot with general trends, but if you’re looking at more critical data, like conversions, you will probably want to see the true data.
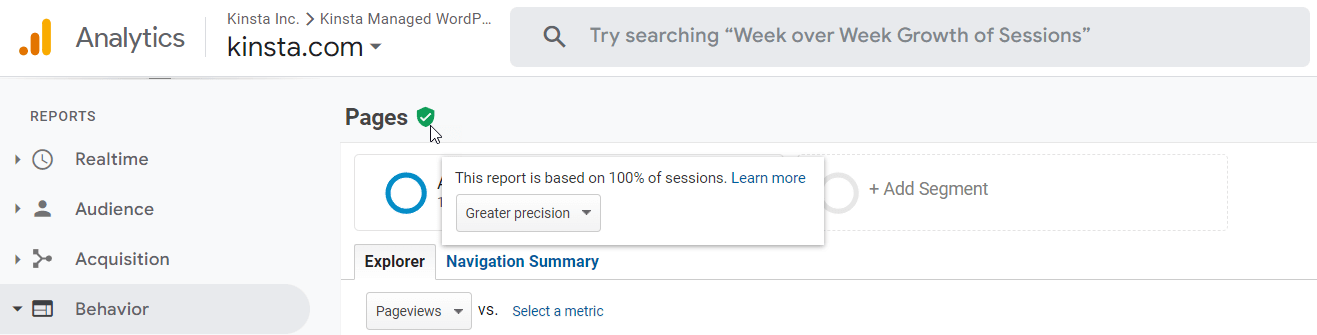
If you spot a green checkmark shield in the top left near the title of the report you’re viewing, your data is not sampled.
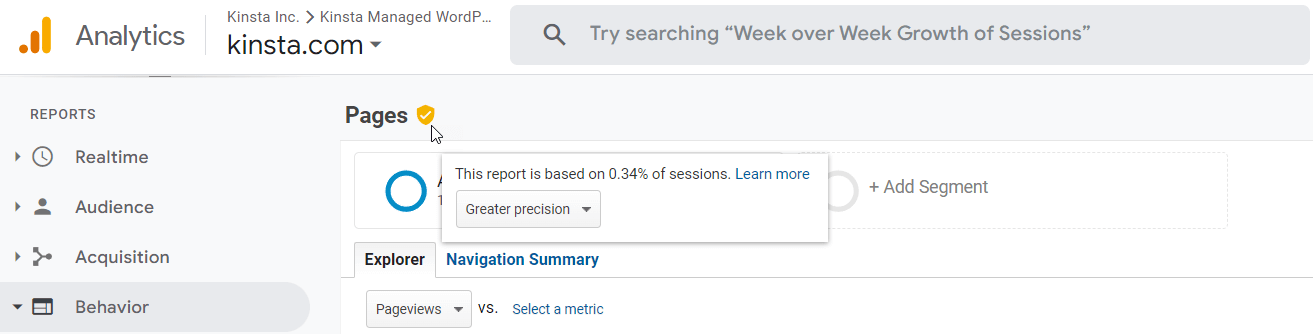
But if the checkmark shield is either yellow or red, then your data is either being sampled, or thresholds are being applied (more on that below).
One way to fix this sampling issue is to simply reduce the date range. With less data to analyze, the platform will give you better results.
You can also use the standard reports shown under the Reports section, which are always unsampled. While these are much more limited than building your own reports, they are great for providing a quick overview of your traffic and engagement.
Another option is to use BigQuery to store raw unsampled data from your site in cloud storage. This process is now free on GA4 (with some limits), which is great news, since it was only previously available in the paid version (Google Analytics 360).
9. Views (or lack of them)
In UA, views allowed us to create filtered sections for a single website, making it easy to exclude irrelevant data when focussing on a specific part of the site. For example, kinsta.com is available in 8 languages, so we used views to report on each language separately. However, in GA4 there are no views, so you’ll need to get creative with reports and filters if you want to achieve something similar.
One effective workaround is to use Collections. These are collections of reports that can be grouped together and displayed along with the standard reports, under the Reports section.
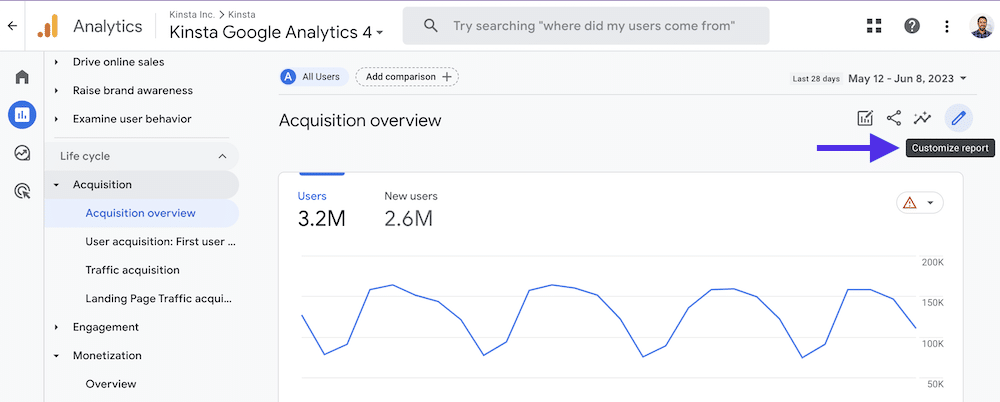
To create a custom report, simply open Reports and choose a standard report to use as your template, then click the edit icon (you will need Editor access to edit/add reports).
You can now edit the dimensions and metrics used in the report, and apply your filters. Unfortunately it’s not currently possible to add regex filters, meaning they are much more limited.
For example, if we wanted to create a report for our Spanish speaking users, we would add a filter to only report on visits to pages containing /es/.
Once you’re happy with the report, click Save, then Save as new report. if you want to update the standard report, click Save changes to current report, but it’s important to note that this will change the report for all users accessing this GA4 property.
To add the new report to your standard reports menu, click Library in the menu under Reports. Now click Create new collection, give it an appropriate name, then drag your new report across.
Click Save, then click the 3 dots menu icon and hit Publish. You should now see a new section in the standard reports menu containing your custom report. This will appear to all users accessing your GA4 property.
10. Regular Expression (regex)
While the use of regex is less widely available in GA4 when compared to UA, there are several places you can still make use of it. If you use regex to create filters in GA4, you may have noticed they don’t always appear to work as expected. While the default regex in UA was partial match, GA4 uses full match. This means that you would likely see different results between UA and GA4 when using the same regex.
For example, in UA, the regex /blog/ would have picked up any URLs containing this pattern (so all of our blog posts). However, in GA4 this would only include the page /blog/. If you wanted to include all blog posts, you would need to use /blog/.*, which basically means the filter should include URLs containing any characters after /blog/.
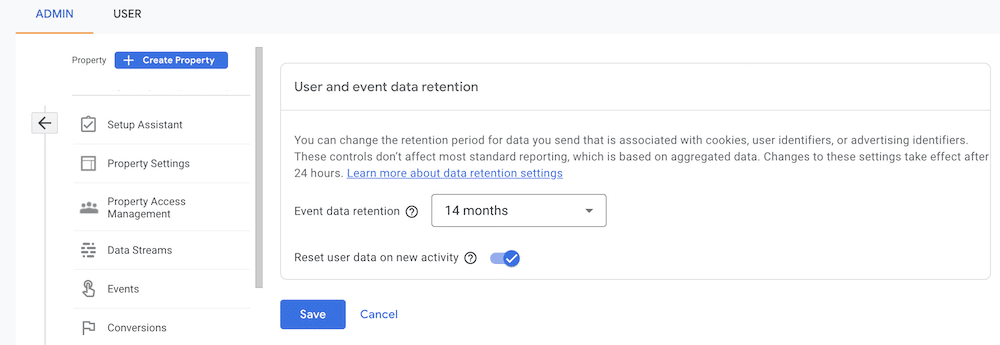
11. Data retention
By default, event data in GA4 is retained for 2 months. This means that you can only analyze data from the past 2 months in your Exploration reports.
To increase this retention period to 14 months, go to Admin > Data Settings > Data Retention and select 14 months from the dropdown, then click Save.
Users
UA had two User metrics: Total Users, which are users who initiated at least one session during the selected date range, and New Users, which are first-time users who visited during the selected date range.
In Google Analytics 4, there are three User metrics: Total Users, New Users, and Active Users.
Active Users is the primary user metric used in GA4 and is made up of the number of users who visited a website or application. An active user is triggered by any user who has an engaged session or when Analytics collects:
- the first_visit event or engagement_time_msec parameter from a website
- the first_open event or engagement_time_msec parameter from an Android app
- the first_open or user_engagement event from an iOS app
Most reports in UA used Users, which was based on Total Users. GA4 also uses Users, but this is based on Active Users, which is calculated differently, so can lead to confusion if comparing the two metrics.
A more comparable metric in GA4 can be found using Explorations to view Total users.
Engagement Rate
Engagement rate, which is based on the percentage of engaged sessions, is calculated by the number of sessions that lasted longer than 10 seconds, had a conversion event, or had at least 2 pageviews or screen views.
Bounce Rate
In GA4, Bounce rate is the percentage of sessions that had no engagement, so the opposite of Engagement rate. It’s calculated differently from UA, so the results are unlikely to match up when comparing the two.
In UA, users could spend 10 minutes reading your blog post and then leave without triggering any events, and this would have counted as a bounce. Meanwhile, in GA4, users who spend more than 10 seconds on a page are not considered to have bounced, which is much more useful.
GA4 Training
If you’d like to learn more about what’s possible with GA 4 and want to learn about how to use the new features available while also benefiting from an industry-recognized certificate, you can now enroll in the Google Analytics 4 training program.
Summary
Embracing GA4 is vital for businesses as it represents the future of web analytics, helping them to stay ahead in a fast-paced digital world. GA4 is a more sophisticated, AI-driven platform that provides a uamore customer-centric data model. While the transition to GA4 might seem daunting, the benefits of machine learning capabilities, predictive analytics, and cross-platform tracking provide a huge leap forward from UA. There is plenty of support in the form of GA4 training programs and online resources to facilitate a smooth transition.
Do you have any valuable insights, handy tips, or effective tricks to help users navigate GA4 more efficiently? We’d love to hear your thoughts! Share them in the comments section below.ua

Sam Gooch is the Head of Performance Marketing at Kinsta, with 15+ years’ experience in digital marketing. He leads SEO, Paid Media, and Demand Generation strategies, drawing on a background across agency, in-house, and SaaS roles to tackle complex challenges and drive results.

