
Performance testing tools are crucial for optimizing software, including websites. Why? Because performance directly affects user experience, conversions, and, ultimately, your bottom line. And this is something the market knows well.
The global market size for software testing — which performance testing tools are a subset of — was more than $40 billion and growing rapidly. As a result, you can find plenty of performance testing tools to address different needs, use cases, and budgets.
In this article, we’ll look at some of the best performance testing tools, their features and benefits, and help you choose the most suitable ones for your needs.
Let’s begin!
What Is Software Performance Testing?
Performance testing is a type of software testing that helps you determine the performance of a software in terms of speed, response time, scalability, resource usage, and stability under a given workload.

The goal of performance testing is to identify all the performance bottlenecks in an application.
6 Common Types of Performance Testing
There are six major types of performance testing:
1. Load Testing
Load testing determines how the software performs with the increase in workload in a given time. This workload can be concurrent users, the number of transactions, software behavior, etc.
It aims at observing the response time, throughput rates, resource utilization, and more. By identifying any performance bottlenecks in these attributes, you can troubleshoot them before launching the application to ensure a better end-user experience.
Thanks to load testing, developers can understand how many concurrent users a software application can handle at a given time.
2. Endurance Testing
Also called soak testing, endurance testing evaluates the performance of the software over an extended period under a regular, fixed workload. In other words, it determines how long the software can endure a constant workload to provide long-term sustainability.
During this testing, test teams monitor KPIs like memory leaks, memory usage, memory shortages, and more. Endurance testing also analyzes response times and throughput after prolonged use to display whether these metrics are consistent or not.
3. Stress Testing
Stress testing measures software performance beyond the normal working parameters. It means the software is placed under higher traffic loads (more users, transactions, etc.) to help developers learn how well the software performs above its capacity limits expectedly.
The goal of this testing is to determine the software’s stability. It helps you understand the point at which the software fails and how it recovers from the failure. It strains hardware resources like CPU, memory, disk space, etc., to measure the application’s breaking point based on resource utilization.
Example: Companies perform stress testing before some major events like Black Friday to check the performance of their ecommerce applications.
4. Spike Testing
Spike testing is a type of stress testing that measures software performance under a significant and sudden ‘spike’ or increasing workload like simulated users. It tells you whether the software can handle that abrupt increase of workload repeatedly and rapidly.
5. Volume Testing
During the development phase, only a small amount of data is used to test code. Volume testing (also called ‘flood testing’) tests how efficient the software is when subjected to large volumes of data. It checks for data loss, system response time, data storage reliability, and more.
6. Scalability Testing
Scalability testing measures how effective the software is in handling an increasing amount of workload. The test will tell you its behavior when you scale up or down the performance attributes of the software.
You can perform scalability testing by adding data volume or users gradually while monitoring the software’s performance.
Benefits of Performance Testing
As per a report published in March 2019, Facebook suffered a catastrophic blackout and lost around $90 million in revenue. Similarly, App Store’s downtime resulted in $25 million in losses, said another report from March 2015.
Despite having robust IT infrastructure and security, these tech giants suffered huge losses. It proves how crucial performance testing is for your applications. It ensures all the features, functionalities, and systems perform optimally to offer a better user experience.
Now, let’s discuss some benefits of performance testing.
1. Measure the Software’s Speed, Stability, and Accuracy
Speed, stability, and accuracy are some of the significant attributes of software performance. Hence, testing your application for these aspects lets you monitor how the software behaves under pressure and provides you with crucial details on how it can handle scalability.
Looking at the test results, developers can learn what changes they must incorporate into the software to overcome the negative points and make it more efficient.
2. Validate the Software’s Basic Features
Your application’s success depends upon how strong its foundation is. Measuring the performance of fundamental features and functionalities of the software helps you make informed decisions and plan your business strategy on the software’s setup.
You can use your performance testing results in your research and development departments and pool your resources accordingly to enhance your software performance and product offering.
3. Identify Issues and Resolve Them
Performance testing will tell you the key issues that you can correct before launching your site or app. That means you can quickly resolve all the problems identified and concentrate on improving its technology instead of fighting the issues after release.
4. Enhance the Software’s Load and Optimization Capability
With performance testing, you can better handle volume and load capacity and optimize your software in such a way that helps the software withstand high numbers of concurrent users. It will also detect the scalability issues that you can address as soon as possible and allow the testers to tailor capacity to handle high demands.
5. Improve the Code Quality and Software Functionality
When you can detect the issues in your software, you can eliminate them quickly. As a result, your developers can maintain quality code and improve the application’s functionality, delivering the expected speed, reliability, scalability, and stability.
6. Meet User Expectations
Your customers won’t like slow, laggy software that kills their time and annoys them. They expect it to load quickly — within 2 to 3 seconds — and work smoothly, without any confusion. The first impression of your software is crucial in deciding whether users will want to continue using it or hit the uninstall button.
Performance testing helps you meet the desired software attributes and keep your users happy to continue using your software, boosting your revenue.
Bonus Tip: Performance testing is best done just after you make the code available. It will help the developers get feedback in real-time to fix issues as early as possible.
The Performance Testing Process
The goal of performance testing is the same for every software, though the methodology can vary a bit. So, here’s what a typical performance testing process looks like:
- Choosing the testing environment: First, select your test environment, performance testing tools, and production environment. Select appropriate software, hardware, network configuration, etc., to use for your test.
- Identifying performance metrics: Next, identify software performance metrics such as response time, throughput, transactions, load time, and resource distribution like CPU, memory, and disk space.
- Planning the test: Identify test scenarios covering user variability, target metrics, and test data. It will help you plan and design a few models of your performance tests.
- Configuring the chosen test environment: Organize the elements of your test environment in addition to the performance testing tools you need for different test cases. For example, to test your website’s performance, performance testing tools such as Kinsta APM can help.
- Implementing the test design: Create your performance test depending upon your test design, which will help your team stay on track during the entire testing process instead of getting confused.
- Executing performance testing: Now, you can start the test. As it runs, monitor the trial and collect the resulting data so your developers can use it to improve the software performance.
- Analyze, report, and retest: After you have the test results in hand, analyze the data and plan what you need to overcome the highlighted issues. Lastly, troubleshoot the problems and execute the performance testing again to track the improvements. Keep retesting until you troubleshoot all of the problems detected.
Now, let’s look at some of the best performance testing tools available on the market.
Top 26 Performance Testing Tools
We’ve collected the best performance testing tools available on the market to help you decide which could work for your unique testing requirements.
1. Kinsta APM
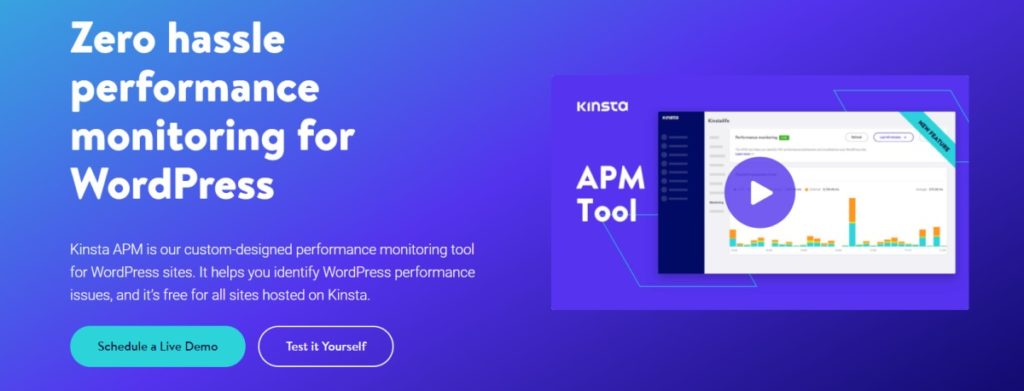
Need a hassle-free performance monitoring solution for your WordPress website? Try Kinsta APM. It’s designed to let you find and resolve performance issues on your Kinsta-hosted sites. With a simple and easy-to-use UI, Kinsta APM is for everyone, whether they’re beginners to experts. Plus, it’s available in 8 languages under MyKinsta.
Kinsta APM provides insights on slow PHP transactions, external requests, MySQL queries, and more. You can debug database queries, non-optimized themes or plugins, and longer API calls and external URL requests, along with identifying slowest, median, and average transactions.
It’s helpful for everyone, from agencies and ecommerce site owners to developers, by helping them find and troubleshoot performance issues quickly while reducing their expenditure on costly APM tools.
Features and Benefits:
- Customer support team: With over ten years of experience, Kinsta’s seasoned customer support team will resolve all your site issues with 24/7 availability and a 100% solve rate. You can chat with them directly through MyKinsta and get instant replies.
- Pricing: The tool is free for every website that Kinsta hosts, no matter what plan you’ve chosen. You can also book a live demo to test the performance yourself.
2. WebLOAD
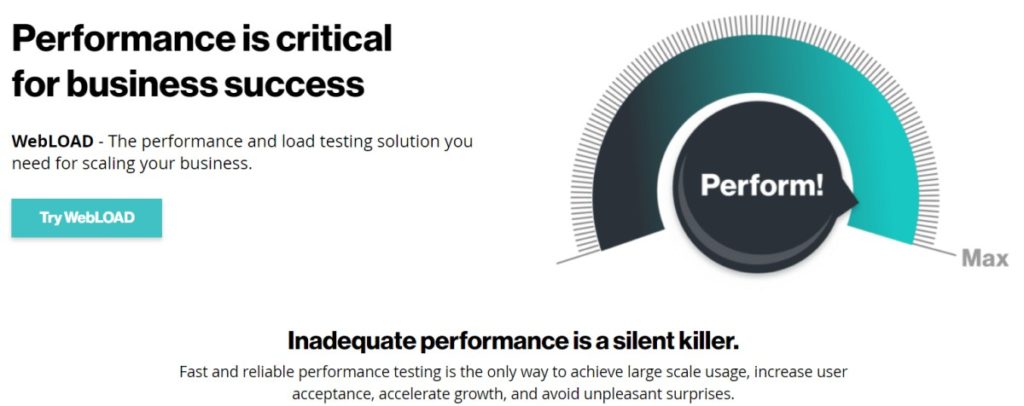
Released in 1997, WebLOAD by RadView is a performance and load testing tool for your software and helps you scale your business. It offers capabilities like performance, integrity, and scalability testing.
This enterprise-grade tool is capable of simulating thousands of users concurrently so you can test heavy traffic loads and report weak points, constraints, and performance bottlenecks in your application.
Use WebLOAD for website load testing, continuous testing, cloud load testing, and more. The tool can generate load from the cloud or on-premise machines and offers an Integrated Development Environment (IDE) for recording, editing, debugging test scripts visually.
Its proxy-based recorder also records your HTTP activities and generates tests in JavaScript. You can also edit or enhance it using multiple tools in IDE. WebLOAD offers analysis reports for performance data that help users to identify bottlenecks.
Features and Benefits
- Correlation: Correlates dynamic values automatically like session IDs and enables scripts to execute with different virtual clients.
- Protocol support: Supports HTTPS, HTTP, and XML.
- Integration: Integrates with tools such as Selenium, Jenkins, etc.
- Customer support team: You can reach out to them via phone call, fax, or contact form.
- Pricing: There is a free trial option available for up to 50 users. Contact their team to get a quote.
3. Apache JMeter

Next up on the list is a famous load testing tool: Apache JMeter. Apache JMeter helps you measure and analyze software performance. It’s an open source tool based on Java that people use mainly for testing web app performance, but it also finds usage on other services.
It can test performance for both dynamic and static resources, as well as dynamic web apps. In addition, you can use it to simulate heavy loads over a server, network/object, or group of different servers to test its strength and analyze total performance under varying load types.
The tool is easy to use and doesn’t demand highly sophisticated infrastructure for testing, and is compatible with many load injectors manageable with one controller. Plus, it has a user-friendly GUI that needs less scripting compared to other load testing tools. Its simple graphs and charts are enough to analyze primary load-related data and resource utilization stats.
Its fully-featured IDE allows faster testing creation, recording, and debugging. JMeter supports CLI to load the performance test from an OS compatible with Java, including Linux, Mac OSX, Windows, etc.
Features and Benefits
- Protocol support: HTTPS, HTTP, SAOP, XML, FTP, etc.
- Supported technologies: PHP, NodeJS, ASP.NET, database, MOM, LDAP, Java objects, TCP, etc.
- Correlation: offers effortless correlation and lets you extract data from top response formats like HTML, XML, JSON, etc.
- Extensibility: It’s highly extensible and works with pluggable samplers, scriptable samples like Groovy, pluggable timers, data visualization, and analysis plugins, and more.
- Integration: Integrates with open source libraries such as Jenkins, Gradle, Maven, etc.
- Customer support: They have a large community of developers and contributors with whom you can interact. They also have maintained tutorials so you can understand the tool better.
- Pricing: JMeter is free and open source.
4. LoadNinja
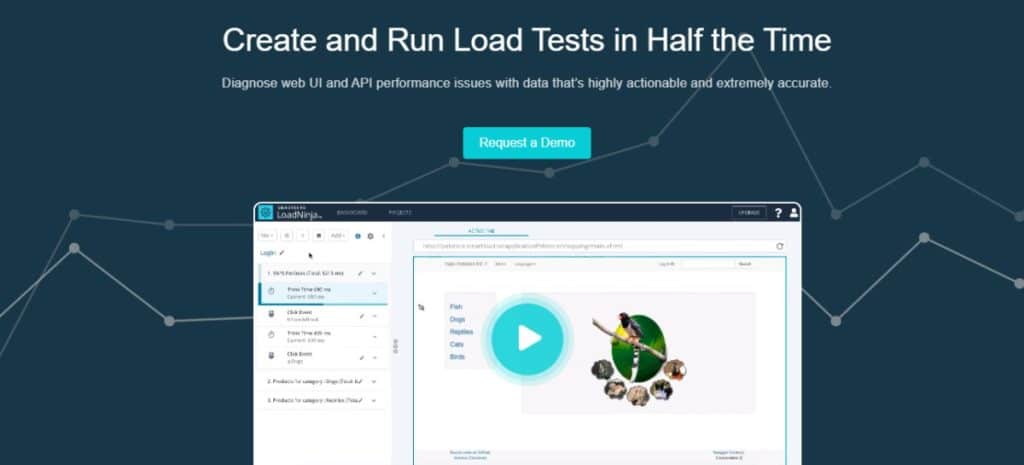
Create your load tests and run them quickly using LoadNinja by SmartBear. It helps you diagnose app performance issues with highly accurate and actionable data. It provides results that are easy to read and doesn’t need extensive programming.
This tool helps product teams, testers, and engineers focus on building their software that scales while spending less time creating test scripts.
LoadNinja allows you to record client-side interactions, identify performance issues quickly, and debug in real-time without sacrificing test quality by eliminating script scrubbing, translation, and dynamic correlation efforts. With its TrueLoad technology, it’ll also let you test the actual end-user experience on multiple browsers to save more than 60% of your effort. It is highly efficient and precise in recording load tests, and it replays them instantly with no coding needed.
Analyze software performance data such as step times, asynchronous calls, processed resources, navigation timings on your web interface, and diagnose issues using a machine learning assistant.
Perform continuous software performance testing, move faster with quality and test coverage, and automate the tests. It requires no setup or maintenance as the service is cloud-based.
Note: SmartBear offered a similar offering previously called LoadComplete. While it’s still available to use, it hasn’t been updated since 2019. We recommend you avoid it.
Features and Benefits
- Integration: Automated tests by using their custom CI/CD plugins or REST API.
- Customer Support: You can reach out to the LoadNinja user community to find answers or go through their comprehensive documentation and FAQs.
- Pricing: The entry price of this tool is $1,439/year for 100 virtual users and 100 load hours.
5. Loadero

Loadero is a cloud-based performance and load testing tool that allows you to create faster performance tests and find system issues efficiently.
You can use Selenium, write test scripts in Java, JavaScript, or Python to conduct large-scale load testing or performance tests, and record web sessions for performing debugging. Configure the test by adding test users, grouping, browser, location, counterfeit data feeds, network conditions, and more.
Loadero lets you set up multiple network settings and test your software in different network conditions. The cloud infrastructure of Loadero offers better scalability without letting you worry about maintenance.
This performance testing tool also helps you detect system limitations with comprehensive performance test reports, machine statistics, load times, screenshots, and recordings. In addition, Loadero features built-in validations to execute assertions automatically after the completion of the test run.
Features and Benefits
- Browser support: Loadero supports the five latest Google Chrome versions along with Mozilla Firefox.
- Reusable test codes: It lets you utilize the existing test setup to run load testing.
- Fake media: You can incorporate artificial media feed and simulate microphone and webcam inputs.
- Worldwide coverage: Perform tests from any of their 12 global locations.
- Pricing: It costs $250/month under the pay-as-you-go model.
6. SmartMeter.io

If you’re looking for an enterprise-level performance testing tool, then SmartMeter is a good option. It has best-in-class functionality and features, and it’s available at affordable rates. This tool helps you create test cases with ease using the embedded browser.
You can easily add testing into the continuous integration procedure by analyzing the acceptance parameters like maximum response time, errors, and throughput to automatically determine the test success.
SmartMeter provides you with advanced, in-depth reports, live test results with graph comparisons, trend analysis, etc., to fine-tune the software performance.
Features and Benefits
- Compatibility with JMeter: SmartMeter is compatible with JMeter to offer you all the features you love in this tool and perfect your tests.
- Distributed load testing: Create innumerable virtual users out of different global locations using load generators.
- Pricing: Starts at $39/month.
7. StormForge
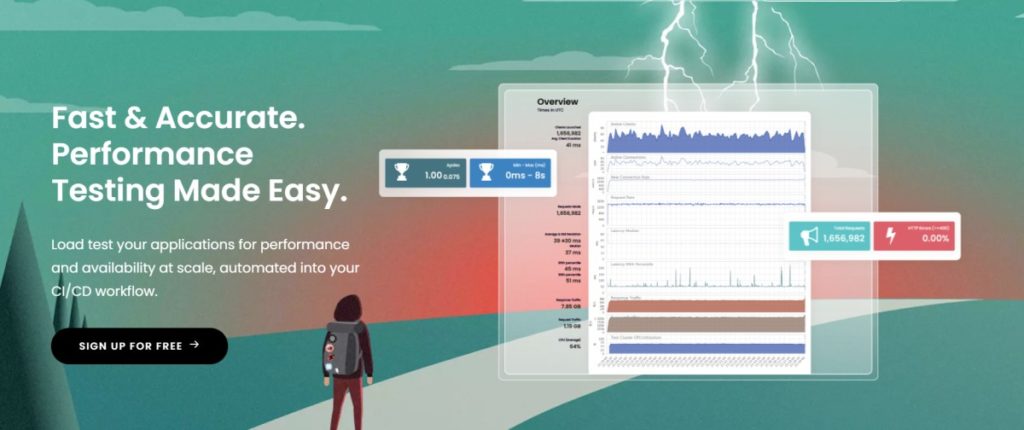
StormForge allows you to perform load testing of your apps for performance and scalability automated right into CI/CD workflow at an affordable cost. It helps you increase the application uptime, throughput, decrease latency and application errors, and scale to more users.
The tool brings all these capabilities in fewer resources, involving no manual process, offering environmental sustainability, and helps you reduce your monthly bills on the cloud. You can capture actual production traffic and ensure the test delivers authentic traffic patterns.
It works in an open-workload model, simulates real-world scenarios accurately, and provides better error detection problems.
StormForge also lets you minimize issues and improve the end-user experience by ensuring app performance under load and meeting SLAs. It offers extensive analytics and reports to help interpret, benchmark, and compare results easily.
Features and Benefits
- Repeatable: Use Performance Testing as Code on your CI/CD pipeline.
- Cloud-native: Works well on Kubernetes.
- Supported programming languages: It includes Java, Nginx, Go, and Python.
- Integration: It integrates flawlessly with your ecosystem like cloud providers (AWS, DigitalOcean, GCP, IBM, Azure), monitoring tools (Prometheus, Dynatrace, Datadog, New Relic, and Circonus), DevOps tools (Jenkins, Puppet, Chef, and Rancher Labs).
- Pricing: There’s a free tier available for three tests/month, while paid plans start at $150/month per app.
8. LoadView
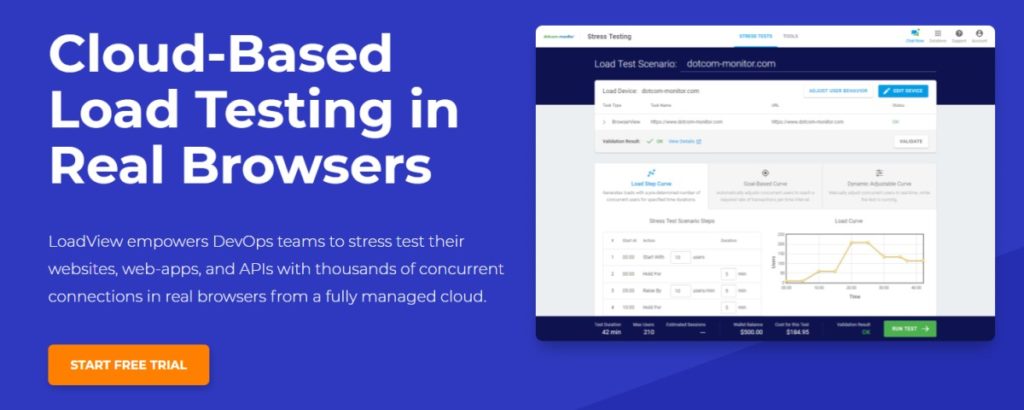
Empower your IT team to perform stress testing on your websites, APIs, and web applications with thousands of connections concurrently in actual browsers using the enterprise-level platform of LoadView.
LoadView leverages AWS and Azure to manage its cloud network so you can design multiple tests, even on complex apps. You can define users, duration, and behavior using various scenarios and simulate users virtually with load injectors from 30 global locations across the US, South America, Canada, APAC, and Europe.
The tool offers three load curves, Load Step curve, Dynamic Adjustable curve, and Goal-based curve, to check traffic spikes, scalability, and infrastructure limits.
Features and Benefits
- Advanced firewall: Run tests behind a firewall as LoadView offers dedicated IPs that you can allow and configure.
- Video recording: Capture website or app rendering with video recording for better analysis and review.
- Other features: Reference servers, detailed waterfall charts, dynamic variables, and load injector controls.
- Pricing: Starts at $199/month for 1000 concurrent users.
9. NeoLoad

NeoLoad is a continuous performance testing tool to automate your application and API load testing. It provides intuitive design and maintenance of tests and offers realistic user behavior simulation.
It simplifies test creations with conditions, loops, and drag-and-drop controls with a robust codeless design. For advanced cases, you can use JavaScript. It uses a YAML-based format that is human readable and domain-specific.
NeoLoad also provides you with detailed reports after test completion, allows you to perform infrastructure monitoring, and you can also integrate APM to get better analysis and validate builds with automatic SLAs.
Features and Benefits
- Supported technologies: It supports web frameworks and protocols like HTML, Angular, HTTP/2, WebSocket, etc.; packaged apps like Salesforce, SAP, Oracle, IBM, etc.
- Advanced correlation: Correlates dynamic parameters with automatic handling and detects app-specific parameters along with predefined rules like .Net, Siebel, JSF, etc.
- Integration: Integrates with DevOps tools like Jenkins, Bamboo, TeamCity, Git, etc.; SOAP/REST support, Selenium, Tricentis Tosca, Dynatrace, Azure, Jenkins, Git, etc.
- Pricing: Contact them for a customized plan.
10. LoadUI Pro

You can load test your SOAP and REST APIs, microservices, and databases using LoadUI Pro, which is part of SmartBear’s ReadyAPI offering. With it, you can check the scalability and speed of your APIs and preview their performance. It was released in 2011 and written in Java, Groovy, and JavaFX.
Its standard version is open source, but the Pro version is brought to you by SmartBear. Forget about maintenance or investing too much as LoadUI Pro is a fully cloud-based performance testing tool.
Apart from these capabilities, LoadUI Pro offers parallel load testing, endpoint load testing, isolated load testing, server monitoring, and much more. In addition, you can add more functionality at runtime using 3rd-party plugins.
Features and Benefits
- Compatibility: Works with Mac OS, Windows, and Linux.
- Test reusing: You can reuse functional tests that already exist in your pipelines to save time.
- Integration: Integrates with SoapUI, a tool for functional testing.
- Pricing: Starts at $4,999/year.
11. Silk Performer

Conduct powerful and realistic stress and load testing using Silk Performer for your mobile, web, and enterprise apps. It pinpoints issue causes and location and ensures that server and application uptimes during peak traffic.
Provide better user experience with design scripts that help uncover issues and use end-to-end diagnostics to detect, monitor, resolve, and isolate problems. It features customizable reports so you can generate graphs and reports and customize them based on your preference.
With Cloud scalability, you can simulate peak-load of any size effortlessly and test faster by reusing existing performance tests and run them in different scenarios without changing scripts.
Silk Performer has three components, namely, Performance Explorer, True Log Explorer, and Workbench. It offers built-in VPNs that allow you to test and resolve internet-based apps under heavy loads.
Other essential capabilities of Silk Performer include user-friendly parameterization and correlation, Agent Health Control, resource management, integrated server monitoring, version controls, and more.
Micro Focus also offers another project-based load and performance testing tool called LoadRunner. It tests applications and measures system performance and behavior under load. Simulating thousands of concurrent users, you can record and analyze application performance.
Features and Benefits
- Supported protocols: HTTPS, HTTP, HTML, SMTP, POP, TCP, IP, FTP, .NET, SOAP, XML, LDAP, and more.
- Global locations: Execute tests out of more than 50 international locations.
- Supported technologies: Google Cloud Platform, Azure, and AWS.
- Pricing: Contact them for a quote. A free trial is also available.
12. AppLoader
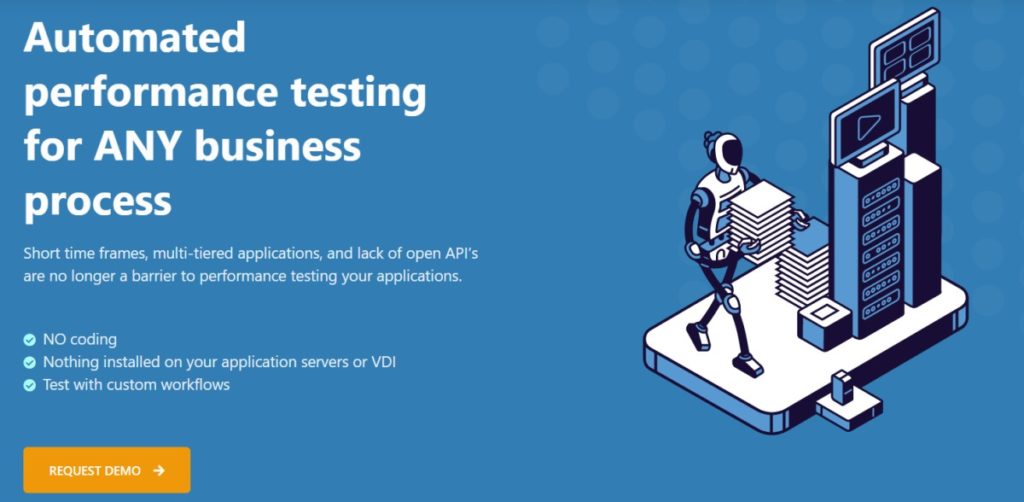
AppLoader by Automai is an automated performance tool without coding or installations on your app servers/VDI. This frontend tool lets you view actual app performance using bots that access your apps en masse using their desktop GUI.
AppLoader frees you from protocol limitations and lets you test things you want. Create custom workflows with ease using canned scripts and log-in time and define workflows to fit your workload.
You can perform testing by building automated test cases in a minute, using the code-free scripts generated by the tool, playback and view the bot navigating the process, and then adding or editing logic to your cases anytime. The test processes involve multiple apps through access points, and you require no plugins or APIs.
View screenshots quickly when the test fails to detect the cause and resolve the issues. Plus, you can also see the overall performance metrics and ramp-up times in a single dashboard.
AppLoader offers easy maintenance, and you can reuse its existing components, sections, and scenarios; retake images, edit line actions if needed, and change script sections to meet application changes and upgrades.
Features and Benefits
- Robotic automation: With robotic automation for testing, you don’t have to install anything over your app servers or VDIs.
- User-friendly test scenarios: View scenario components at one glance and find actions, define transactions anytime, and more.
- Pricing: Tell them your requirements to get a quote. A free trial is available, along with a demo.
13. Gatling
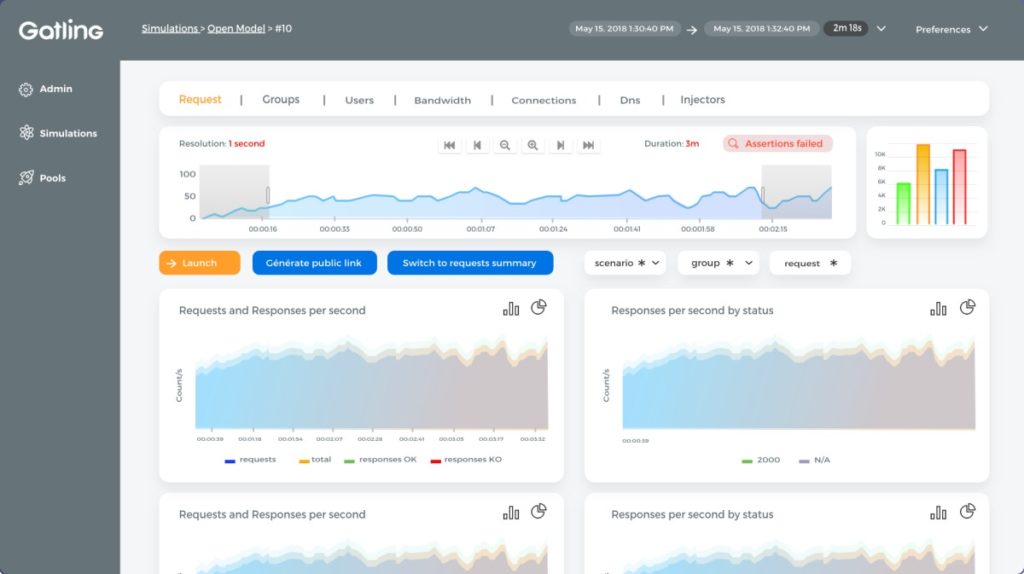
Launched in 2012 and written in Scala, Gatling is an open source performance and load testing tool for web services, mainly applications. It lets you avoid crashes by anticipating crashes and slow response times, detect issues early to improve time to market, enhance user experience, and boost your business.
The code-link scripts of Gatling let you maintain test scenarios easily and automate them. It is built for continuous load tests and can integrate easily with your developmental pipeline. It also includes a web recorder.
Features and Benefits
- Readable DSL: Their domain-specific language (DSL) makes the reading of test scenarios easy for everyone.
- Analysis: Simulate thousands of user requests/second easily and achieve highly accurate metrics that you can view in a colorful and dynamic report.
- Pricing: Free.
Apart from an open source tool, Gatling also offers a commercial tool Gatling Frontline with advanced features and metrics for test automation and integration. Its on-premise plan costs $485/month, while the cloud plan starts from $3/hour
14. BlazeMeter
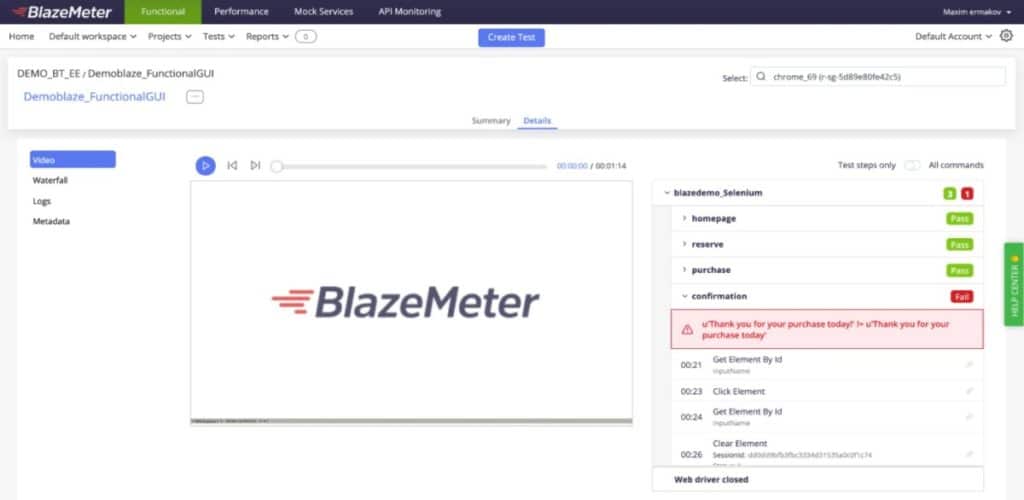
BlazeMeter is an enterprise-ready load testing tool founded in 2011 that allows you to perform shift testing. It was awarded Gartner peer insights Customers’ Choice 2020 for Software Test Automation.
Its intuitive UI allows you to create load tests or reuse existing scripts to run them within your continuous testing pipelines. You can simulate thousands of virtual users out of 56 global locations by leveraging their open source toolchain. In addition, you can also control arrival rates, hits/sec, and threads in real-time.
BlazeMeter provides you with detailed reports to view historical trends and improve your software performance. You get mock services to visualize your entire system, simulate slow network latency and slow responses to ensure software performance and quality.
Features and Benefits
- 360-degree API testing: Monitor APIs quickly with clarity on code health to ensure API call content and structure return data as expected.
- Integration: Integrates with Apache JMeter, Taurus, Gatling, Selenium, and more.
- Pricing: There’s a free plan available for 50 concurrent users and ten tests, while paid plans start at 99/month for 1000 simultaneous users and 200 tests/year.
15. Rational Performance Tester

As the name suggests, Rational Performance Tester by IBM is an automated performance testing tool for server-based and web-based applications. It validates the applications, detects performance bottlenecks, and helps reduce load testing.
Rational Performance Tester allows you to perform complete environment analysis by pinpointing slowdown causes for J2EE interfaces and apps using products of IBM Tivoli. This advanced testing tool lets you create test scripts with no coding to reduce complexity and save time. Plus, you can view test details by accessing the text editor.
You can perform root cause analysis with Rational Performance Tester to identify bottlenecks in the application tier and source code and trace activities from sequence diagrams and view resource statistics.
Features and Benefits
- Supported technologies: HTTP, SIP, SAP, Citrix, Siebel, TCP Socket, and more. The tool features a graphical test scheduler and provides automated data-relationship management.
- Real-time reporting: Get real-time throughput and performance reports, set configuration and filtering options, and see performance trends with detailed insights on response time and other aspects.
- Pricing: Contact them for a quote.
16. k6
Previously known as Load Impact, k6 is an open source SaaS and load testing tool for development teams to test their websites and APIs. It offers fail/pass behavior for effortless integration and automation into CI pipelines.
Their community has also developed converters and a browser recorder to facilitate test creation. k6 is a flexible, easy-to-use, and feature-rich CI tool. k6 lets you create faster tests and QAs with its test builder, converters (Postman, Swagger, and JMeter), and recorder. Plus, it offers extensive documentation with the best support.
k6 uses the same script for cloud and local tests, and the tests can mimic real-world cases. It also uses powerful scripting in ES6 JS, with no DSL or XML. The performance testing tool automates tests to ensure the application and infrastructure performance. In addition, you can configure SLOs in k6 scripts to check the software’s health.
Features and Benefits
- Supported protocols: HTTP/1.1, HTTP/2, WebSocket, and more.
- Compatibility: Works with Mac OS, Linux, and Windows.
- Integration: Integrates with 20+ services, including Kafka, Azure, GraphQL, Grafana, Datadog, GitLab, CircleCI, GitHub, and more.
- Pricing: They offer a free trial for 50 tests while paid plans start at $59/month for 200 users and 1200 tests/year.
17. Eggplant
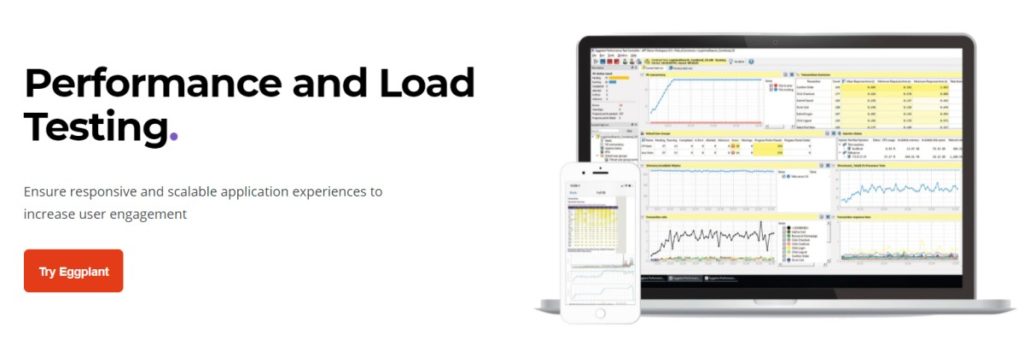
Increase end-user engagement by offering them scalable and responsive apps load testing with Eggplant. This load and performance testing tool is simple and provides actual and user-centric testing.
Eggplant exhibits excellent simulation capabilities. It simulates users virtually at both network protocol and application UI levels to completely understand UI impact. In addition to that, it is a highly extensible, open, and multi-protocol supported tool that helps you solve test challenges.
Features and Benefits
- Test controls: You can control tests easily while they are running.
- Effective analysis: Effective and real-time test analysis with reporting lets detect issues quickly and resolve them efficiently.
- Pricing: Try their demo and contact them for a quote.
18. Loadster
Load test web applications with Loadster can handle heavy loads and helps you optimize your app performance, prevent downtime, and control costs. You can test any sort of HTTP APIs like REST, JSON-RPC, GraphQL, and XML-RPC.
It offers advanced validation rules to find errors and record values to reuse them later. You can also record scripts using Loadster Recorder (a free browser extension) and edit them in the browser.
You can launch cloud tests quickly with Loadster. It can run distributed cloud tests globally with little setup and establish 1000s of bots across cloud instances.
Features and Benefits
- Real-time metrics: Get real-time results during the tests for errors, throughput, and response times, along with automatic reports.
- Pricing: Their pay-as-you-go model starts from $119/month for 1000 bot hours, while monthly plans start from $299.
19. Akamai CloudTest

CloudTest by Akamai allows you to perform stress testing on your environment and ensures your app or site is ready for sudden traffic spikes. It is a highly scalable and robust tool that lets you simulate large events with accurate controls and provides live site analysis to help you detect bottlenecks.
It’s super easy to use. You can develop, provision, perform tests and get detailed insights without hassles. This performance testing tool requires lower resource allocation but produces high-performance results.
Feature and Benefits
- Rapid test creation: Create tests faster without coding.
- Pricing: Free for 100 concurrent users, and on-demand plans start from $2,500.
20. Parasoft Load Test
Parasoft Load Test is a simple and easy-to-use load and performance testing tool with an intelligent user interface and makes configuration effortless. It is extensible with a scripting extension to add custom functionalities.
The tool offers multiple performance testing types, including stress testing, endurance testing, component testing, spike testing, infrastructure testing, and scalability testing.
By importing JUnit tests on your load test, you can achieve early-stage load tests, isolating specific parts of your codebase. Besides, you can automate test result analysis with QoS metrics and integrate it with major APM systems for correlation.
Features and Benefits
- Cost-efficient: Run tests on-demand using cloud services like AWS and reduce hardware requirements for performance testing.
- Pricing: Contact them for a quote.
21. Locust
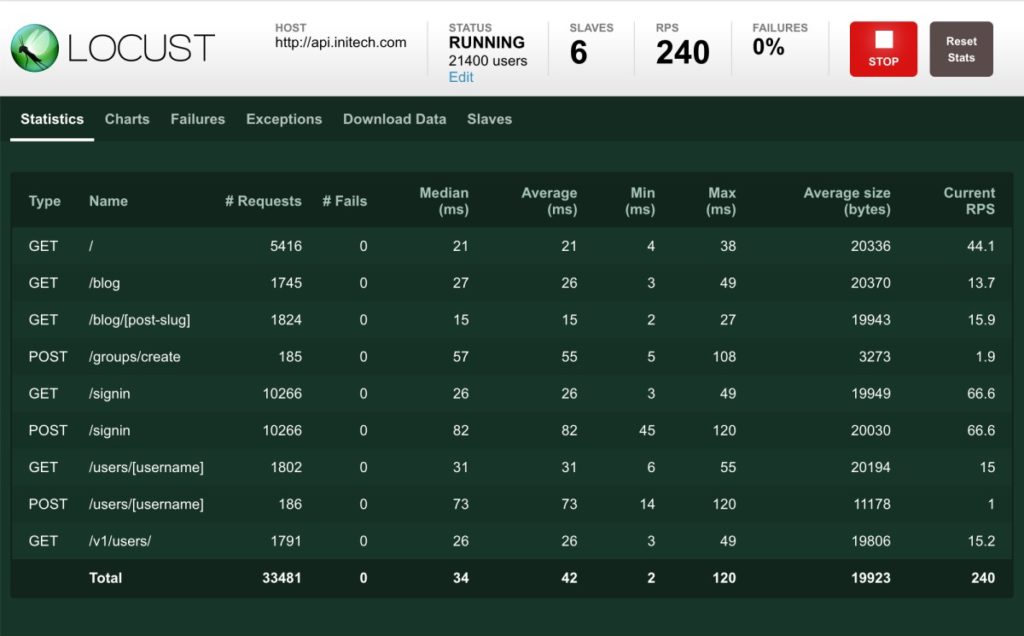
Locust is an open source load testing tool that lets you define user behavior using Python code and flood your system with millions of users simultaneously. It’s a highly distributed and scalable performance testing tool that supports running tests that are spread across multiple machines and let you simulate a massive number of users with ease.
Furthermore, the tool is resilient as it is battle-tested and can easily withstand heavy loads even during peak traffic. It features basic and straightforward coding without involving clunky UIs or rich XML. Instead, you can write simple Python codes.
Features and Benefits
- Installation: Easy to install using pip from PyPI.
- Pricing: Free.
22. nGrinder
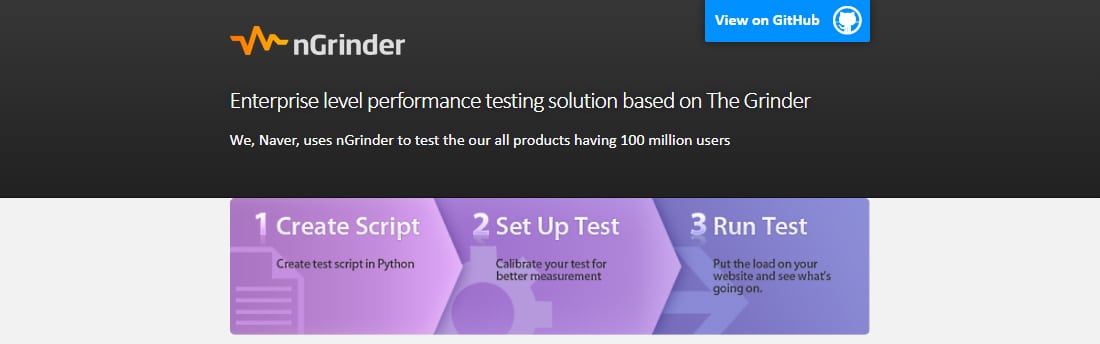
nGrinder is an enterprise-level performance testing tool that makes it effortless to execute test script creation, perform tests smoothly, monitor your website and applications, and generate test results. It uses a Jython script to create test scenarios utilizing multiple agents.
It is an open source stress testing tool that provides integrated test environments while eliminating inconveniences during the overall process. It originated from The Grinder and includes specific changes in architecture and more accessible test executions.
You can assign pre-install agents, deploy them on different network regions, and perform tests on several network locations. In addition, manage scripts by embedding subversion and monitoring agent state to measure stress over machines.
Features and Benefits
- Extensible: It can extend tests unlimitedly using custom libraries and accommodate concurrent tests without showing any inefficiencies.
- Compatibility: It maintains backward compatibility and can run on Docker.
- Pricing: Free.
23. Loader.io

Perform simple cloud-based performance and load testing with Loader.io, which is a FREE tool for your web apps and APIs, capable of handling thousands of simultaneous connections.
Just register your application and start the test using the API or web interface, and let them simulate connections for a specific duration.
You can monitor your stress or load tests with Loader.io in real-time and share the report with your colleagues. It features interactive data representation with graphs and statistics that you can access from any time and anywhere.
Features and Benefits
- Integration: Integrate Loader.io with your deployment pipelines to extend functionalities.
- Pricing: The free plan supports 10,000 clients/test, while paid plans start from $99.95/month for 100k clients/test.
24. SolarWinds
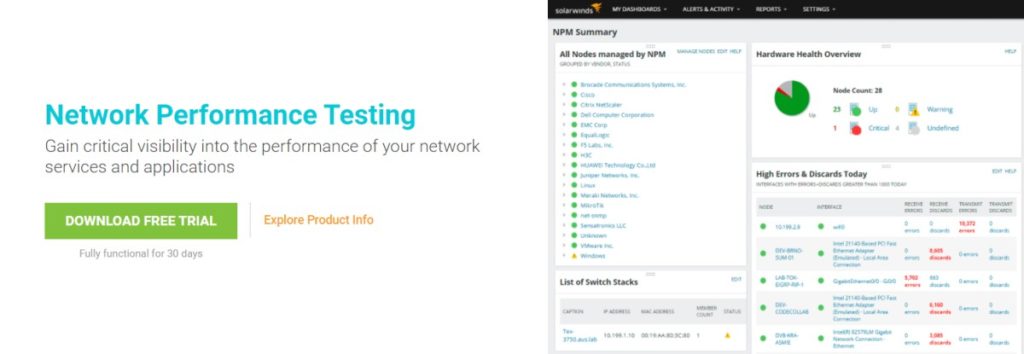
Gain better visibility on your app and network service performance with SolarWinds. It lets you discover the root cause of an issue so you can resolve them quickly.
You can decrease your network downtime using actionable insights gained out of this performance testing tool. In addition, this software offers extensive network performance testing with continuous monitoring of device performance and network availability.
The tool alerts you with an intelligent network alerting feature when the critical performance metrics exceed predefined thresholds.
Features and Benefits
- Data analytics: Leverages data analytics to monitor your network so you can resolve issues faster.
- Pricing: Starts from $1,638.
25. Test Studio

Offered by Telerik, Test Studio is a complete automation tool for testing your web, mobile, and desktop-based applications’ GUI, load, and performance. It offers code-based and codeless automation with an intuitive UI for testing.
Test Studio makes testing more reliable and stable with a faster test recorder while requiring minimum test maintenance. Additionally, it maximizes performance test coverage to ensure optimal performance.
Using its built-in scheduler or integrating test suites in your CI/CD setup, you can perform stable and quick test runs. You can also record your performance tests and utilize automated playback for faster and easier test creation, and then run it to test different browsers.
Features and Benefits
- Dashboard: Monitor app quality with web-based reports, results, and dashboard.
- Pricing: Starts from $39/month per developer.
26. Taurus
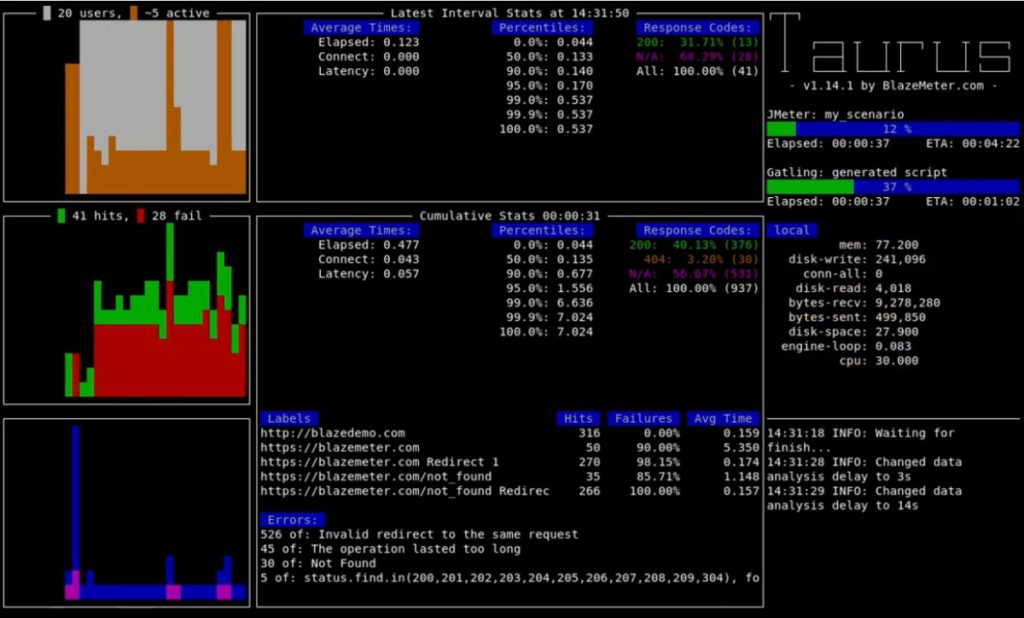
Taurus is an automation tool for continuous testing and lets you eliminate those annoying, repetitive tests. It also improves experience working with Selenium, JMeter, and more.
Taurus is a simple performance testing tool that makes building, running, and viewing tests effortless without writing extensive codes. In addition, you can create new tests from scratch by utilizing unified and control-friendly DSL.
Features and Benefits
- Integration: It integrates seamlessly with JMeter, Selenium, etc.
- Pricing: The tool is FREE and comes with helpful documentation.
Other performance testing tools: OpenSTA, The Grinder, nGrinder, ApacheBench, Tsung, Experitest, ZebraTester, Artillery, Applause, J-hawk, Paessler Security, Dynatrace, and Zabbix.
Don’t just pick anything randomly. Instead, choose the performance testing tool based on your unique testing requirements for your website and web applications. And compare their features and pricing essentially.
But if you have a website powered by Kinsta, then you don’t have to look anywhere else. Just use Kinsta APM for performance testing through MyKinsta for free.
|
Performance Testing Tools for Network Performance |
Testing Tools to Automate Performance Testing |
Performance Testing Tools for Web Applications |
Performance Testing Tools for Websites |
|
|
|
|
How To Choose the Best Performance Testing Tool for Your Needs
As you saw, there are plenty of options available. To help you pick the best solution for your needs, we’ve compiled a list of essential aspects you might want to consider when evaluating options.
1. Ease of Use
The performance testing tools you use must be easy enough that they don’t cause your testers more problems than they solve. If your IT team is familiar with specific tools, you can ask them what those are and how they perform. It will cut down on time spent learning the new software.
Or you can go with a new but efficient tool, provided it’s got an effortless-to-use GUI, and you’ve found analysis plugins available for extensibility.
2. Available Test Environment
The performance testing tool you choose must access enough network and hardware resources to produce a sufficiently available performance testing environment. Most of the tools we’ve mentioned come equipped with a testing environment for you.
If it can’t generate a test environment to simulate an expected amount of network traffic properly, the tool might not be suitable to meet your company’s requirements.
3. Tool Efficiency
The efficiency of a performance testing tool depends on the number of virtual users it can accommodate currently to carry out the test on a single operating device.
The efficiency is more if it needs fewer devices and produces large-scale tests. For that, it must be proficient in generating an expected number of virtual users on the current hardware.
4. Scalability
A performance testing tool’s scalability depends upon the chosen protocol along with your test environment’s deployment configuration. To check the tool’s scalability, you can conduct a Proof of Concept test for your performance testing tool.
It’s best to perform a proof of concept test to validate whether a product or idea is feasible or not to move ahead. You’ll get valuable information during the testing phase, such as customer feedback, business analysis, competitor research, expected financials, marketing strategies, and more.
5. Protocol support
Different vendors offer different app protocols such as HTTPS, HTTP, SSH, FTP/STFP, etc. Choose the tool based on the nature of the app protocol you like to utilize.
If you have questions that the tool’s available documentation doesn’t answer, ask your vendor whether the tool supports the protocol or not, especially for complex protocols like Citrix.
6. License and Its Cost
Licensing can be a challenge with many performance testing tools. Commercial tools usually offer better protocol support but with certain restrictions. Review and be aware of the tool’s licensing before using it. And if it’s a paid tool, check their pricing, compare with others, and choose what falls within your budget with essential features.
7. Integration
Performance testing tools work extraordinarily well when integrating with other monitoring, diagnosis, defect management, and requirements management. It will help you learn the nature of metrics the tool can bring you concerning diagnostics and monitoring. Additionally, you’ll get an idea of how to track these tests and find defects easily.
For example, StormForge integrates seamlessly with cloud providers like AWS, GCP, IBM, etc.; monitoring tools like Prometheus, Datadog, Circonus, etc.; DevOps tools like Jenkins, Puppet, Rancher Labs, etc.
8. Extensibility and Adaptability
One performance testing tool won’t have all the capabilities you might need during the test. Hence, discover how flexible and extensible the tool is so you can integrate it with other 3rd-party tools and increase its functionalities.
For example, Apache JMeter is highly extensible and works with pluggable samplers, scriptable samples (e.g. Groovy), pluggable timers, data visualization addons, analysis plugins, and more.
9. Support
Find out the level of user support you can expect from the tool’s vendor. Generally, commercial vendors offer high-quality support through various channels of communication, documentation, and more.
If you go with open source software, check their community support, forums, active members, and so on.
Summary
Nobody likes waiting for a website or app to load. And when it does, they may consider other available options, resulting in you losing business. That’s why there’s a vast market need for faster websites and applications.
It’s crucial to do performance testing on your website or application to make sure they load as quickly and function as optimally as possible so your users can rely on them. By implementing the changes indicated necessary through your testing, you can achieve more conversions.
As we’ve shown, there are plenty of options available on the market for performance testing tools. Go for the ones you think will be best suited to testing your site or app’s requirements.
Did we miss any tools you use in your performance testing? Let us know in the comments section.