
A WordPress site consists of many moving parts that must work in perfect sync with server processes. PHP, the database, and the CDN must operate smoothly together. When this harmony fails, performance drops. Worse, the site can become inaccessible to visitors and customers.
You can’t always be present if your site crashes during peak times, such as Black Friday or major campaigns. That’s why notifications are not just technical; they are vital for anyone managing an online business or providing essential services.
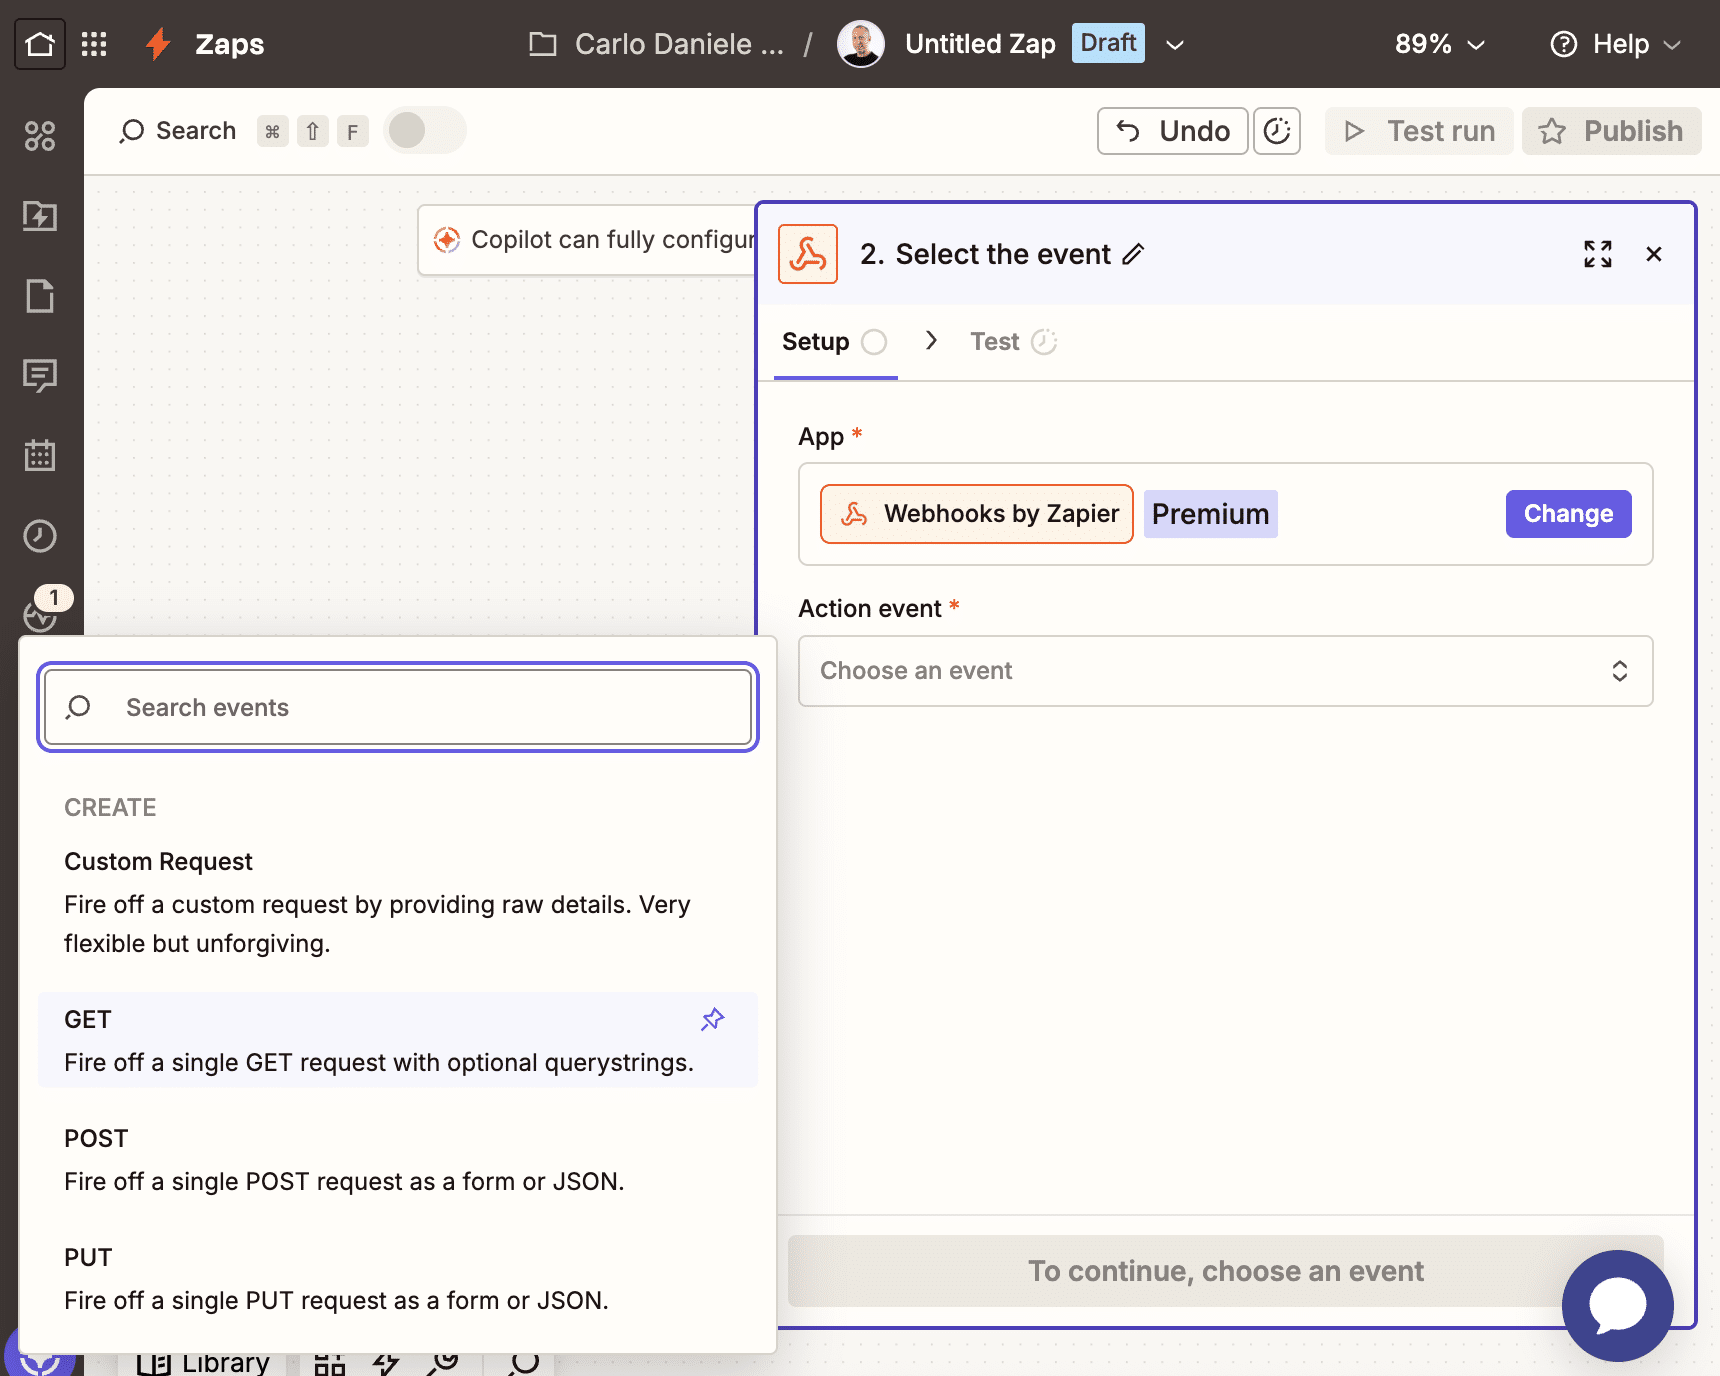
This article gives an overview of essential notifications for WordPress site management and explains how Kinsta customers can enable automatic alerts via the MyKinsta dashboard and the Kinsta API.
Let’s dive in!
Essential monitoring and notification tools for managing strategic websites
Businesses and mission-critical sites, such as e-commerce and university websites, need seamless, round-the-clock monitoring. This ensures a site is not only online but also performing at its peak.
Managing a strategic website is like conducting an orchestra. You need to track several areas at once. Here are the main areas for real-time notifications.
Uptime and critical errors
For an e-commerce site or an essential service provider, critical website errors can immediately cause financial loss or service interruptions. Inadequate hosting can lead to downtime, risking brand reputation and user trust. Yet, even with high-performance cloud hosting, unforeseen issues can arise. This makes a robust uptime monitoring system an absolute necessity.
Such a system should monitor errors like 500 Internal Server Error, 502 Bad Gateway, 504 Gateway Timeout, and database connection errors. Some of the most popular monitoring and notification tools available on the market include the following:
- UptimeRobot: This service offers real-time monitoring of uptime, SSL certificates, ports, and cron jobs. It allows you to set up instant alerts and includes an API for integrating it into your workflow.
- Better Stack: An AI-native platform offering infrastructure monitoring, status pages, log management, and distributed tracing. It also provides an API that lets you automate workflows and integrate Better Stack with the tools you use daily.
- Pingdom: Offers several types of monitoring, including Real User Monitoring (RUM), transaction monitoring, page speed analysis, and uptime monitoring. You can set up instant alerts via text message or email about issues such as error messages, HTTP status codes, and content changes.
Performance and scalability
A website must remain responsive, even during sudden traffic surges. Fast, scalable cloud hosting forms the foundation, but you also need dedicated monitoring. Such a system flags any performance drop as soon as it happens.
Monitoring is critical if your hosting is unreliable. Ironically, if your host can’t support your mission, your site might fail when your business succeeds.
The main factors to monitor are PHP threads, Time to First Byte (TTFB), and database load. When queries slow down, your entire site slows down. Monitoring tools like those below help ensure your visitors get the experience they expect.
- New Relic: New Relic is a powerful performance monitoring tool installed in your hosting environment that analyzes every process on your website. With New Relic, your IT team can identify PHP threads or database queries that are slowing down your site. It allows you to identify plugins or scripts that are not optimized for performance, spot potential conflicts, and resolve structural bottlenecks before they affect the end-user experience.
- Pingdom: As mentioned in the previous section, Pingdom is a tool for uptime monitoring. However, this powerful monitoring tool’s real strength lies in Real User Monitoring (RUM) and synthetic speed tests. Pingdom tests your site from different geographic locations every few minutes, measures TTFB, and sends you a notification if server response times slow down.
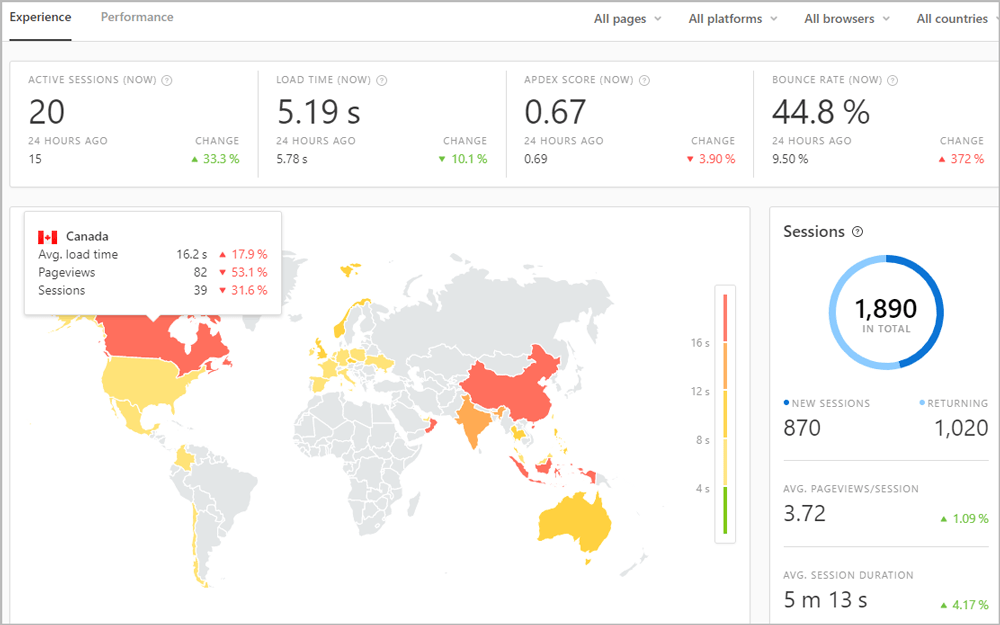
Real User Monitoring metrics in the Pingdom dashboard (Image source: Pingdom) - GTmetrix/PageSpeed Insights: These are two powerful performance monitoring tools that analyze page structure and provide key metrics for optimizing content. Both services provide APIs for automated testing and for sending notifications when the performance score falls below a set threshold.
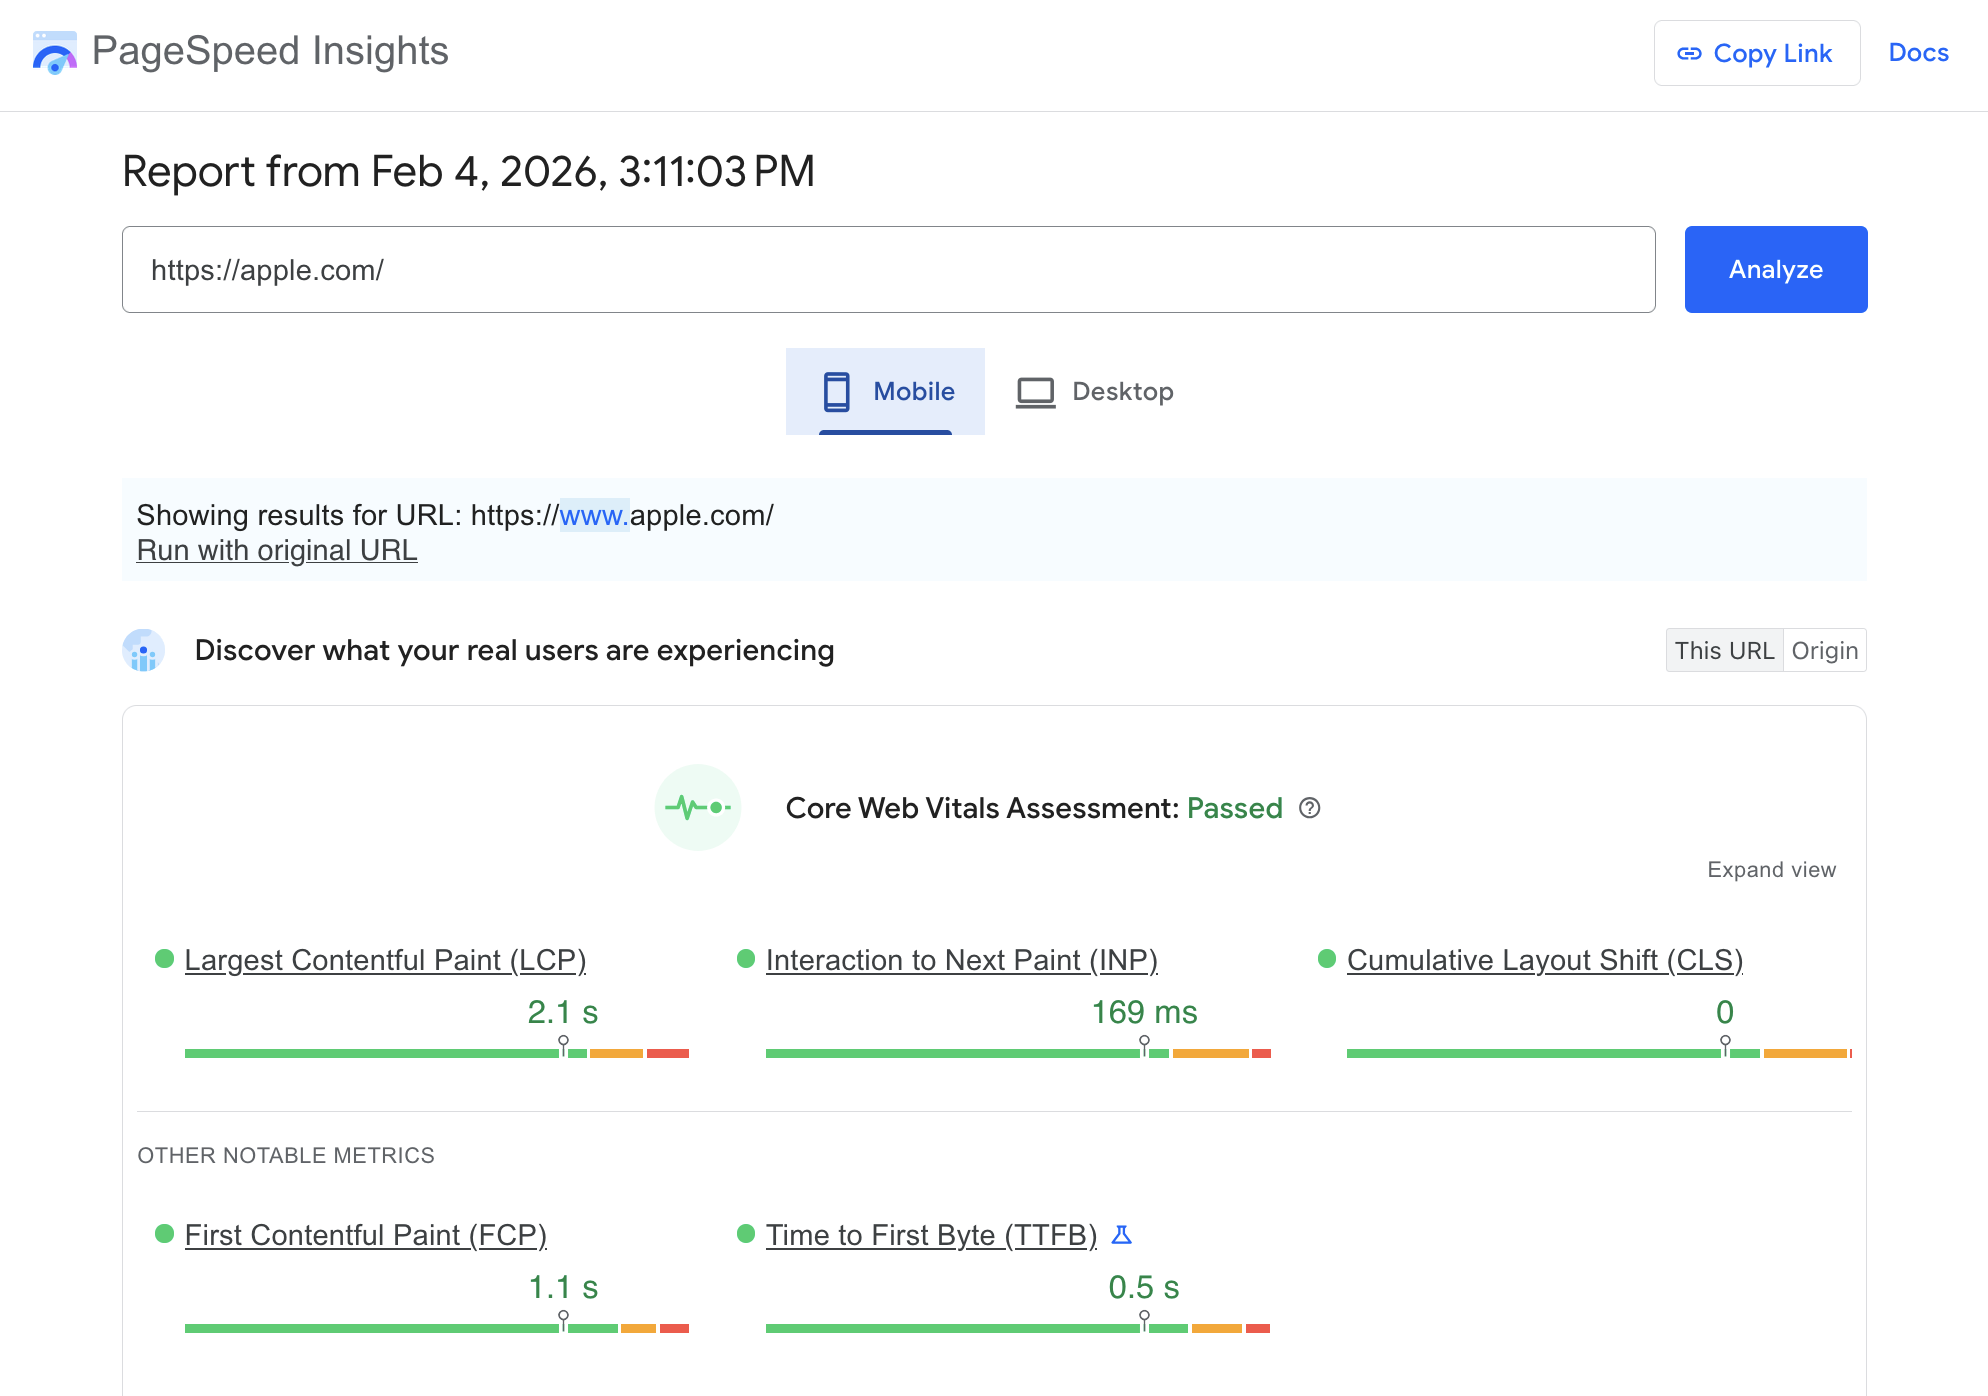
Core Web Vitals assessment in PageSpeed Insights (Source: PageSpeed Insights) - Datadog: Datadog is an enterprise-level tool designed for high-traffic websites, including large e-commerce sites, news sites, and university portals. Datadog aggregates traffic and server load data into useful metrics and diagrams that provide essential information to improve your website’s UX and optimize its performance.
Security and SSL
Monitoring is perhaps most critical when it comes to security, because ensuring the site’s resilience against attacks and the integrity of the stored data is vital to you and your customers.
Security monitoring should cover SSL certificate validity, DNS and domain integrity, unauthorized access attempts, and vulnerabilities.
- Sucuri/Wordfence: These are two powerful WordPress plugins that offer proactive detection and monitoring, intrusion protection and prevention, firewalling, and real-time alerts for security vulnerabilities (see also our comparison of Sucuri and Wordfence).
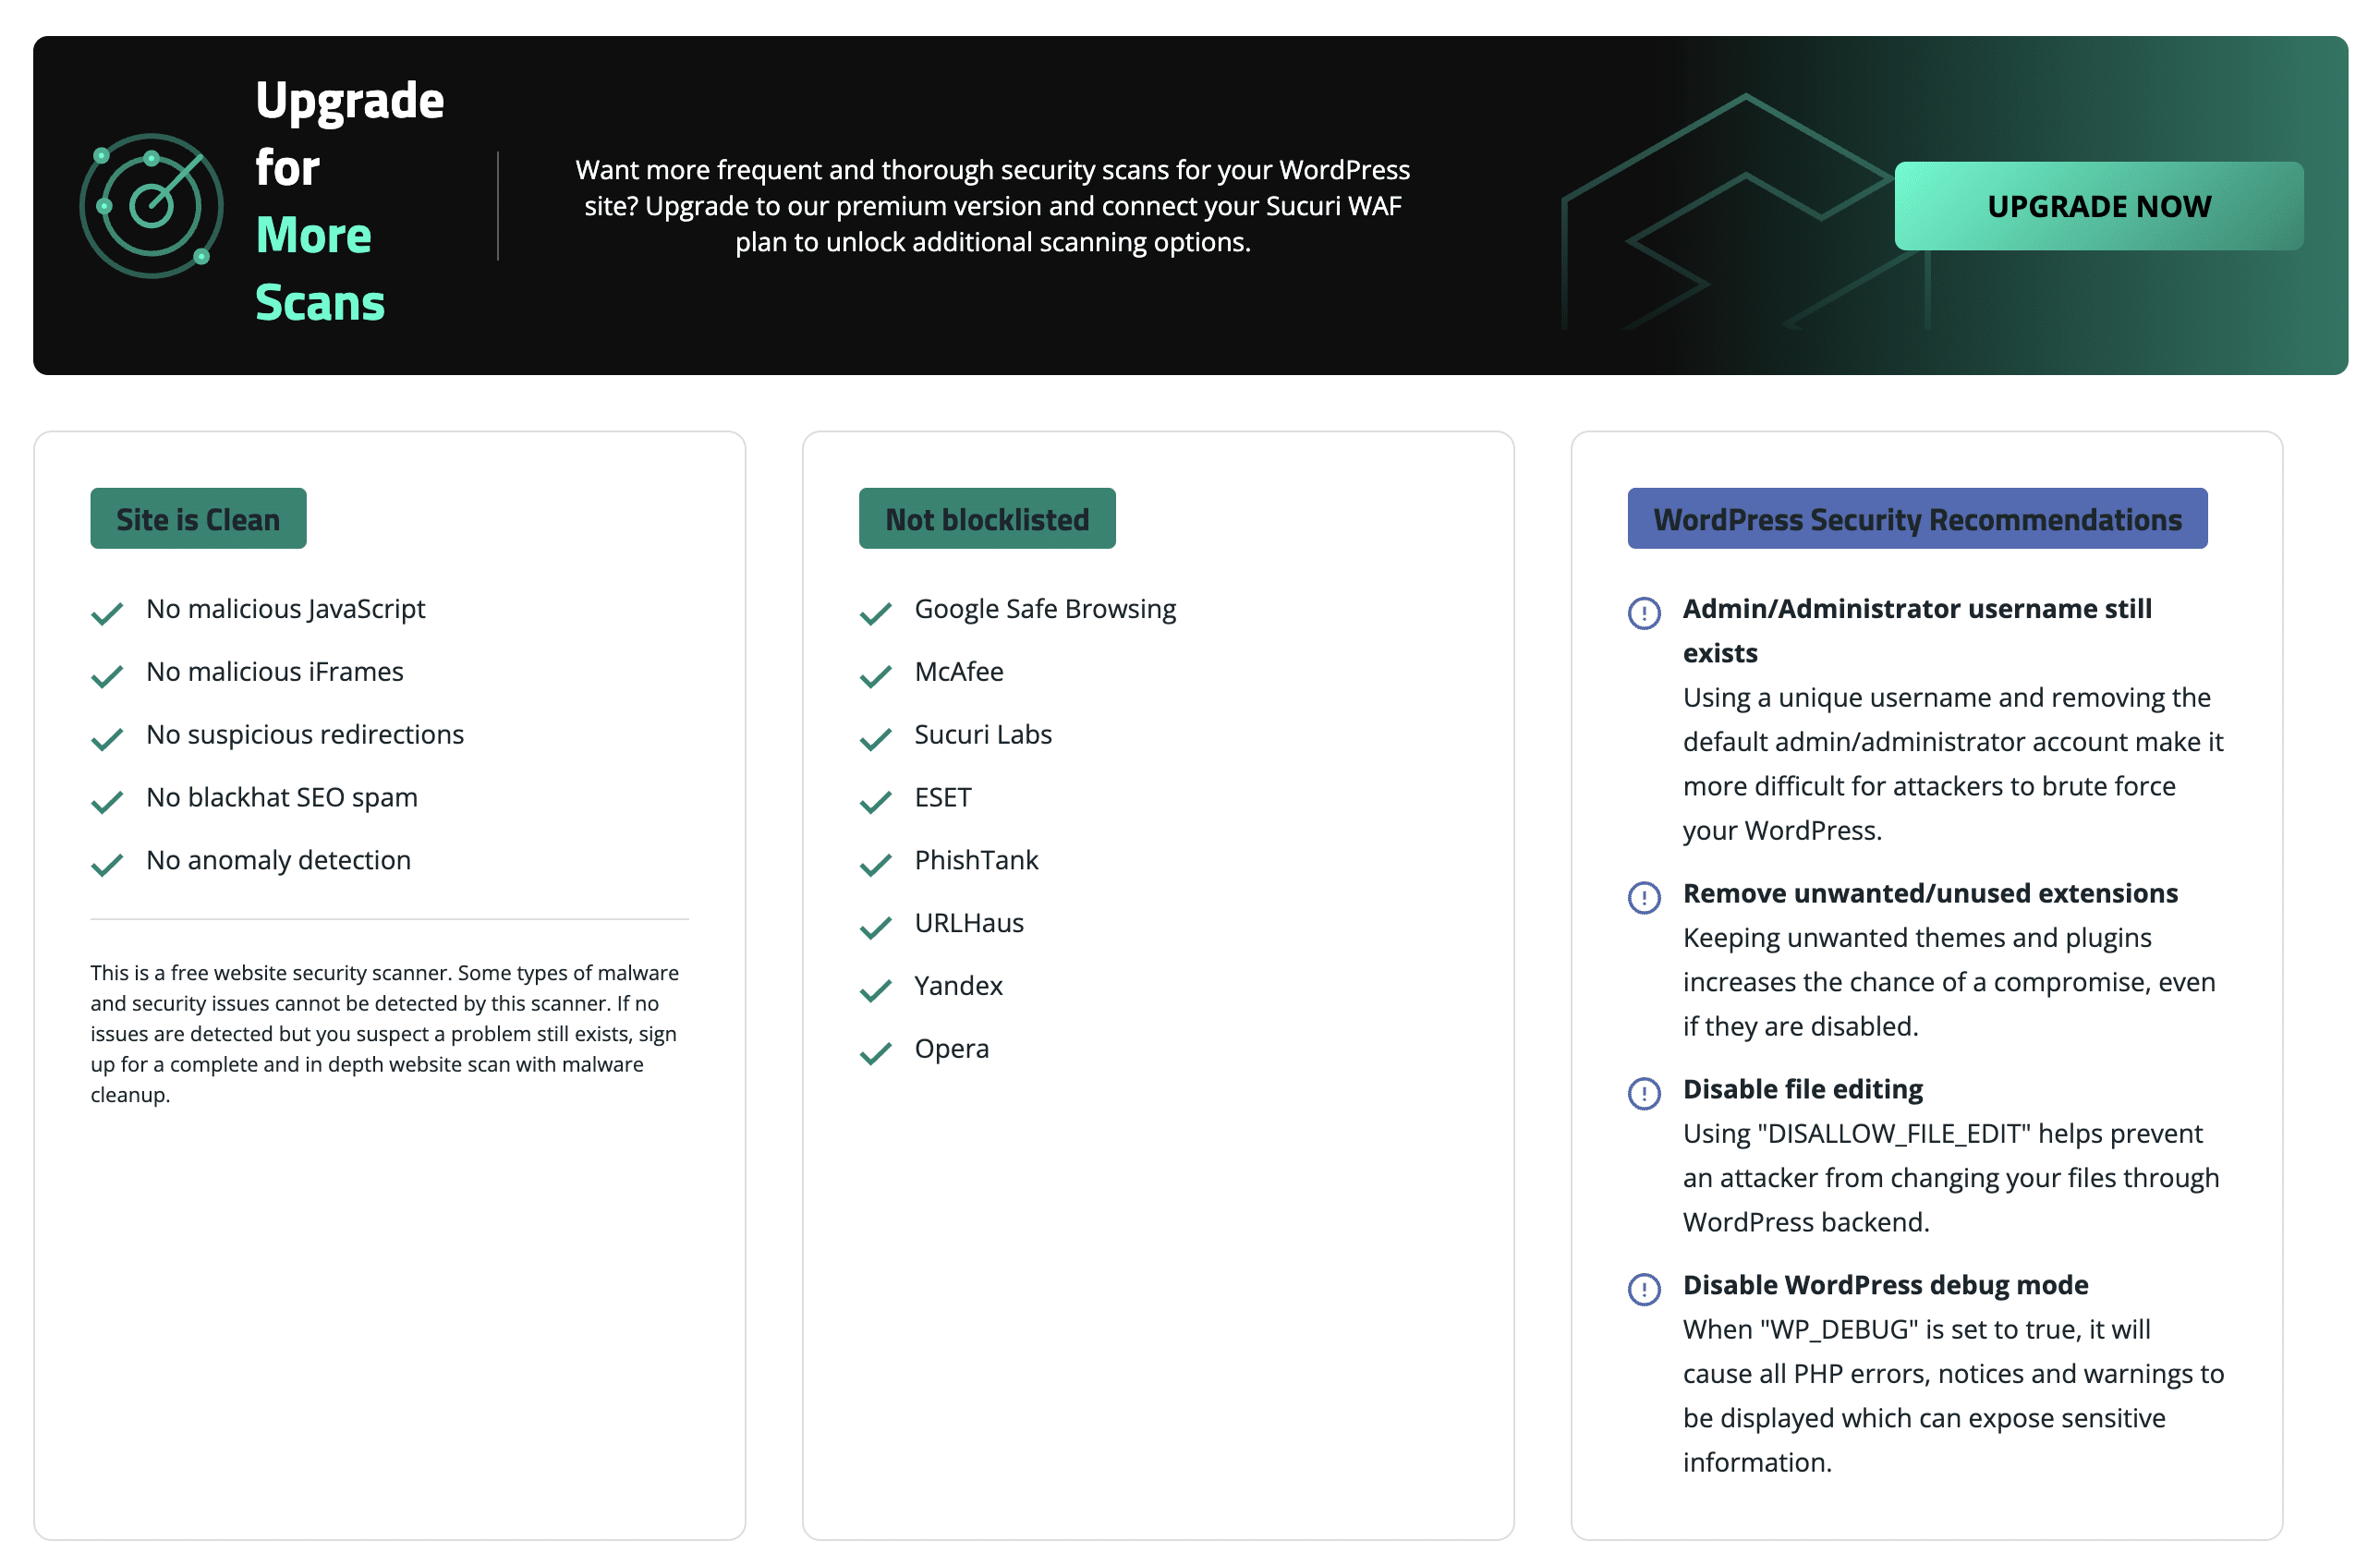
Sucuri Security plugin’s dashboard - Other security monitoring tools include HackerOne, Detectify, Qualys, and many others.
Bandwidth Overages
Monitoring bandwidth consumption ensures that your site’s infrastructure can handle the load generated by site views, especially when your site receives a high traffic volume (the holiday season for an e-commerce website or the pre-enrollment period for an educational site).
- Cloudflare is the most popular and powerful bandwidth monitoring tool. It acts as a proxy, analyzing and filtering all incoming traffic, provides a firewall with built-in DDoS protection to guard against these attacks, and offers analytics to monitor your site’s activity, including bandwidth usage and savings. Cloudflare also provides automatic notifications that vary depending on your plan.
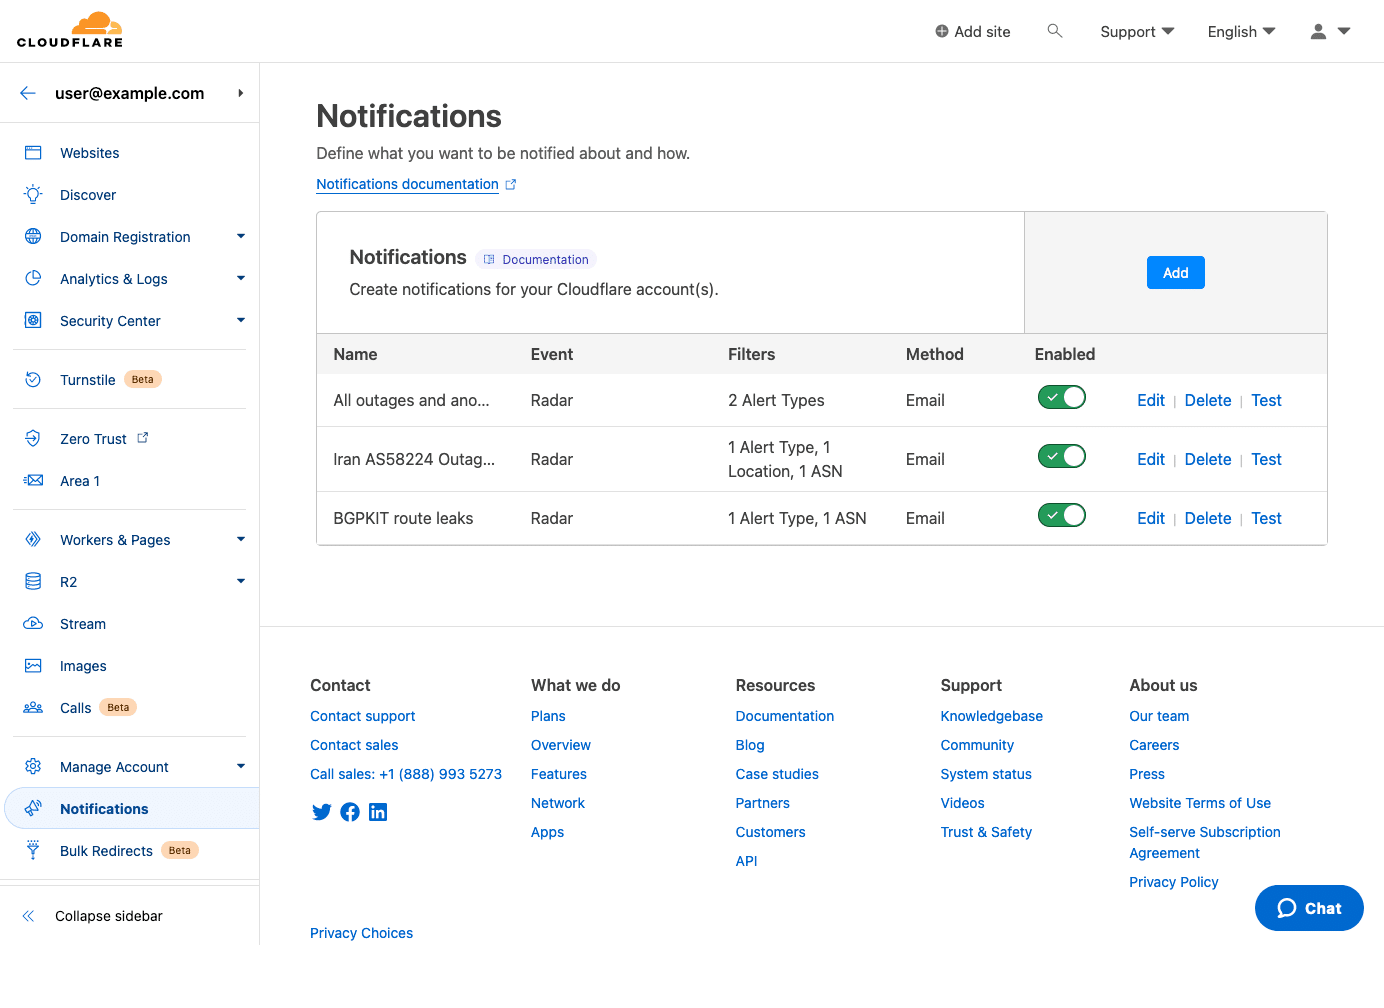
Cloudflare’s Notifications dashboard (Image source: Cloudflare) - cPanel/Plesk: Hosting management dashboards typically include analytics modules that track daily and monthly bandwidth usage. You can often set warning thresholds to receive a notification when you exceed 80% of the server’s monthly limit.
It should now be clear that implementing a comprehensive monitoring and notification system is essential. Unfortunately, while choosing the right tools is challenging enough, learning and configuring them can be even more problematic.
This process requires time and resources that could be put to better use. You also have to consider the additional costs these tools often entail. Some offer free plans, but they are often not an option for high-traffic sites.
Kinsta customers have it easy because Kinsta offers an advanced, comprehensive monitoring system that covers all components of your website’s success, including uptime, performance, security, and bandwidth consumption. It also has a customizable notification system that alerts you to critical events on your site or when resource consumption thresholds are reached.
That said, let’s take a closer look at the monitoring and notification tools you can easily enable from your MyKinsta dashboard.
Monitoring and notifications at Kinsta
Kinsta constantly monitors your site’s uptime and runs continuous security scans. If you’ve selected Kinsta as your hosting partner, you may occasionally receive notifications about account statuses or events that require your attention.
Some notifications are mandatory and cannot be disabled. These are system messages that provide information about critical updates or changes, such as PHP deprecation warnings. They are sent via email to company owners, company administrators, company developers, site developers, and site administrators.
Then, according to your preferences, you can enable or disable changes in MyKinsta. To access the notification configuration page, click your name in the upper right corner of the MyKinsta dashboard, then click User Settings.
Next, in the left sidebar, select Notifications.
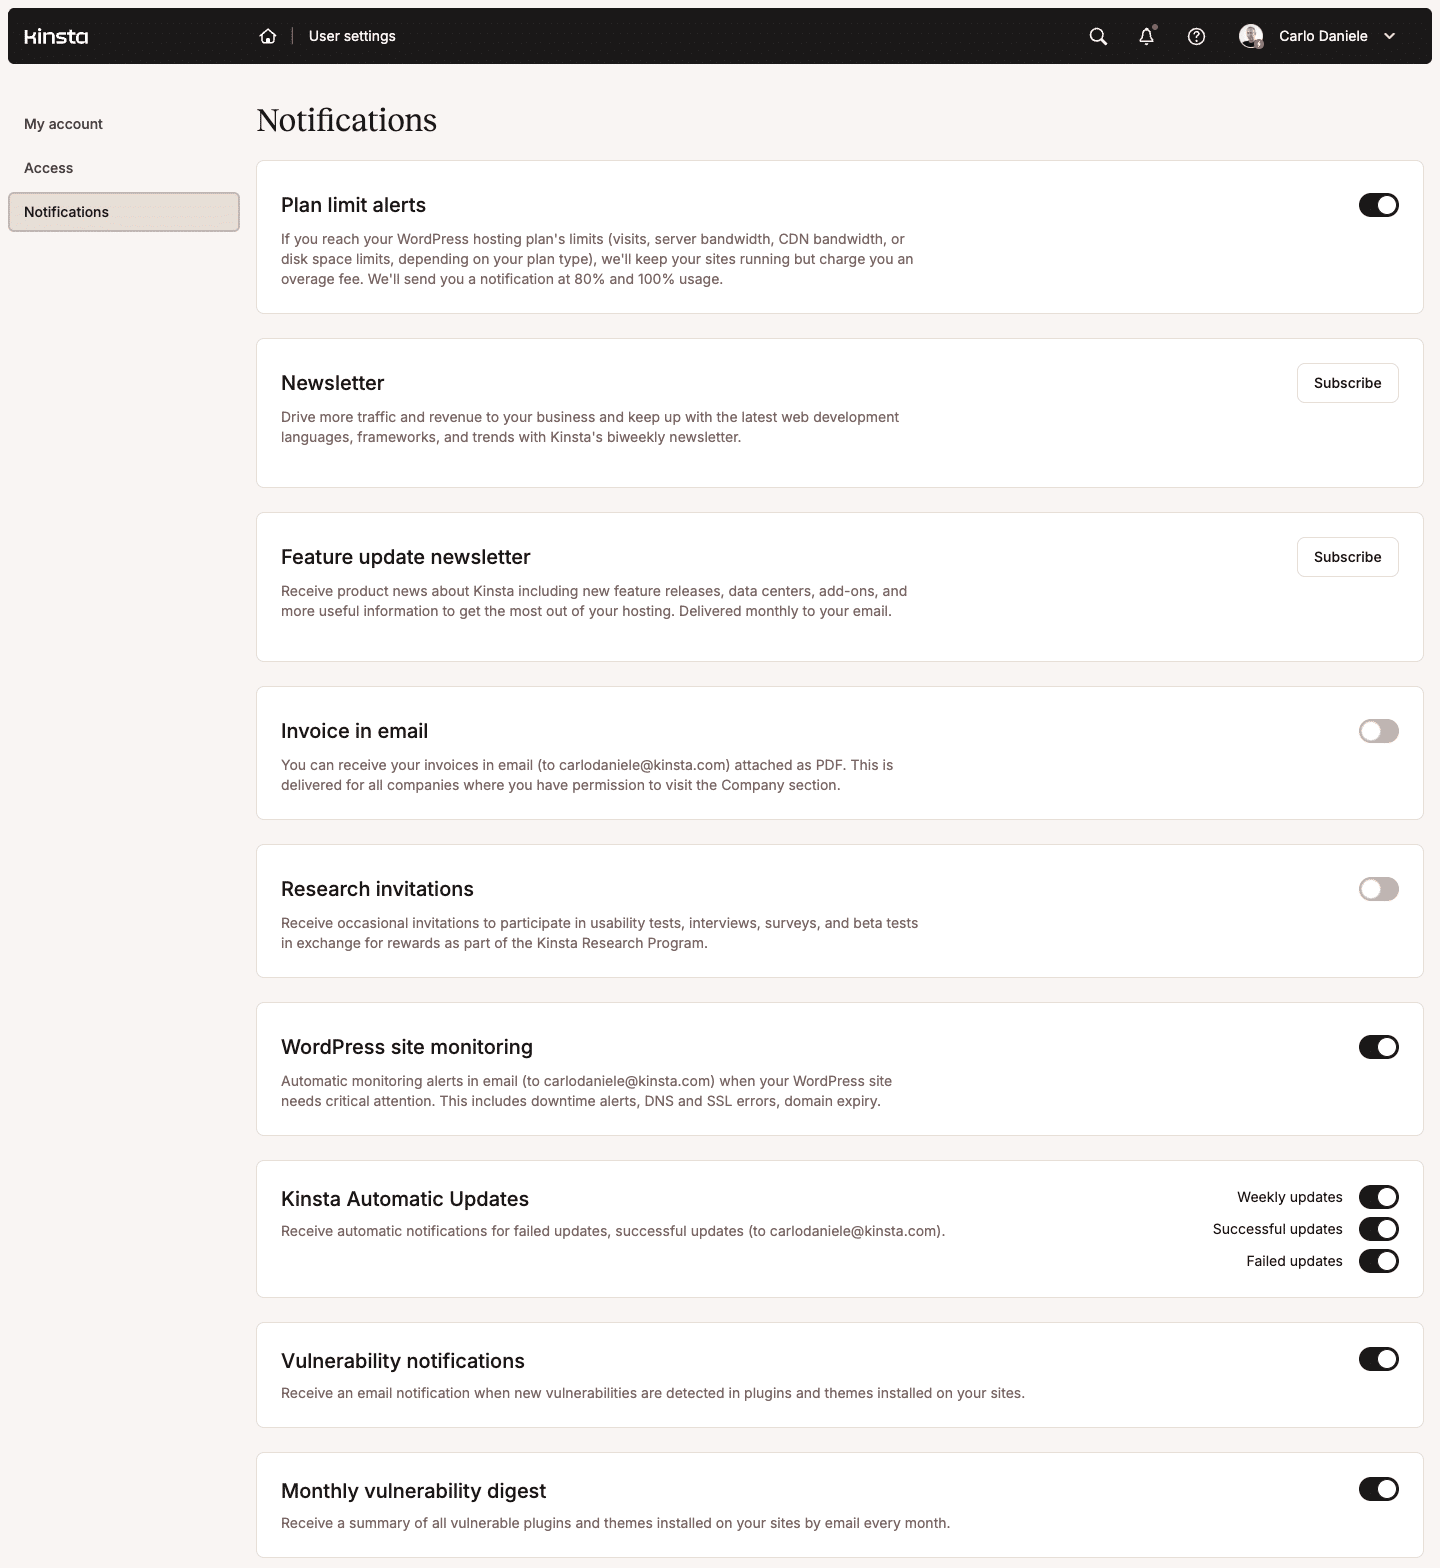
The Notifications page is divided into sections, each dedicated to a specific notification type. Let’s take a closer look at each of them.
Plan limit alerts
Each Kinsta plan includes a set amount of allocated resources, including monthly visits, server bandwidth, SSD disk space, and CDN bandwidth. If your websites consume more resources than allocated during the billing period, they won’t go down; however, you may incur overage charges.
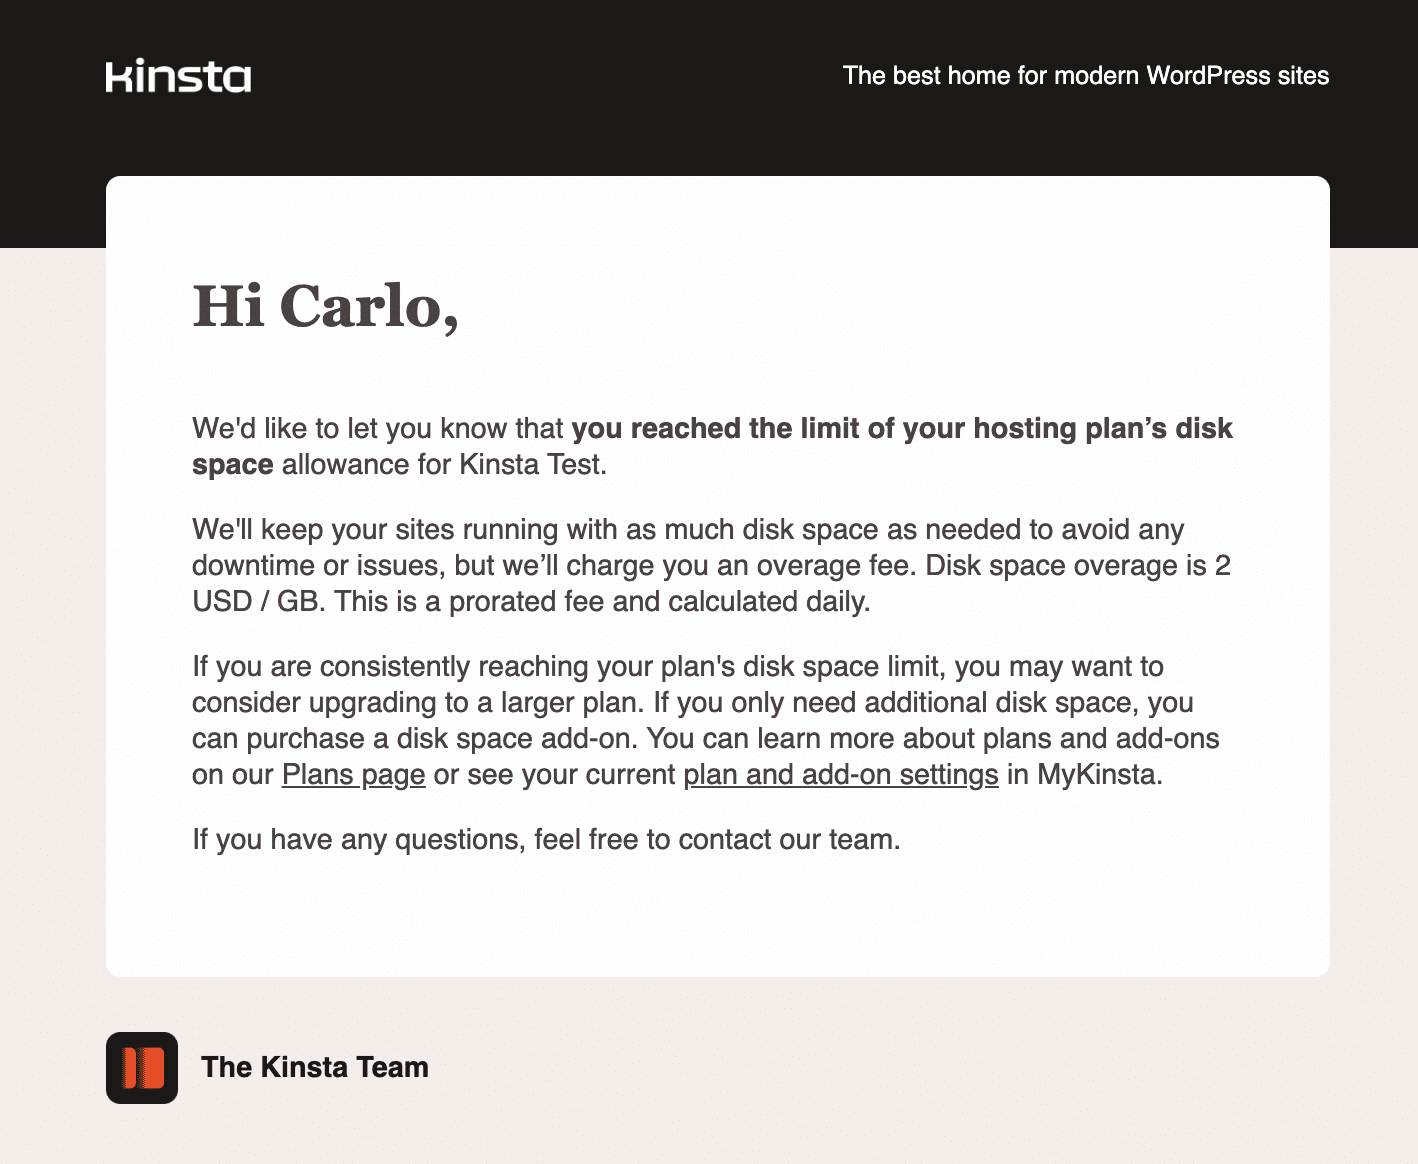
However, if you enable plan limit alerts, you will be notified before you exceed your plan’s resource limits. You will receive an email notification when you reach 80% and 100% of your limits. These notifications allow you to promptly investigate and take action to avoid unexpected overage fees.
You can view the same notification in MyKinsta by clicking the Notifications icon in the top right corner of the navigation bar.
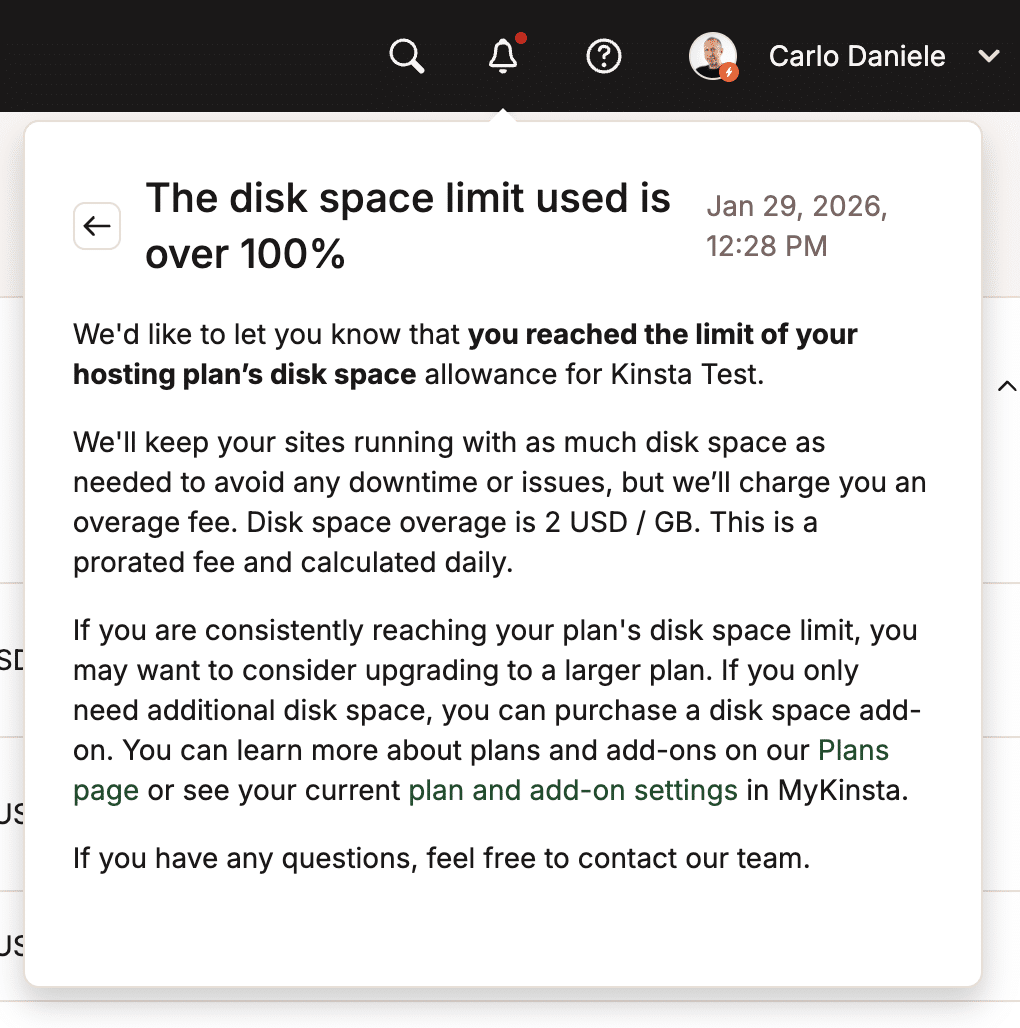
Below are the types of plan-limit notifications you may receive from Kinsta.
Visits
The strategy you adopt for site visits will differ depending on whether you are receiving an overload of genuine or undesired visits. For instance, you may have launched a marketing campaign or received backlinks from a high-traffic site. However, a sudden spike in visits could also be due to suspicious activity from specific IP addresses, hotlinking, or bot traffic.
You can start your audit by checking your site’s analytics page. MyKinsta provides information to help you identify the top countries, cities, and IP addresses of your users. To view this information, navigate to Sites > site name > Analytics, then click Geo & IP.
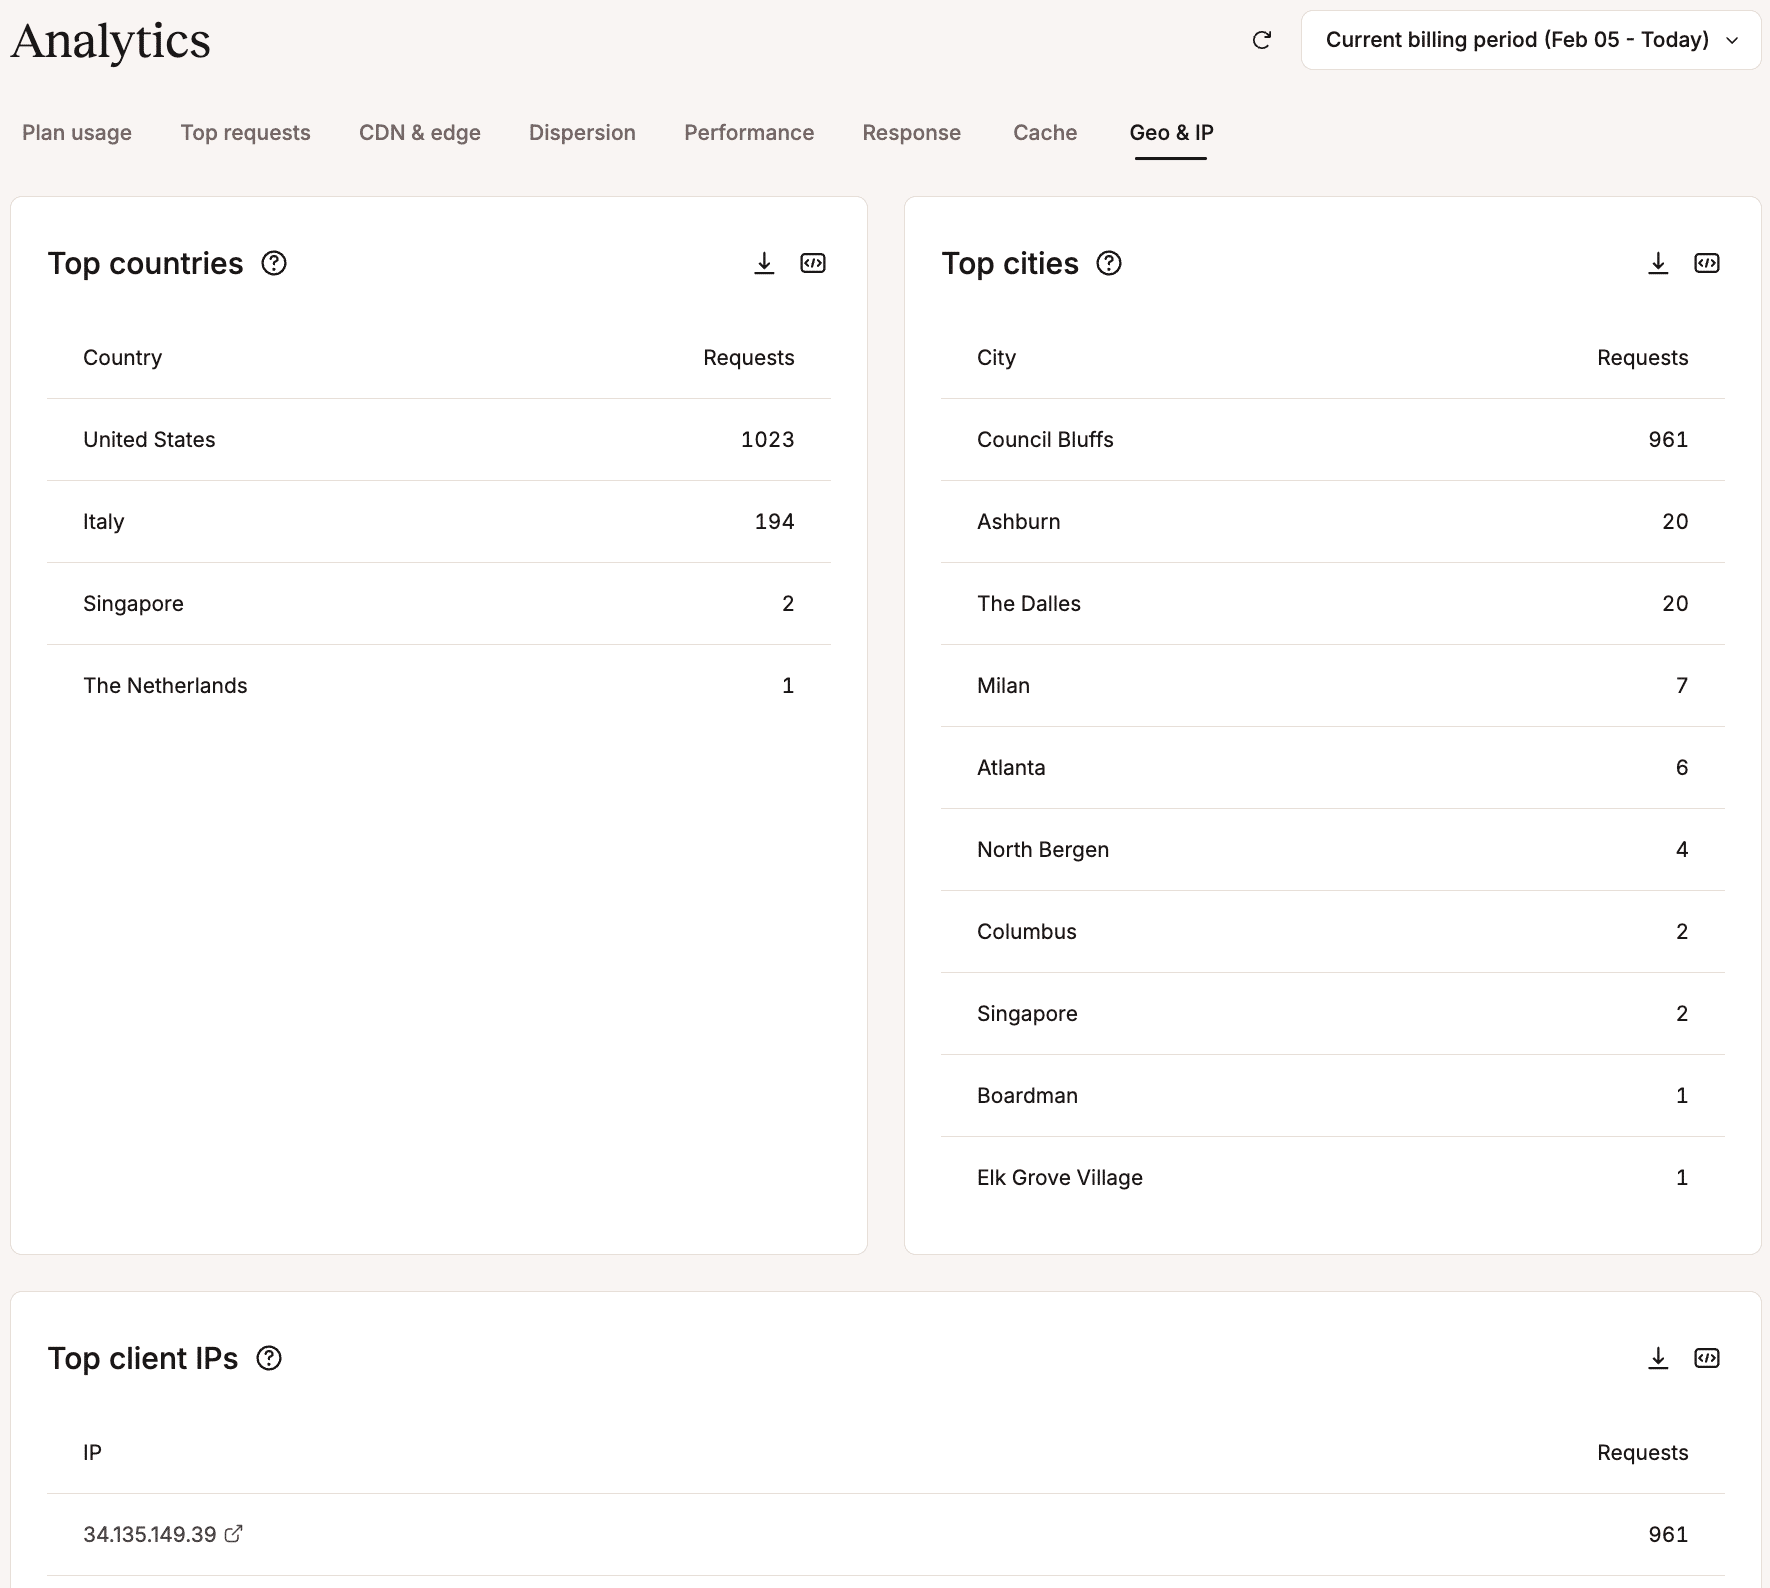
If you notice an overload of visits from a country or city that is not part of your target market, you can adopt two different strategies:
- You can contact our support team to set up geo-blocking with server-side rules to filter traffic from those countries.
- You can redirect traffic from specific countries or cities by enabling IP geolocation in MyKinsta. This strategy is not intended to restrict access from unwanted sources. Rather, it is designed to direct your visitors to the resources intended for them. The goal is to best serve your target markets.
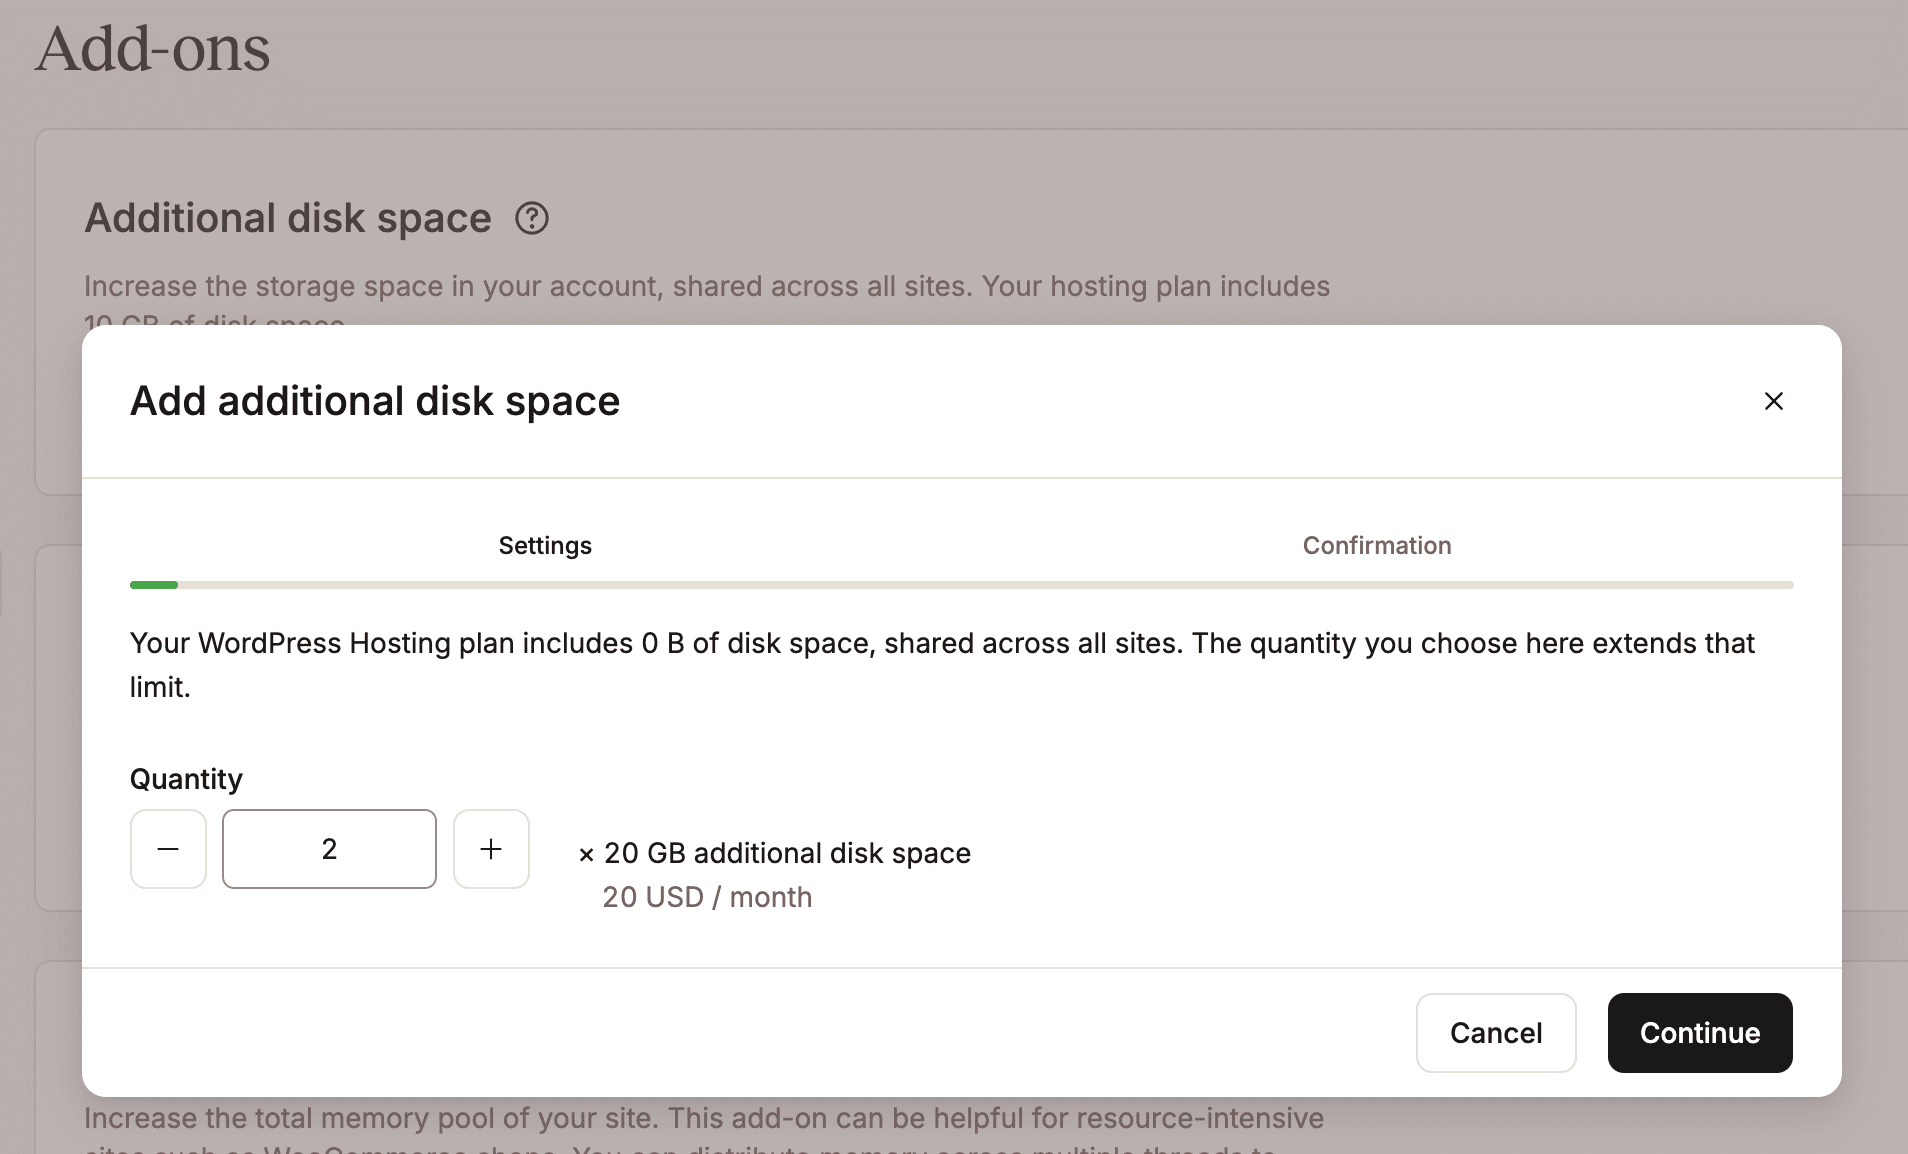
Disk space
If the problem is disk space consumption, you may realize that your images and media files are not optimized. There are several ways to reduce the space your media uses. First, optimize your media before uploading. However, for high-volume sites, we recommend hosting large videos and images on external platforms such as YouTube or Vimeo, or on a dedicated cloud storage platform, to keep your WordPress installation light and fast.
Another option is to purchase our disk space add-on to increase disk storage without upgrading your plan. This add-on is available in 20 GB increments for $20 per month, and you can add as many as you need to your plan. This allows you to avoid the overage fee without upgrading to a higher plan. Alternatively, you can review your media storage strategy by moving your media to an off-site cloud storage site.
Server and CDN bandwidth
Receiving a notification for server bandwidth consumption may mean that your site is not optimized for performance. Enabling Kinsta’s Content Delivery Network (CDN) and Cloudflare’s Edge Caching can prevent many bandwidth issues. Enabling our CDN also unlocks image optimization with automatic conversion to WebP.
Another possible cause of excessive bandwidth consumption is hotlinking. If a website is hotlinking from your site, you can simply contact our support team to enable server-side hotlink protection.
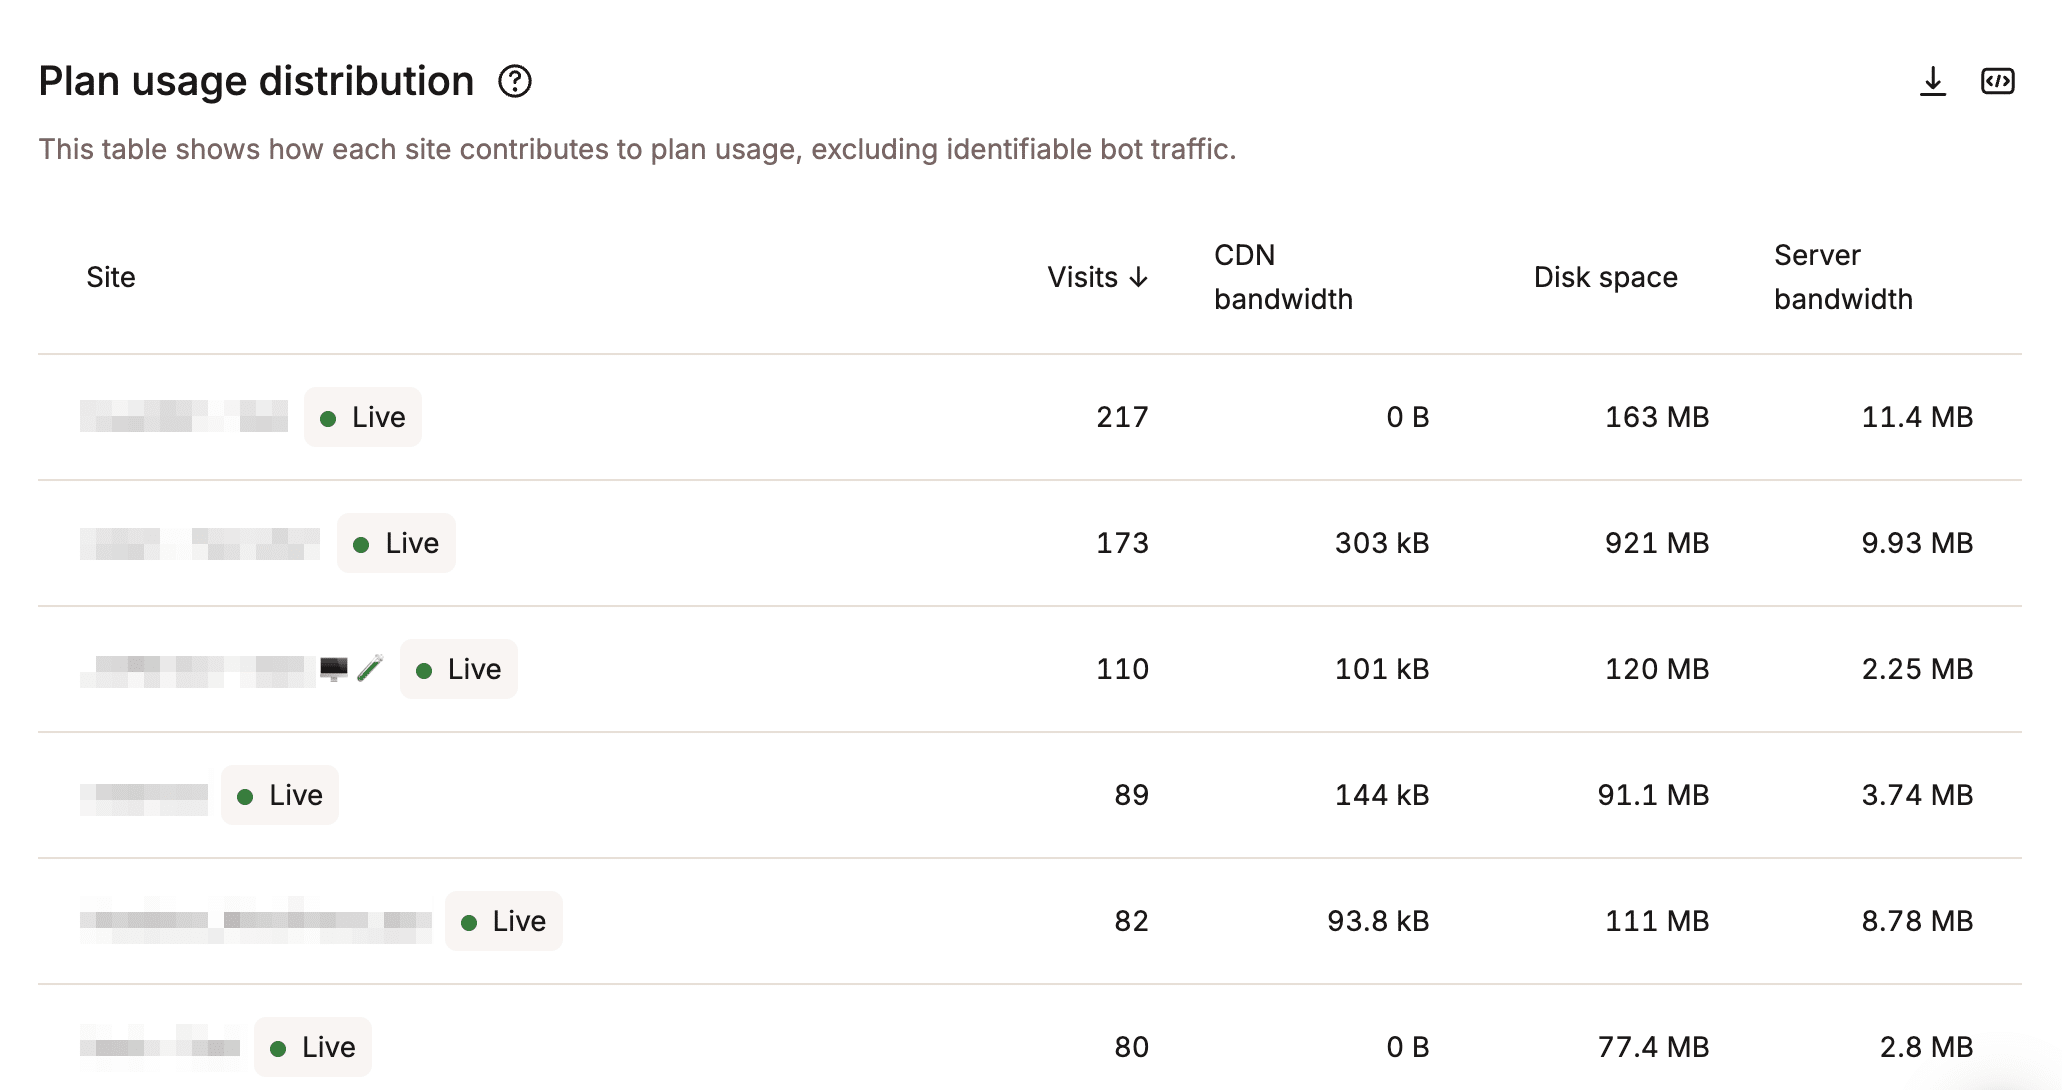
Another key metric for resource consumption is CDN bandwidth. Abnormal CDN bandwidth consumption may mean that a lot of data is being transferred from Cloudflare’s servers to your site visitors. If this value looks excessive, you may want to investigate further. Common causes include:
- Unoptimized static files: You may have many big images, perhaps directly uploaded as raw files from your DSLR. As a first step, check if your images are optimized. If not, enable automatic image optimization in MyKinsta.
- Bot and Scraping Attacks: Many malicious bots scan your site’s content and download all the code and images. As with server bandwidth consumption, there are several strategies you can implement to combat this, such as blocking or geo-blocking specific IP addresses, moving video content to video-sharing platforms like YouTube or Vimeo, and enabling content delivery network (CDN) image compression.
WordPress site monitoring
Manually checking dozens or hundreds of client sites is simply impossible. Therefore, a notification system that sends automatic alerts or emails whenever an issue interrupts your WordPress site’s operation is vital.
If your site isn’t hosted on Kinsta, then you’re probably paying for one or more third-party tools to send you messages or emails when critical events occur. Kinsta customers don’t have to worry about paying for or configuring an additional service to monitor site uptime and health because Kinsta automatically monitors your WordPress site every three minutes, 480 times a day. If our system detects that your site is not loading, it immediately notifies our engineers, who then take action to restore it.
In addition, when WordPress site monitoring notifications are enabled in MyKinsta, we’ll send you a notification every time we detect one of the errors below in 3 consecutive checks:
- Site Errors
- DNS Errors
- SSL Errors
- Domain Expiration
Since the notification is sent only after the third check, you will not be notified of every minor error. You will only be emailed if the problem persists.
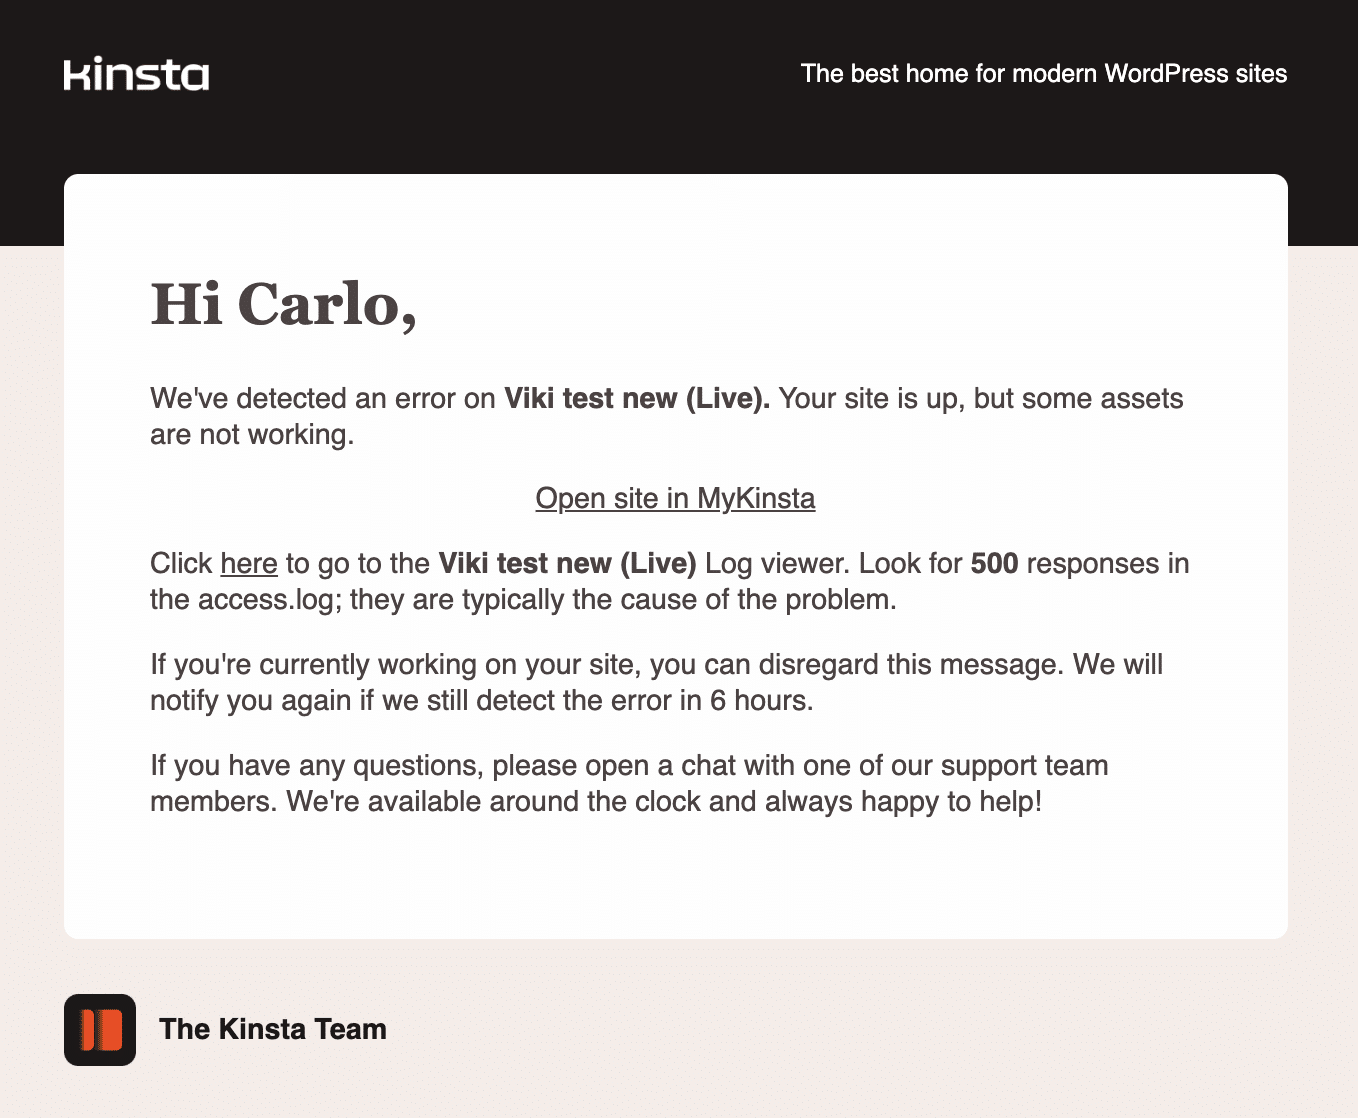
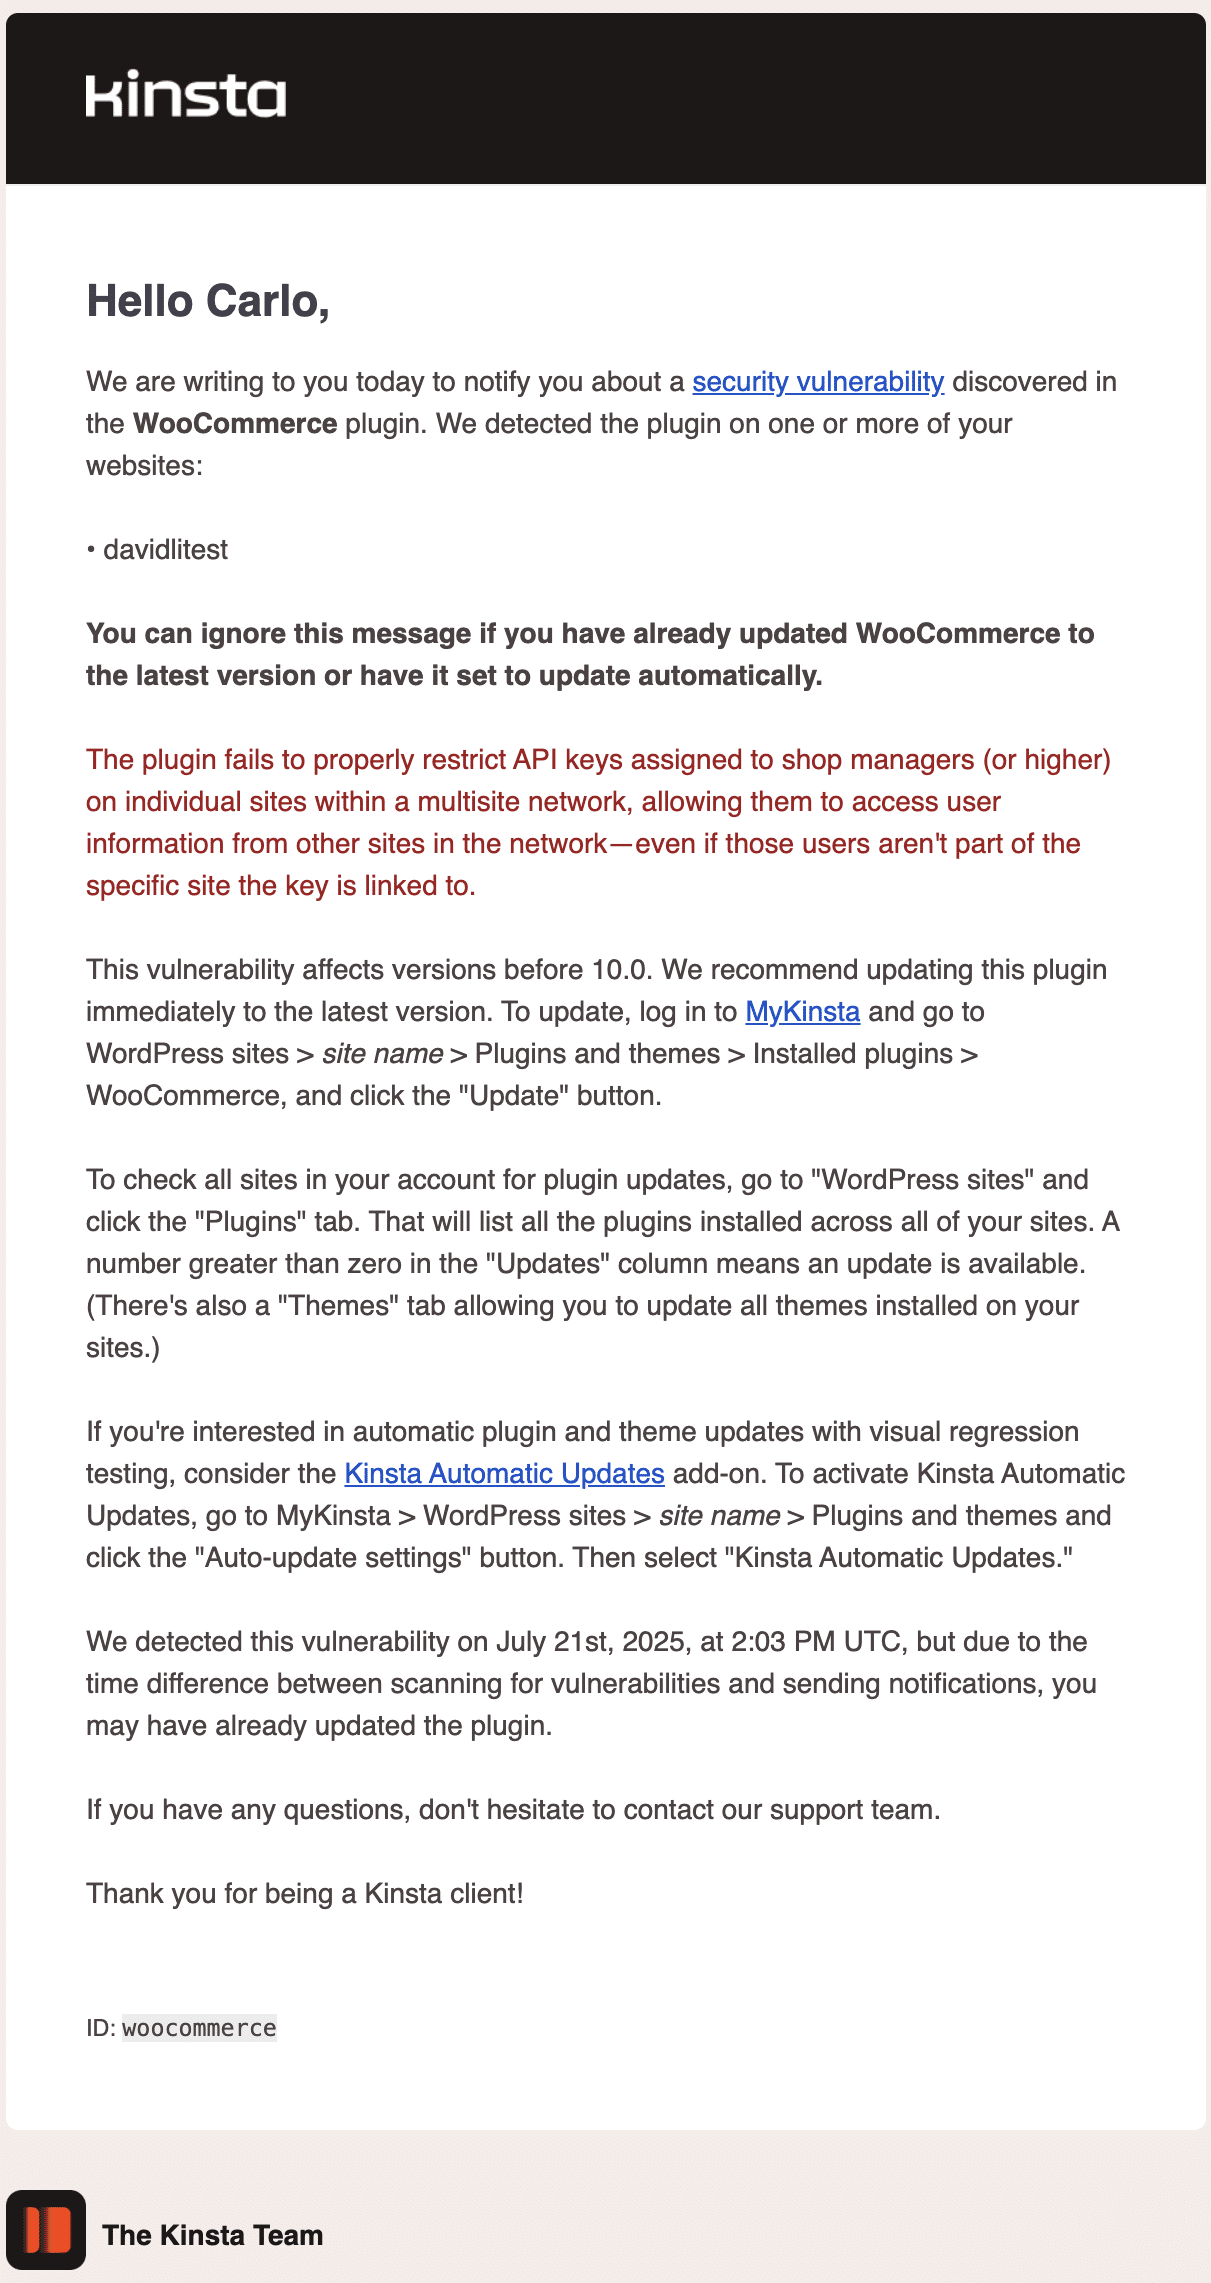
The following image shows an error notification email sent from a test WordPress site hosted by Kinsta.
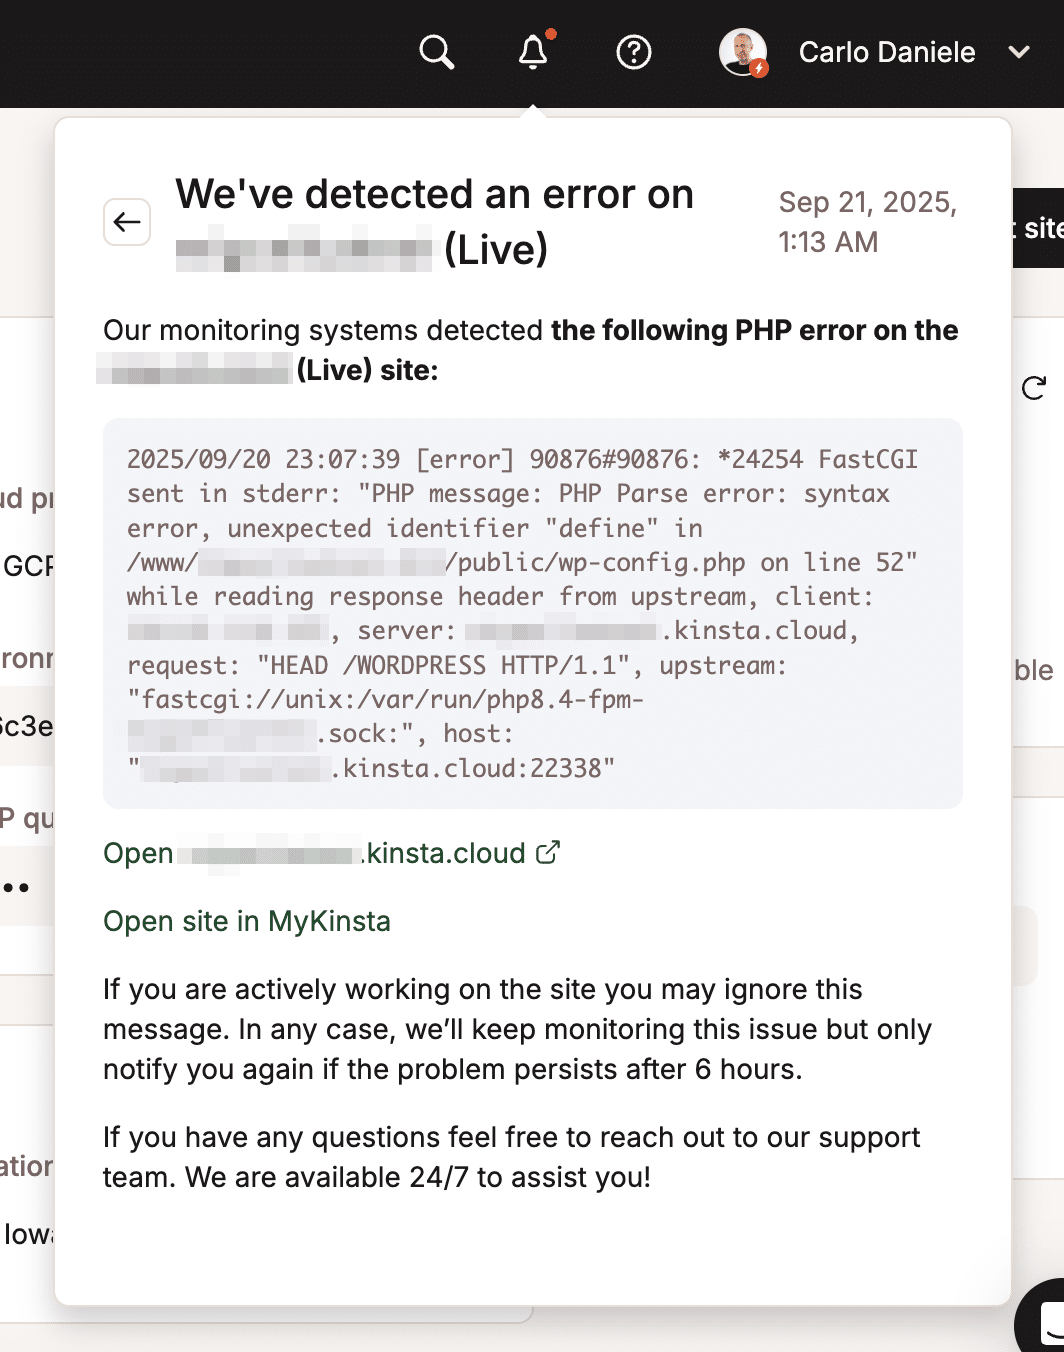
The next image shows a PHP error in MyKinsta Notifications.
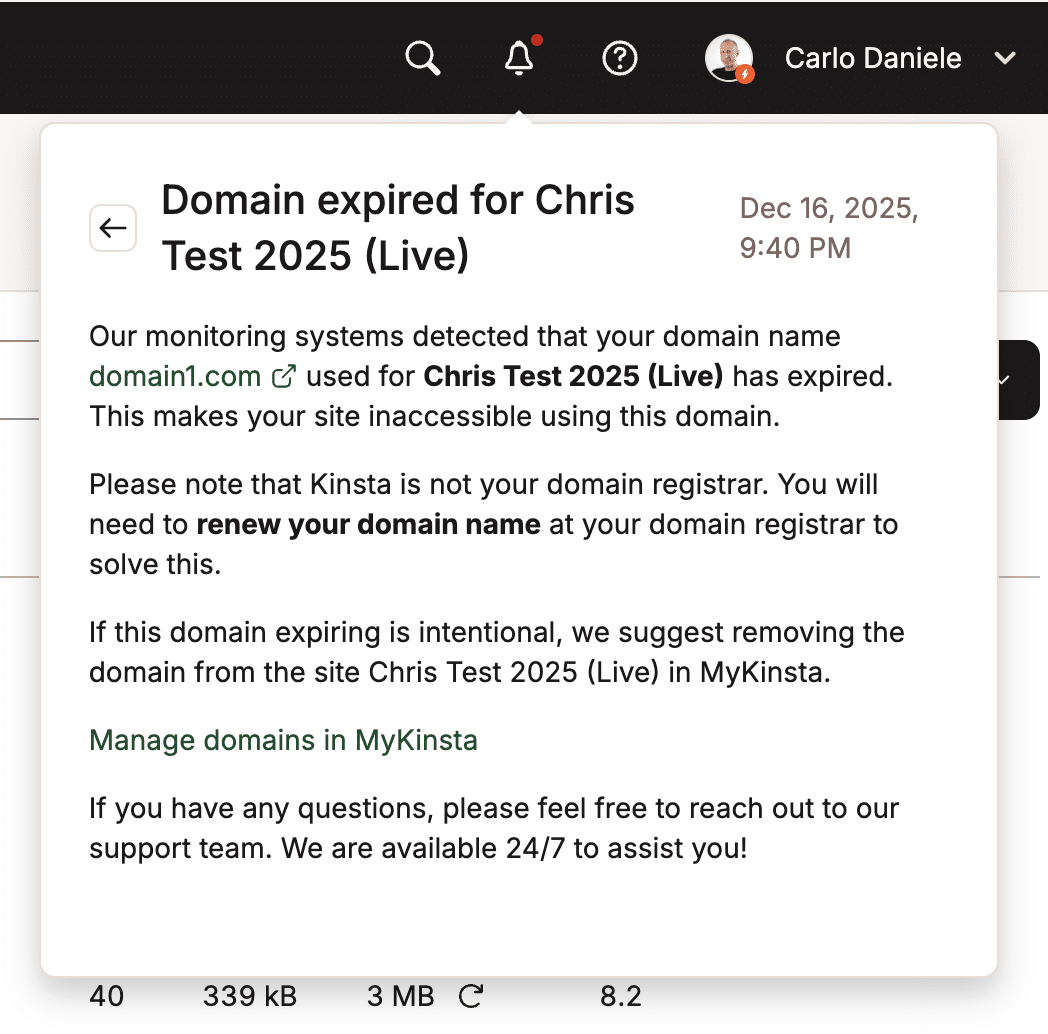
Finally, the next image shows a domain expiration error notification:
What to do when you receive a WordPress site monitoring notification
A site error notification means that your visitors cannot view your site content. These errors often appear as 5xx error codes, such as 500 Internal Server Error or 502 Bad Gateway.
There are several steps you can take to try to restore your WordPress site. First, try restarting your site’s PHP engine. If you recently installed or updated a plugin or theme, temporarily disable it to check for conflicts.
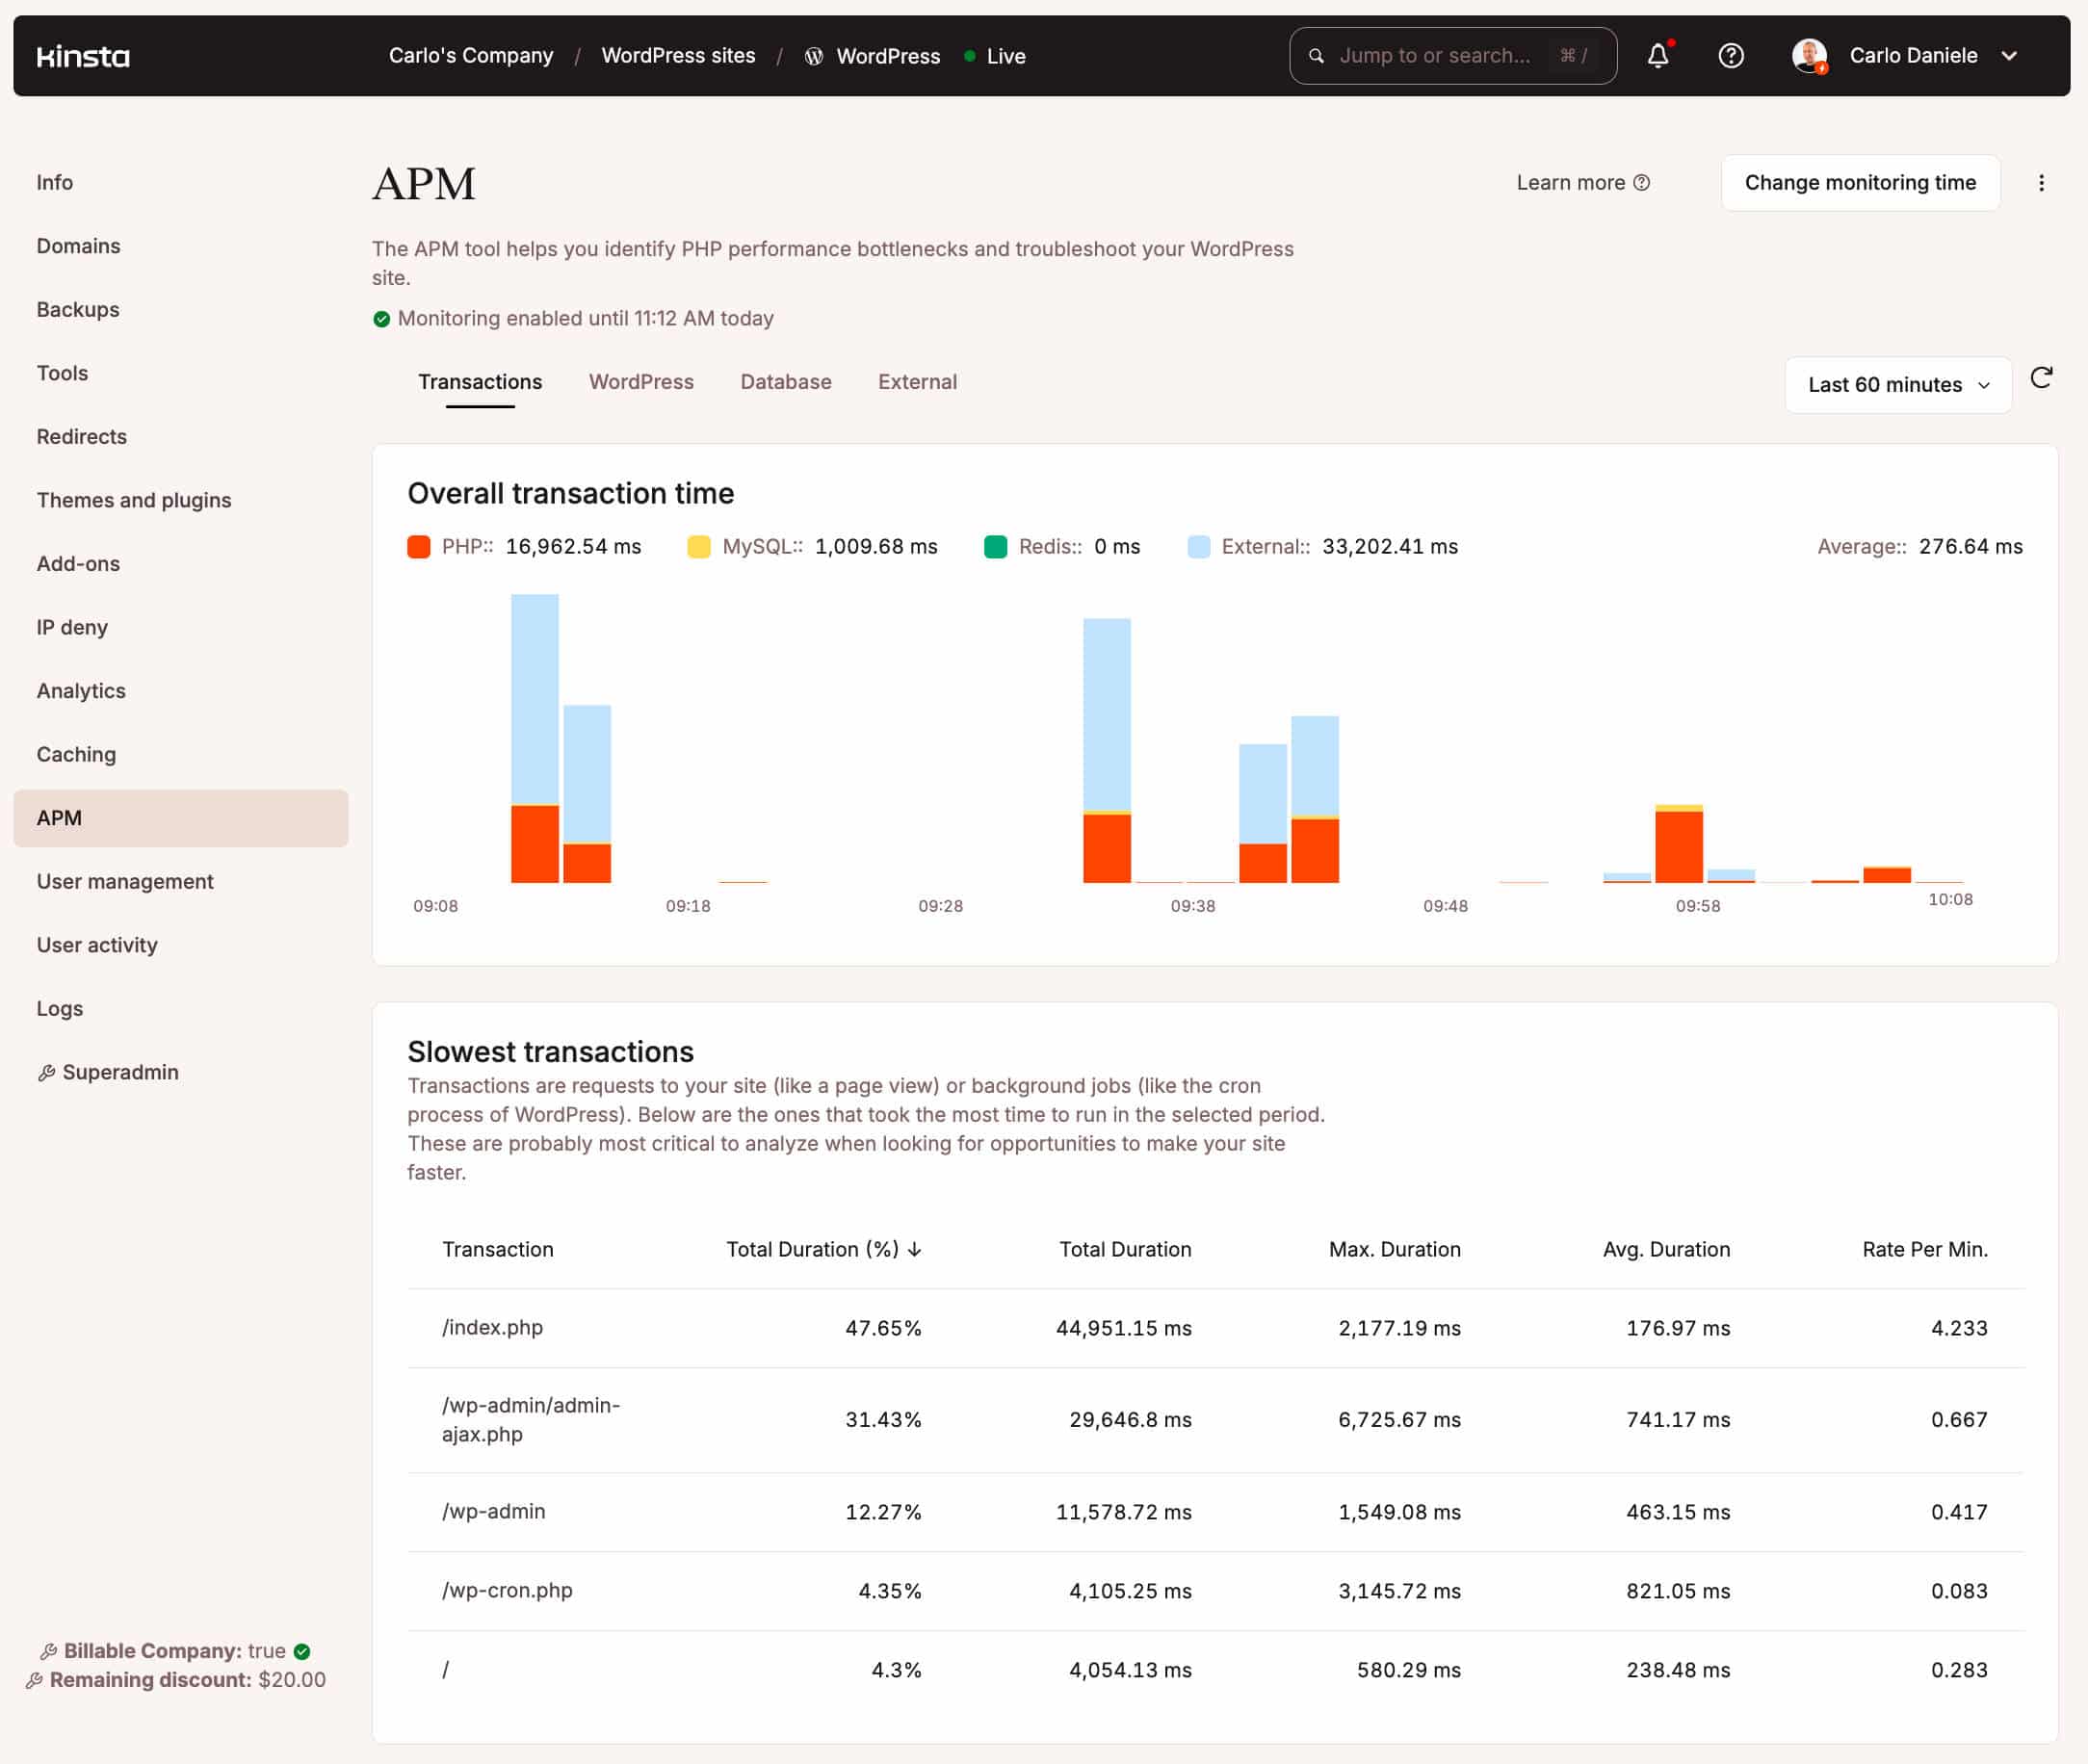
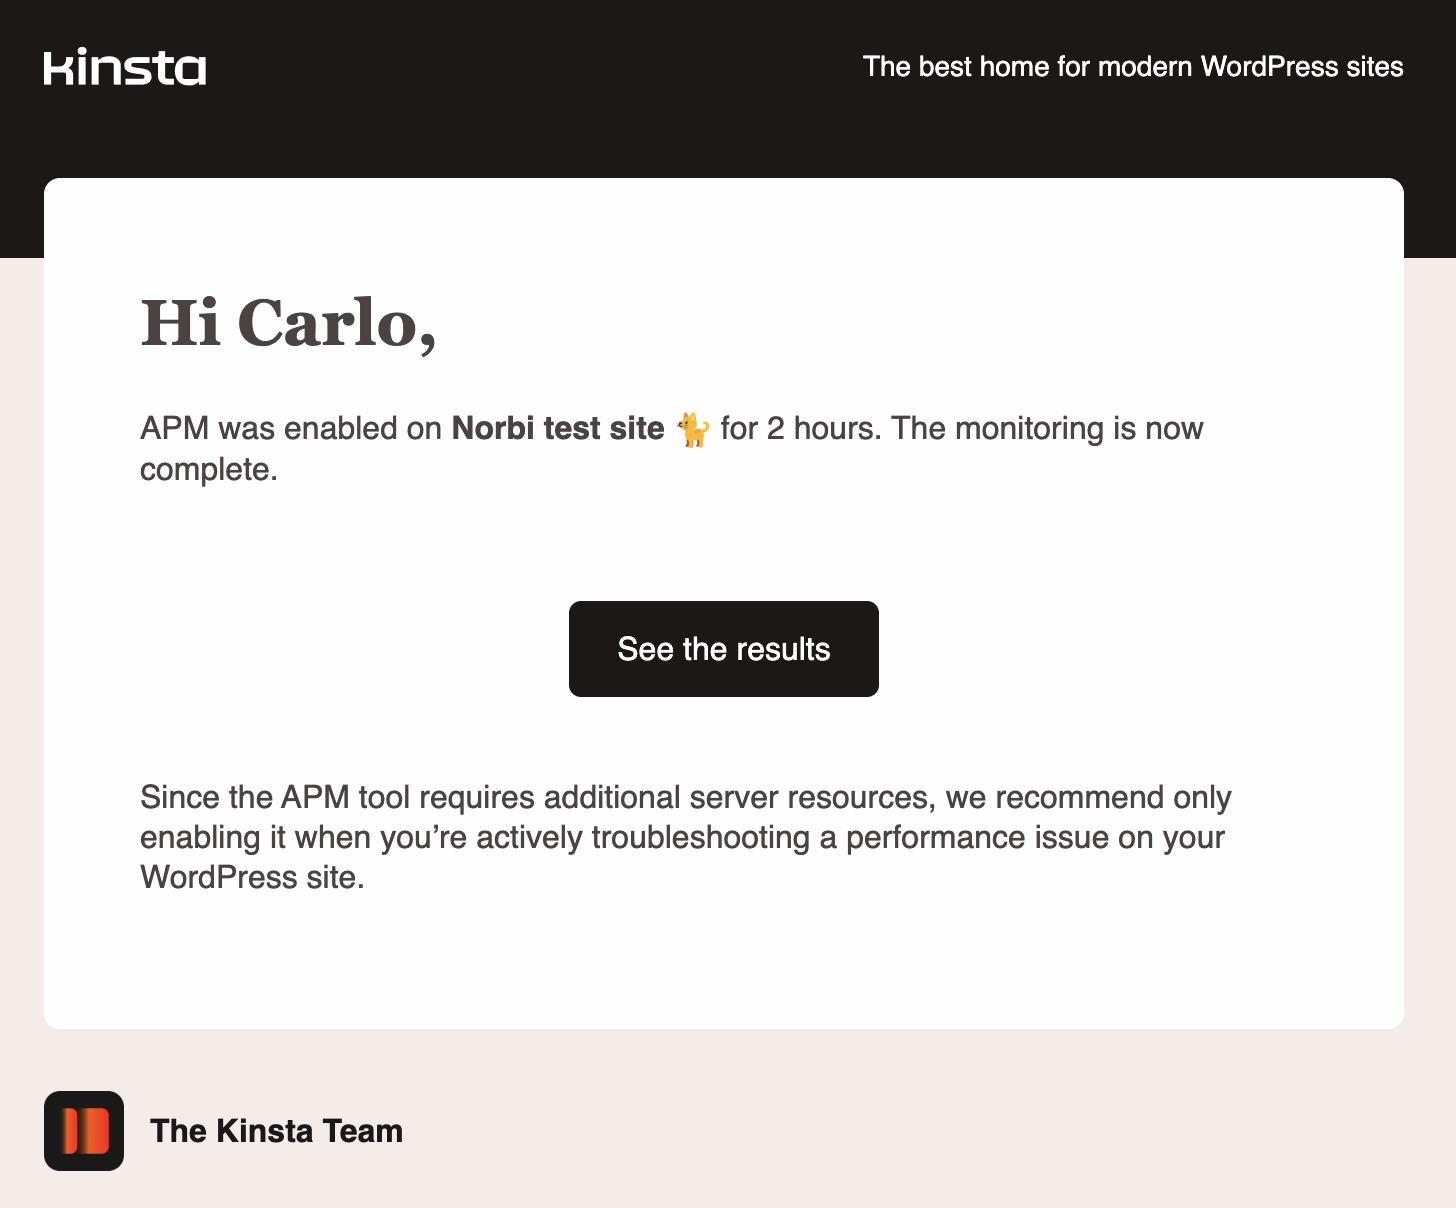
If these initial attempts do not resolve the issue, proceed to the next step: check the Kinsta APM tool and the Log viewer in your MyKinsta dashboard.
Kinsta APM can help you identify which plugin, query, or script might be exhausting your site’s PHP memory limit or generating other conflicts. To begin monitoring, go to Sites > APM and click Enable API. Then, set a monitoring time and wait for the tool to record the site’s activity. For more information on Kinsta APM, please refer to the online documentation.
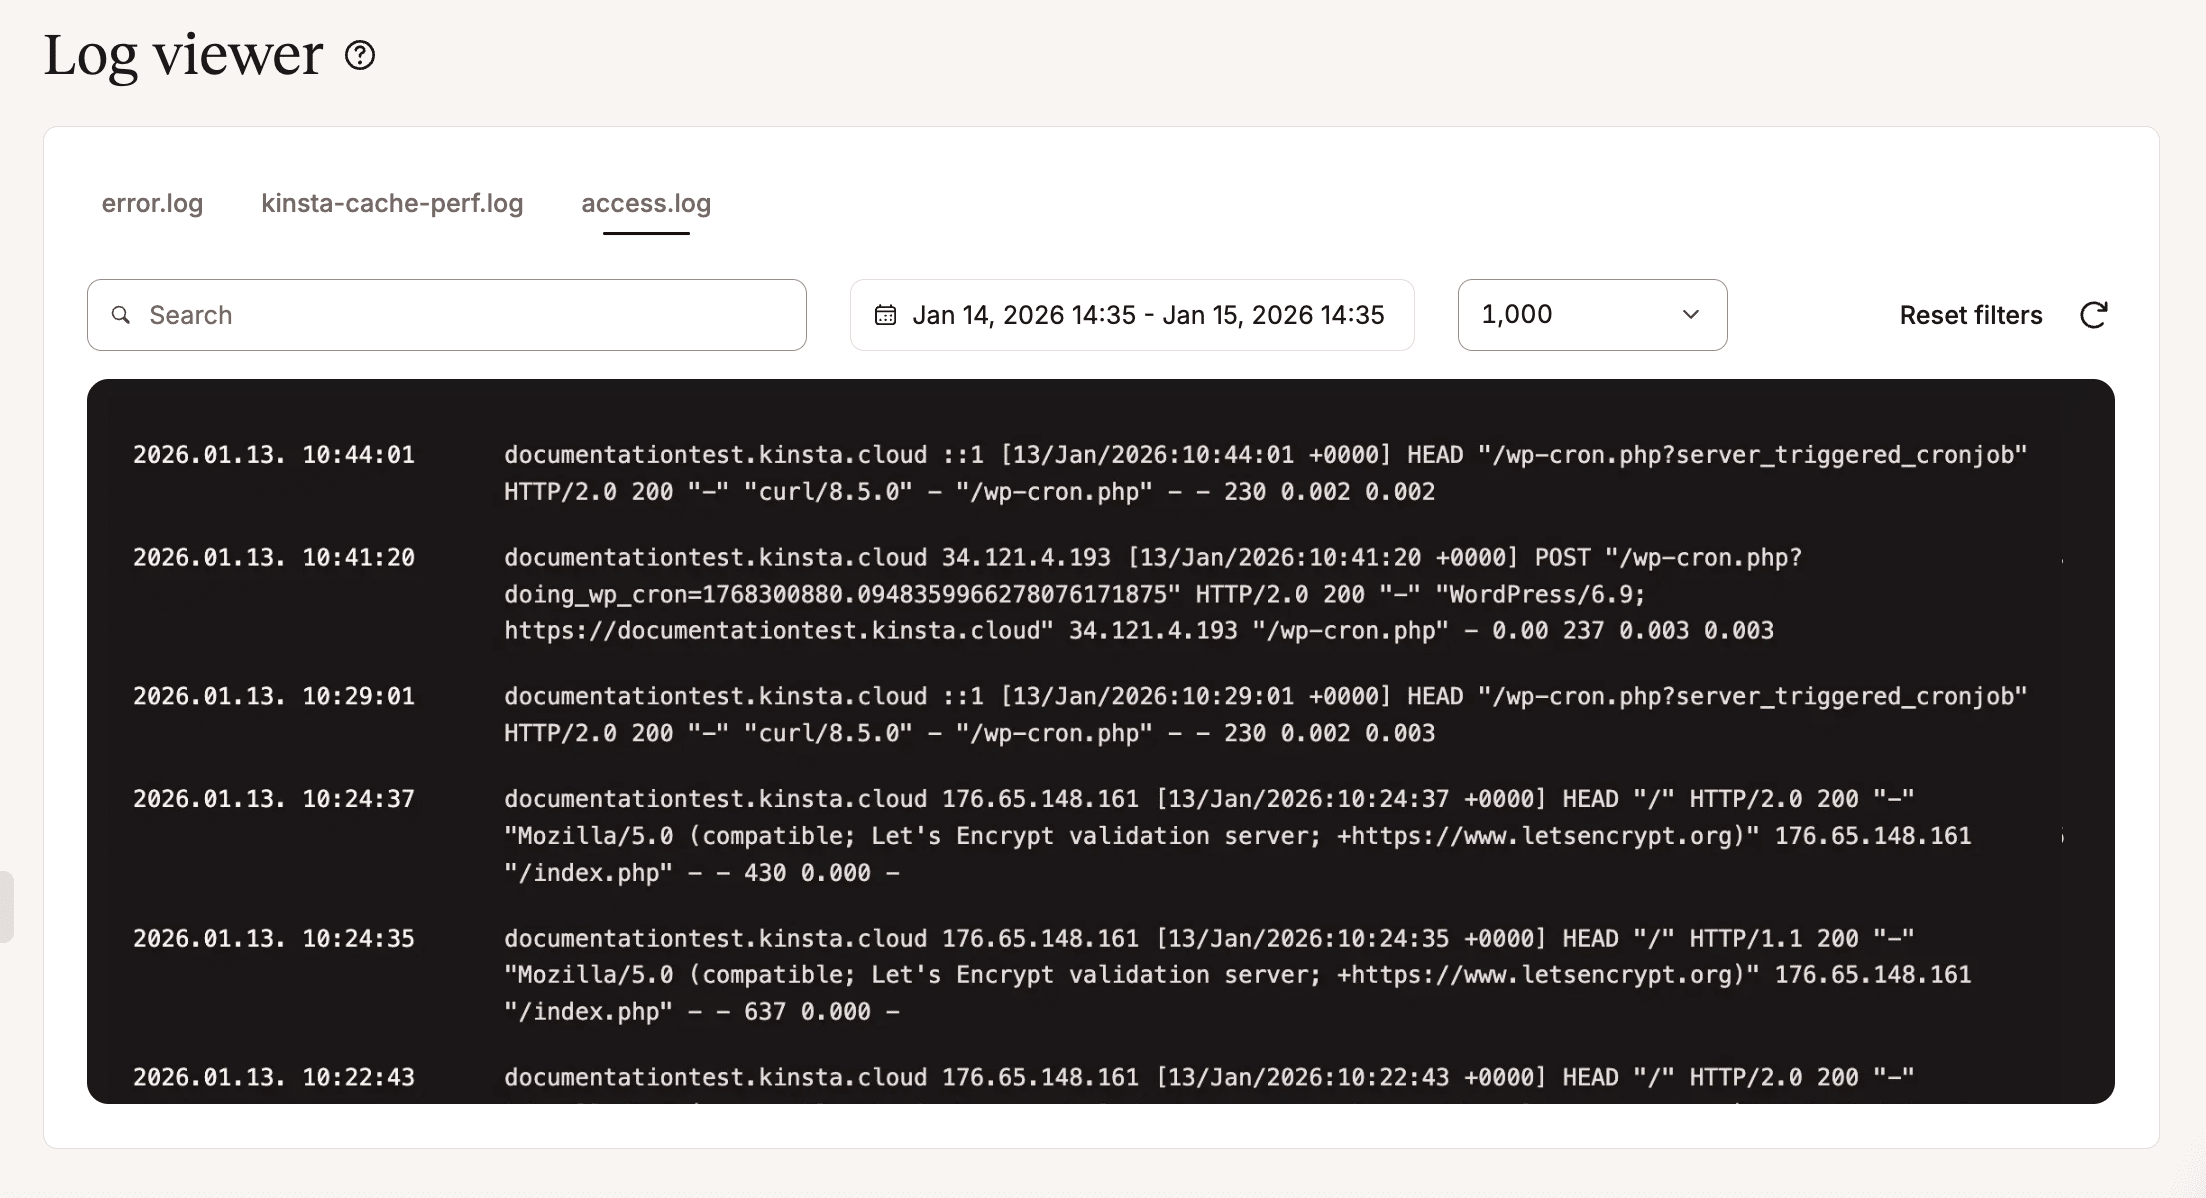
Another place to look for the cause of a problem is the server log. You’ll find the log under Sites > sitename > Logs. Three tabs provide the error.log, kinsta-cache-perf.log, and access.log files.
These files can help you identify the type of error that caused your site to block. Examples of these errors include PHP syntax errors, missing files, script timeouts, conflicting plugins, caching errors, and the IP addresses from which requests to your site originate.
If you have tried everything and exhausted all available options, you can always open a chat with our support team. Our expert engineers will be happy to help you troubleshoot and fix the problem.
If you received a DNS Errors notification, it means that our servers can no longer resolve your domain name. There can be several causes of this error. It could be a client-side error, such as a problem with your network or internet connection. It could also be a problem with misconfigured DNS settings, meaning your site’s DNS is not pointing to Kinsta correctly.
First, check the status of your domain registrar. Log in to your DNS registrar dashboard (Cloudflare, GoDaddy, Namecheap, Bluehost, etc.) and confirm that the A record is pointing to the correct IP address for your site, which you can find in the MyKinsta dashboard under Sites > Info.
Our documentation helps you to correctly point your domains to Kinsta, update your DNS settings, and update your name servers.
Lastly, if you receive an SSL error notification, it means that your SSL certificate has expired. Without a valid certificate, browsers will block access to your site and display a security warning. In MyKinsta, navigate to Sites > sitename > Domains and verify that the domain is correctly pointing to Kinsta’s IP address (automatic renewal will fail if the DNS is not configured correctly). If you are using a custom certificate, confirm that it has not expired and re-upload it.
Kinsta Automatic Updates
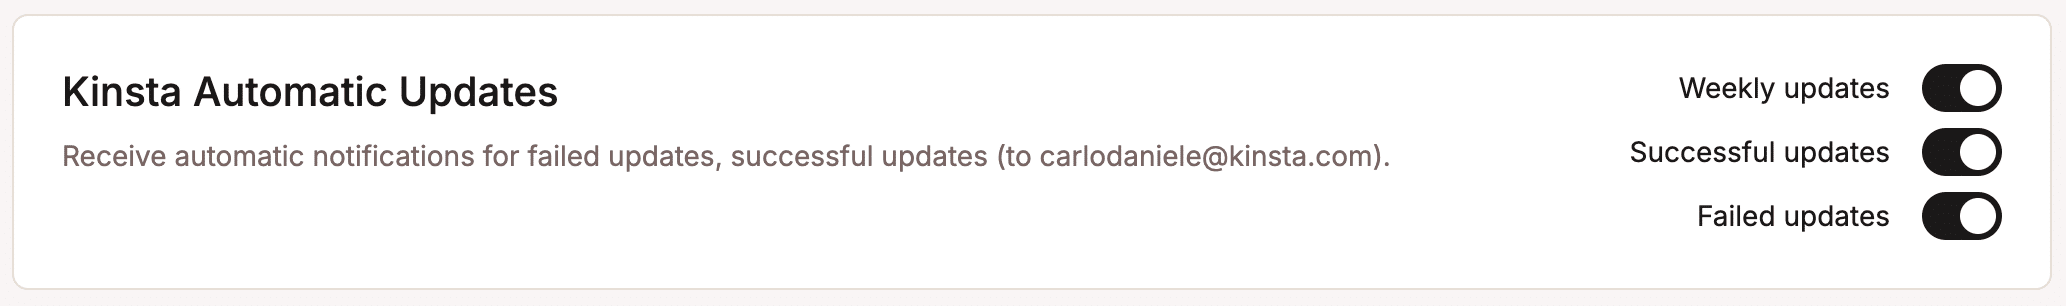
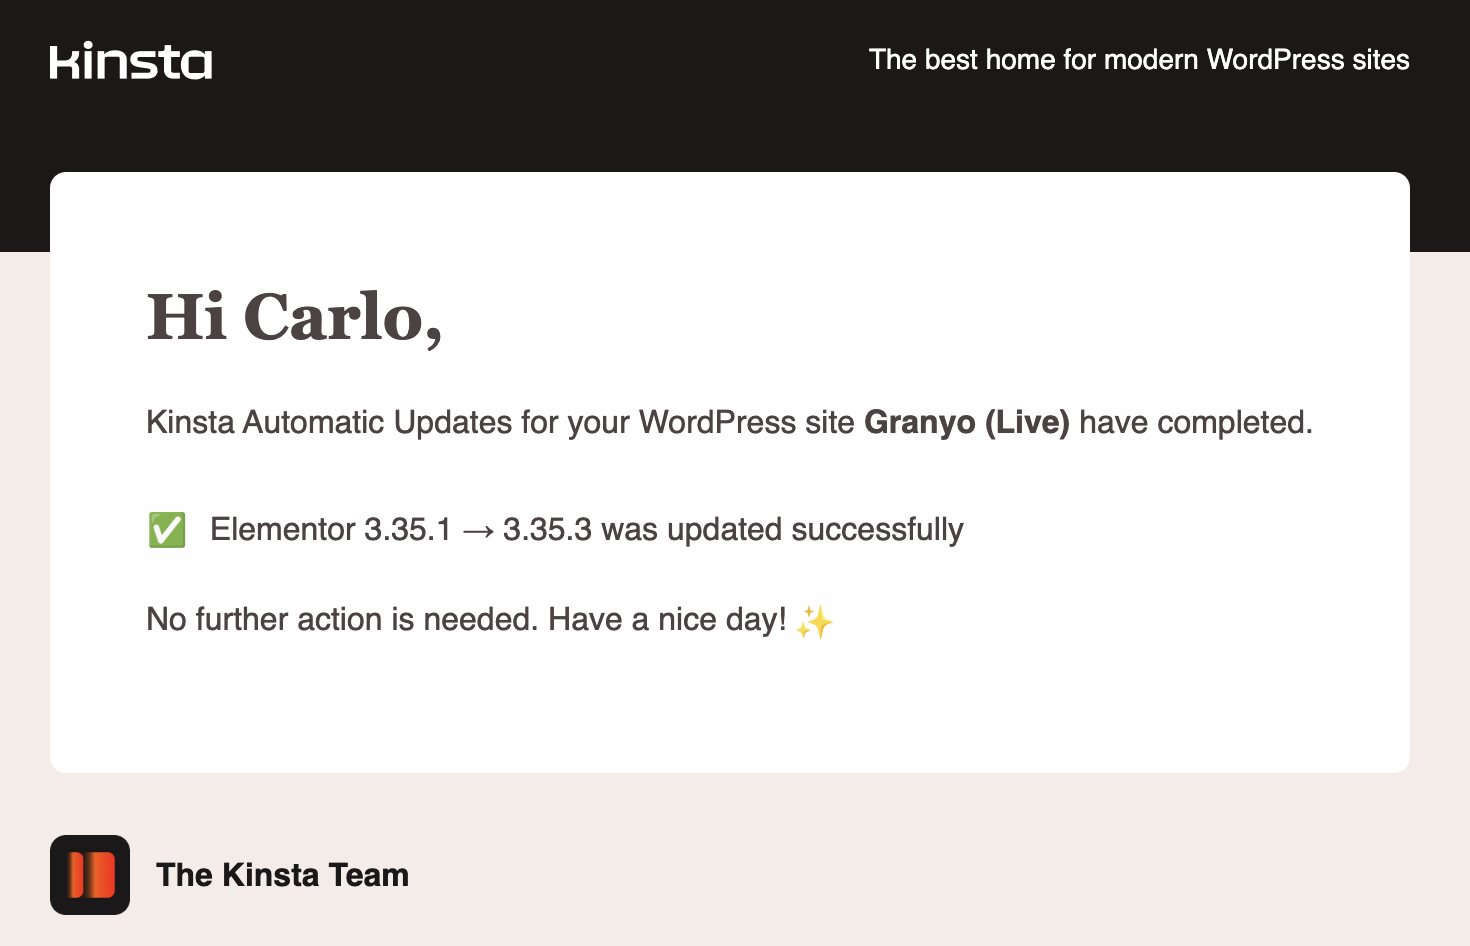
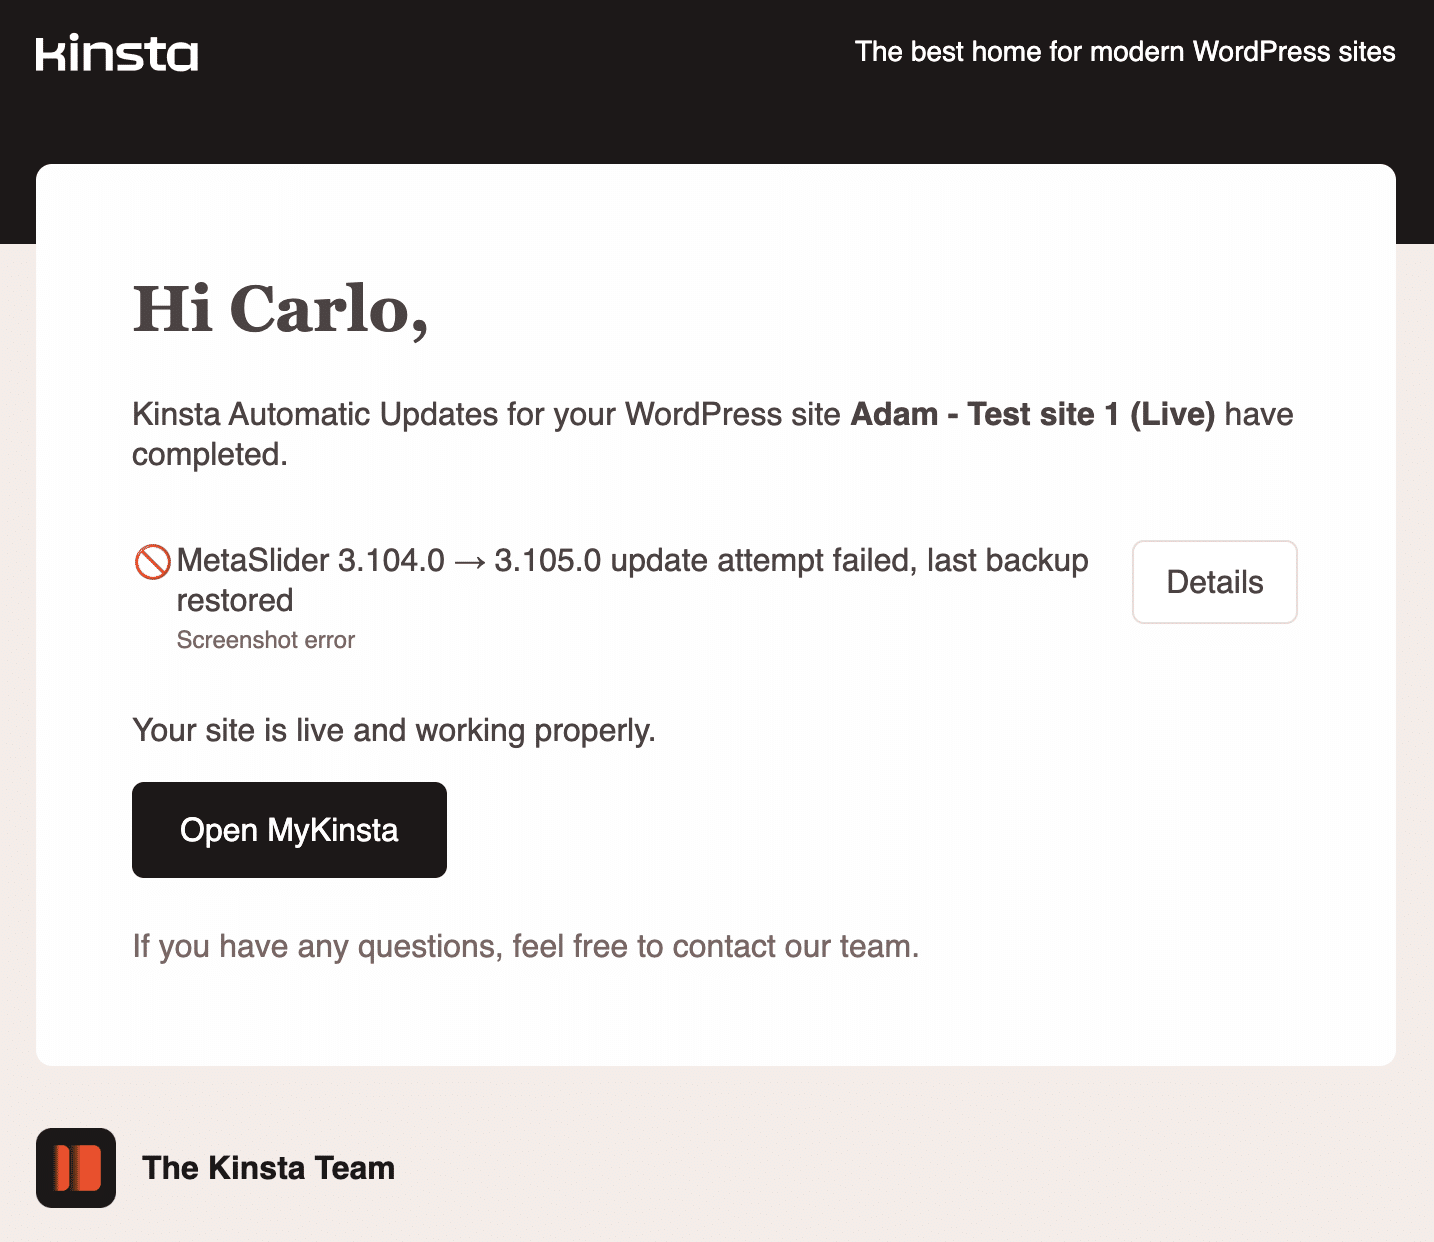
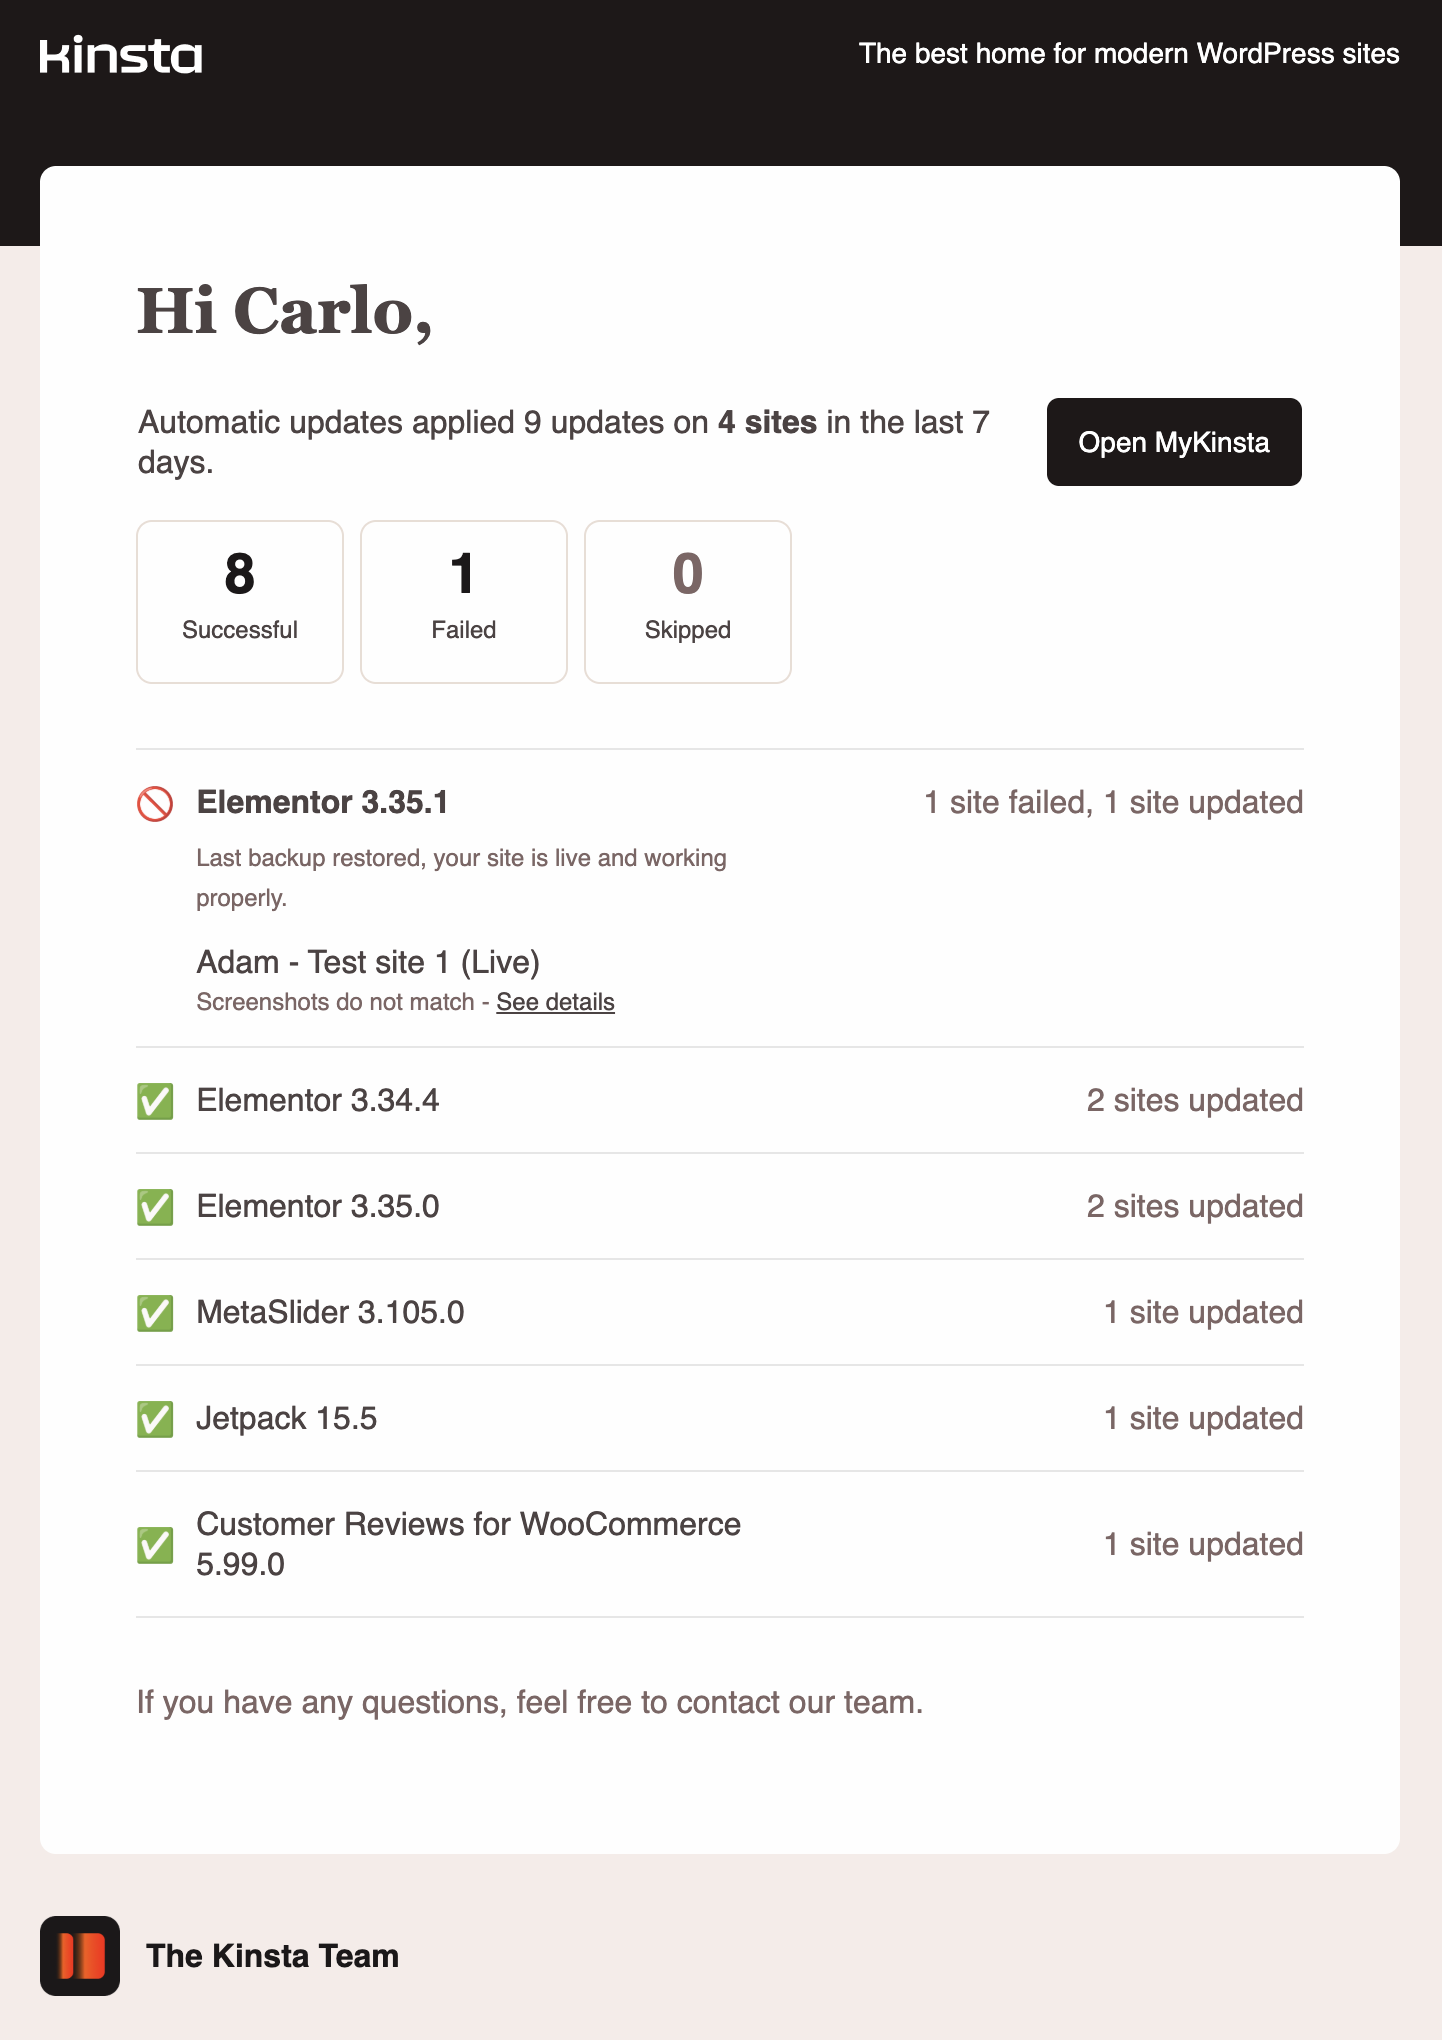
If you purchased the Kinsta Automatic Updates add-on, enabling Kinsta Automatic Updates notifications will send you automatic emails and dashboard notifications for weekly updates, successful updates, and failed updates.
Kinsta Automatic Updates are performed on the server side and are designed to ensure your site does not go down due to update issues. This is because the software performs a visual regression test on your site before and after the update. If the test fails, Kinsta rolls back the changes and notifies you.
The following images show email notifications for weekly updates, successful updates, and failed updates.
Vulnerability notifications and monthly vulnerability digest
Our systems perform continuous security checks across our entire infrastructure to detect malware and other vulnerabilities.
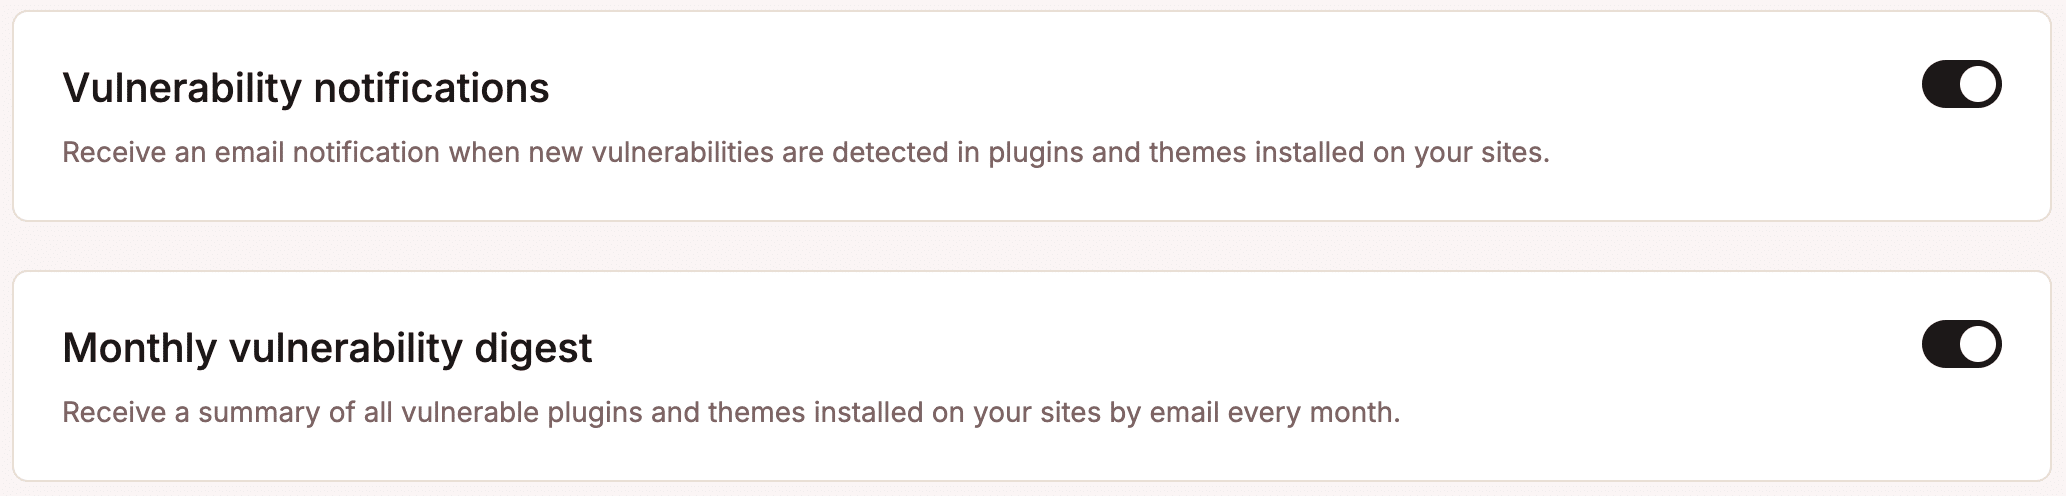
By enabling Vulnerability notifications, Company owners, Company/Site administrators, and Company/Site developers will receive an email notification every time a high-severity vulnerability (severity score of 7 or higher) is detected in your plugins or themes, also including details on how to address the plugin/theme issue promptly.
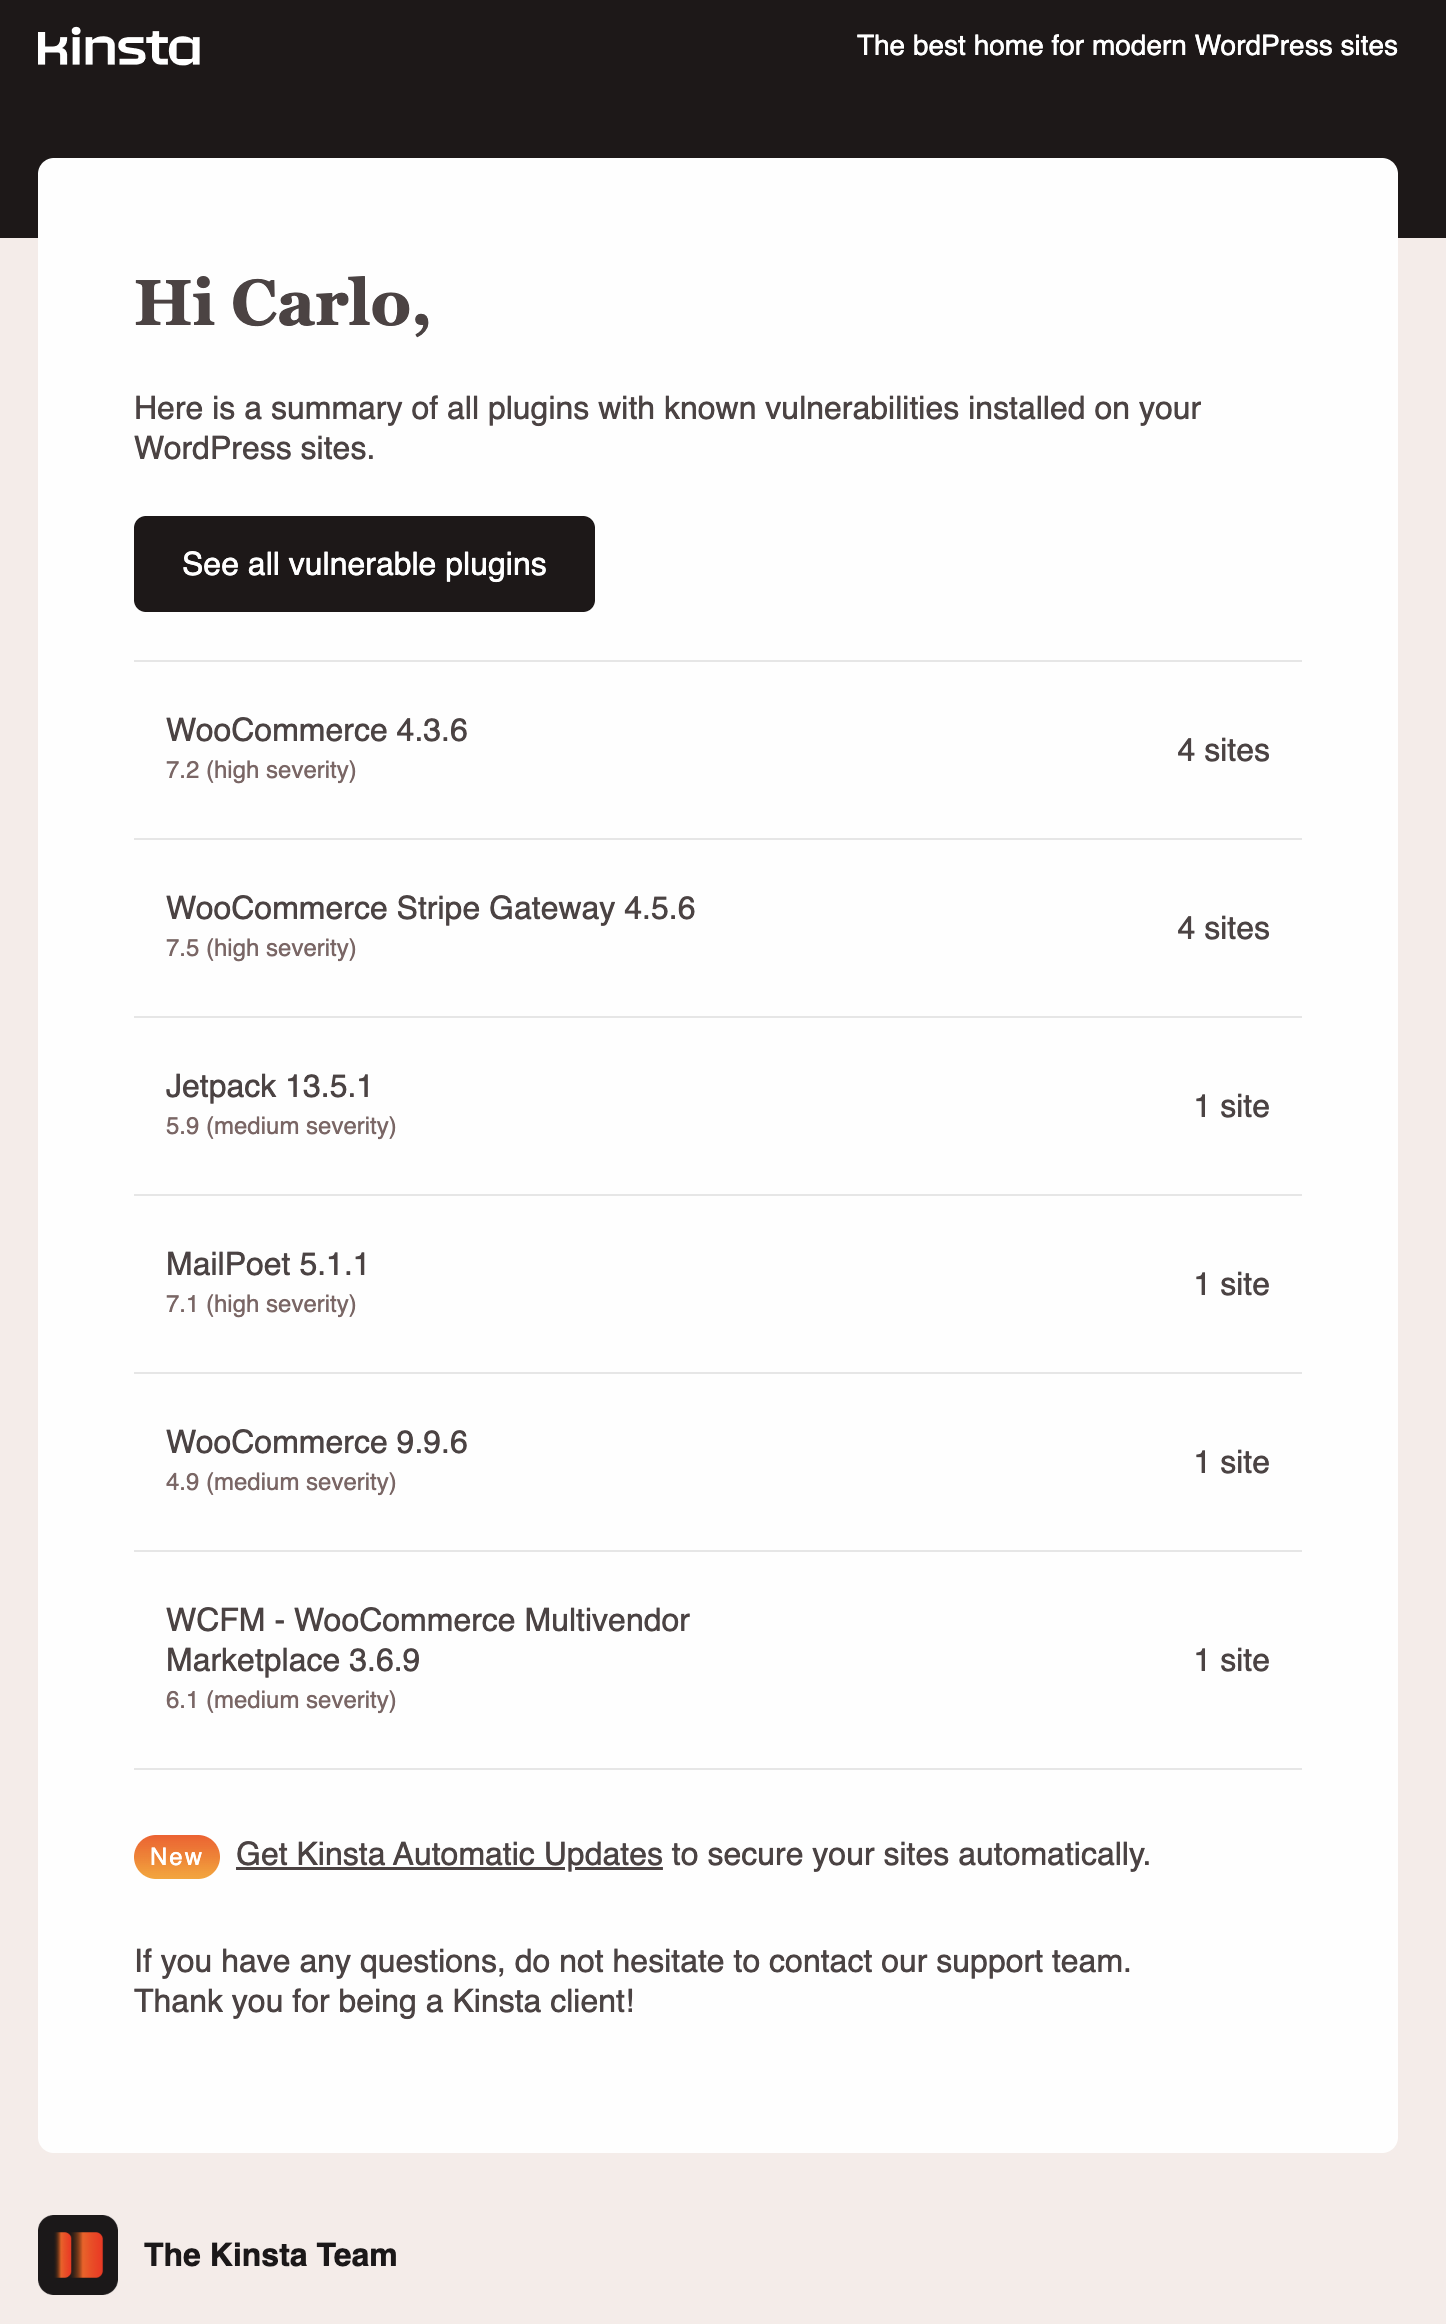
Vulnerability notifications only concern high-risk vulnerabilities. Opting in to the Monthly vulnerability digest will provide you with a monthly report of all vulnerabilities in your plugins and themes.
The Notifications configuration page includes additional options for enabling invoices in email and subscribing to our newsletters, research invitations, and Automatic monitoring alerts.
Although MyKinsta includes a comprehensive notification system, developers and agencies often need more granular control over notifications. Furthermore, these teams often need to automate workflows and integrate tools and hosting services with their internal collaboration and communication platforms, such as Slack, Trello, their CRM, or their custom dashboard.
This is where the Kinsta API can significantly impact your team’s workflow.
Taking notifications to the next level with the Kinsta API
The Kinsta API is a powerful REST API that lets you retrieve data from your Kinsta-hosted websites and perform operations on environments and sites.
The Kinsta API enables growth-oriented agencies to create smart, fully automated monitoring and notification systems. Below are some ways to improve your site management and monitoring workflows:
- You can go beyond the default MyKinsta notification settings. If you have enabled resource consumption notifications in MyKinsta, you will receive notifications at 80% and 100% of your resource limits. With the Kinsta API, you could add more checks or monitor resource consumption at specific time intervals.
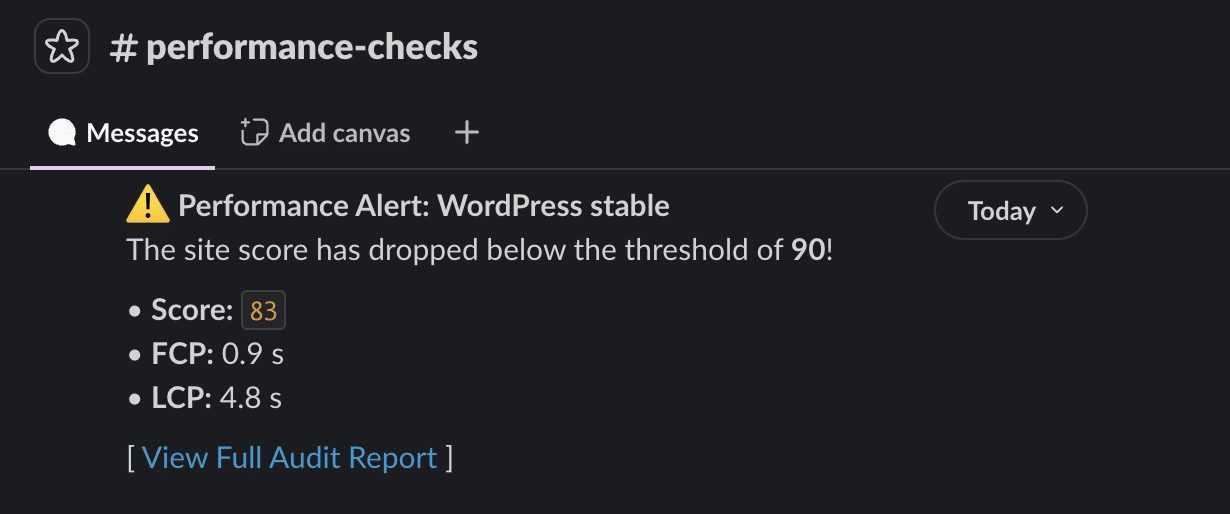
- You can configure your script to send notifications on your preferred messaging or communication platforms, including Slack, Telegram, SMS, or a custom dashboard.
- You could push notifications a step further by integrating your Kinsta hosting with third-party applications and custom environments. As an example of this, in a previous article, we explained how to create a PHP script that uses the Kinsta API to retrieve the URLs of your Kinsta-hosted sites, sends them to the PageSpeed Insights API, receives a set of Core Web Vitals metrics, and sends a message to a Slack channel if the metrics fall below a specified threshold.
With the Kinsta API, you can access the heart of your website to perform operations such as:
- Monitoring background tasks such as backups, cache clearing, or environment operations.
- Retrieve analytics data, including resource usage, PHP requests, bandwidth consumption, and more.
- Check site and environment status.
- Programmatically toggle tools such as the PHP engine or launch a manual backup.
How to build your custom notification engine: A practical workflow
Creating a customized notification system is a 4-step process.
1. Set up the trigger
Since the Kinsta API uses REST requests instead of push events, you need to set up a trigger to query the API at regular intervals. To do this, you can set up a cron job on your WordPress site, or use GitHub Actions or automation tools such as Make.com or Zapier.
2. Retrieve data with the Kinsta API
The Kinsta API provides a considerable set of endpoints for implementing an automated notification system. Below are some endpoints and their respective use cases.
The /analytics endpoint allows you to monitor resource consumption.
/analytics/cdn-bandwidthand/analytics/bandwidthprovide data on CDN and server bandwidth consumption. Strategically monitoring these endpoints lets you identify traffic anomalies without accessing MyKinsta. A sudden spike in bandwidth consumption may indicate a hotlinking attack or an attempt to exhaust your resources via bots. You could use these endpoints to create an alert that notifies you in real time on Slack or Telegram when there is abnormal bandwidth consumption requiring your attention.- The
/analytics/visitsendpoint allows you to detect unexpected traffic spikes. To prevent DDoS or brute-force attacks, you can create a script that sends you a Slack notification prompting you to check the logs. Even better, you could create a script that automatically blocks the malicious IP address from which the requests originate. You can also use this endpoint to observe and report on the effects of your promotional campaigns in real time, eliminating the need for manually monitoring your site’s analytics. - The
/analytics/diskspaceendpoint allows you to monitor disk space usage. This endpoint is particularly useful for monitoring how quickly disk space is filling up, such as when you have a team of content creators who can upload images and multimedia files, or when you allow your site’s visitors to upload images or files.
The /logs endpoint allows you to access your site’s raw data programmatically, providing valuable insights into various aspects of your site’s activity.
- You can use it to detect critical PHP errors in real time by filtering the error log for strings such as “PHP Fatal Error” or “Parse Error,” and sending an immediate notification to Slack or another messaging tool.
- You can also use the
/logsendpoint to detect DDoS and login attacks. If you identify suspicious traffic patterns, you can automatically notify your developers to investigate immediately and/or automatically block the IP address from which the abnormal requests originate. - Accessing server logs with the Kinsta API allows you to monitor 404 errors and set up automatic notifications for your IT team. This helps prevent SEO issues, check for errors after plugin or theme updates, identify slow scripts or plugins that generate excessive external calls, slow down TTFB, and much more.
With the Kinsta API, you can retrieve data related to your sites, environments, and domains.
You can also retrieve data related to plugins and themes, company users and activity logs, blocked IPs, backups, and much more.
3. Defining your script logic
The next step is to define the logic of your script. At this stage, you will use the data to generate meaningful notifications. Your script must check for abnormal behavior and determine whether it could compromise the site’s operation or security.
There are three main approaches to this phase:
Threshold-based logic: The simplest approach involves setting thresholds that, when reached, automatically generate a notification. For example, you could set a series of thresholds for resource consumption. Thresholds can also be set in relation to a time interval. For instance, you could set a threshold for daily server bandwidth consumption and generate a notification when it exceeds 10 GB. Below is an example of a request that provides server bandwidth consumption for the last 24 hours:
curl -i -X GET \
  'https://api.kinsta.com/v2/sites/environments/{env_id}/analytics/bandwidth?company_id={company_id}&time_span=24_hours' \
  -H 'Authorization: Bearer <YOUR_TOKEN_HERE>'
And here is the API response:
{
	"analytics": {
		"analytics_response": {
			"key": "bandwidth",
			"data": [
				{
					"name": "bandwidth",
					"total": 0,
					"dataset": [
						{
							"key": "2026-02-09T16:00:00.000Z",
							"value": "0"
						},
						{ ... },
						{ ... },
						{
							"key": "2026-02-10T15:00:00.000Z",
							"value": "0"
						}
					]
				}
			]
		}
	}
}
Relative or percentage change: Sometimes, an absolute number does not provide the necessary information, and analyzing relative or percentage changes may be more useful.
For instance, a sudden increase in 404 errors may indicate that a bot is scanning your site for sensitive files, such as .env or wp-config.php. However, the absolute number of 404 errors is not helpful. Using the /logs endpoint, you can retrieve the latest lines of the error log to analyze the frequency of errors and determine which files are being requested and from which IP addresses.
Below is an example of a request that provides the latest 1,000 lines of access logs:
curl -i -X GET \
  'https://api.kinsta.com/v2/sites/environments/{env_id}/logs?file_name=access&lines=1000' \
  -H 'Authorization: Bearer <YOUR_TOKEN_HERE>'
If you want to dive deeper, we have a tutorial on how to retrieve server logs with the Kinsta API.
Sequential Failure Logic (SFL): The distinction between a professional system and a basic notification system is determined by the system’s ability to filter out noise and avoid false positives. For example, if the system sent a notification for every slow or unsuccessful API request, you would receive useless notifications and might ignore or miss important ones. A better approach is to instruct your script to notify you only if an error occurs after 3 consecutive checks.
Kinsta only sends monitoring notifications when our systems detect an error across 3 consecutive checks.
4. Connect to external tools
After confirming an anomaly requiring your attention, the next step is to distribute the information via your preferred communication or collaboration tools. Thanks to Kinsta’s RESTful API, you have maximum flexibility in choosing tools to integrate with your scripts.
Below are some examples of integrations:
- Instant communication: Slack or Microsoft Teams webhooks allow you to send notifications to specific channels.
- Critical notifications: When messaging systems aren’t enough, tools like Twilio or Telegram allow you to send messages directly to your team members’ smartphones.
- Push notifications: You can use Pushover or Pushbullet to send push notifications to mobile devices.
- Task management: If your team uses Jira, Trello, or Asana daily, your script can automatically generate and assign a card or ticket to your developers.
Integration and automation: The blueprint for forward-thinking agencies
For a forward-thinking agency, using Kinsta’s API to monitor your server environment and send automatic notifications is a strategic step. In today’s digital landscape, it’s not enough to simply be alerted when a site is down or underperforming. You need to build an intelligent infrastructure that drastically reduces Mean Time to Repair (MTTR) to ensure proactivity, scalability, and quality of service.
Kinsta provides more than just outstanding managed cloud hosting. Thanks to its open architecture, advanced management tools, and robust REST API, Kinsta allows you to integrate your hosting with the tools you use every day. This transforms maintenance from an operating cost into a smooth, automated process.
With this approach, you can stop reacting to emergencies and start orchestrating your customers’ success with the precision of an orchestra conductor. You can be confident that every component of your technology stack works together in perfect harmony.
Are you interested in learning more about Kinsta? Browse our plans, or reach out to our sales team.

Carlo is a passionate lover of webdesign and front-end development. He has been playing with WordPress for more than 20 years, also in collaboration with Italian and European universities and educational institutions. He has written hundreds of articles and guides about WordPress, published both on Italian and international websites, as well as on printed magazines. You can find him on LinkedIn.

