
Everyone loves visiting a fast website! Having a fast site also helps boost your search engine rankings, crawlability, conversion rates, and time spent on the page. Furthermore, it also decreases your bounce rate.
At Kinsta, we’re obsessed with speed! Unsurprisingly, many website owners and web agencies upgrade their websites by migrating to Kinsta.
We continue to receive thousands of real reviews from developers, agencies, and site owners — that ongoing feedback is what’s made Kinsta one of the top-rated WordPress hosts year after year.
If you’re still on the fence, you might wonder whether there are significant improvements in website speed after migrating to Kinsta. With this extensive migration data project, we set out to test exactly that.
This project covers 32,000+ data points from 3,200+ websites we migrated to Kinsta from more than 23 hosts — we did the tests over three months.
We ran a website speed test for each domain migrated — before and after migrating. And then we got down to crunching the numbers. This post will cover all the test methodology and results in detail.
Excited? Let’s start!
The Website Speed Testing Methodology
Before we get started with the results, we must note down our website speed testing methodology. We’ll detail it below:
The Site Speed Testing Platform
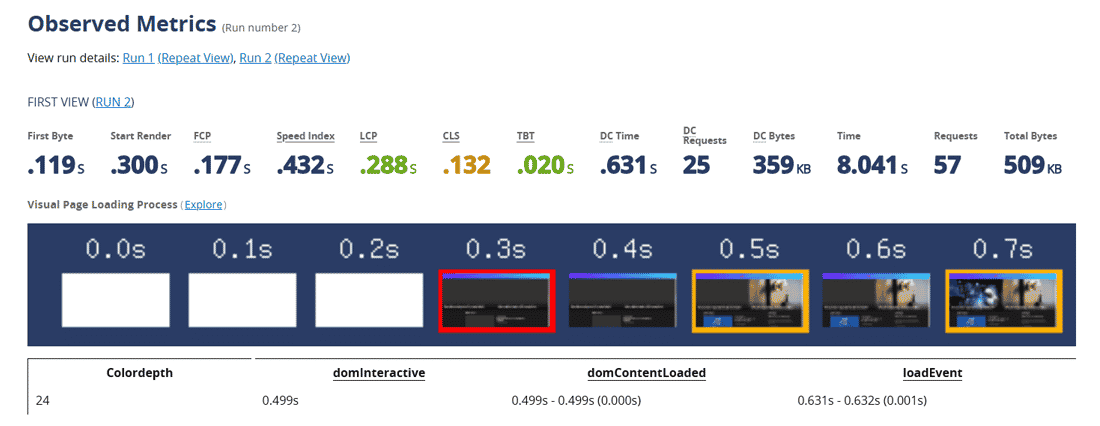
For our tests, we used WebPageTest, an open-source project that allows us to run a free website test from multiple global locations using real browsers.
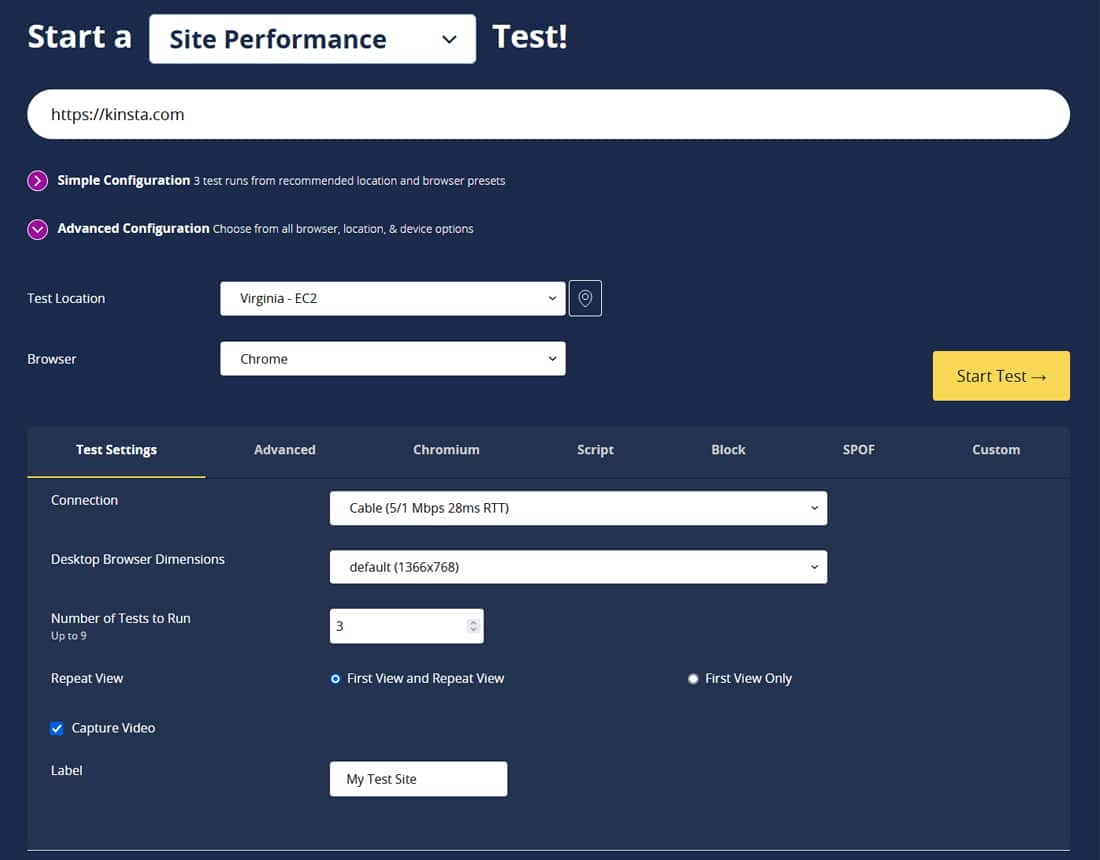
Though WebPageTest is as simple to use as any other website speed testing tool, its features for advanced users are top-notch, allowing you to capture many in-depth metrics and compare them across multiple tests.
For instance, you can set the number of tests in the Test Settings. Enabling this option repeats the tests from scratch with the same parameters.
The default number of tests WebPageTest performs is three, but you can set it up to nine for intense repeated tests. We set this number to three to arrive at reliable results and let WebPageTest choose the median result.
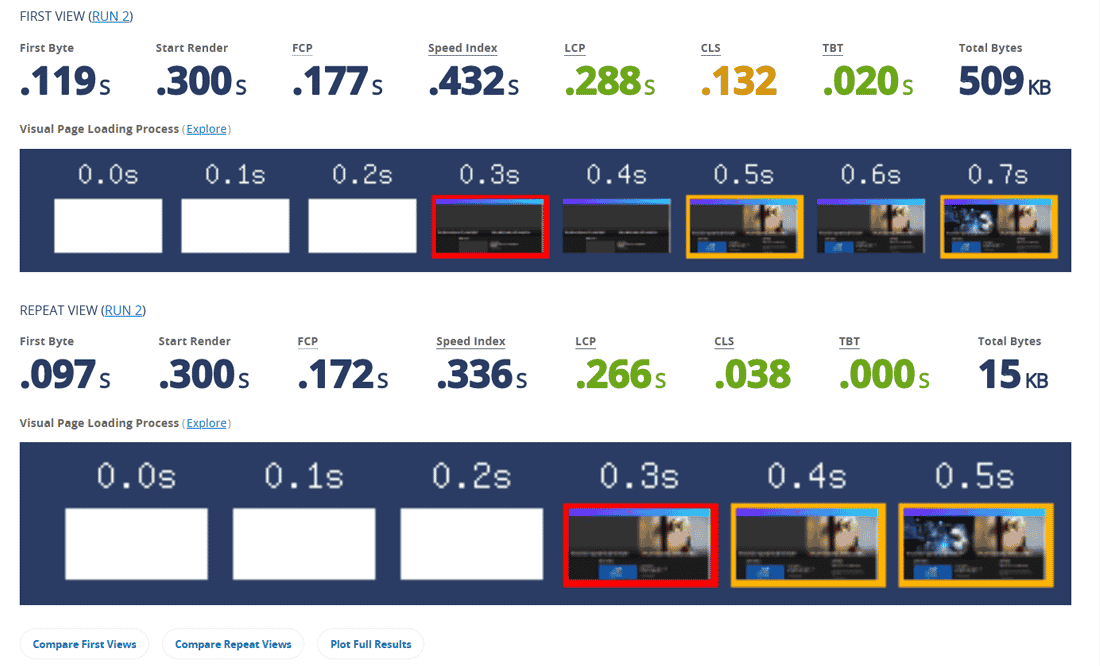
WebPageTest also allows you to log First View and Repeat View metrics separately. If you enable the Repeat View option, each test loads the page with no browser cache (First View) and then loads it again with the stored cache (Repeat View).
A speed test’s First View and Repeat View metrics give you a better perspective of how the page loads for new and returning users.
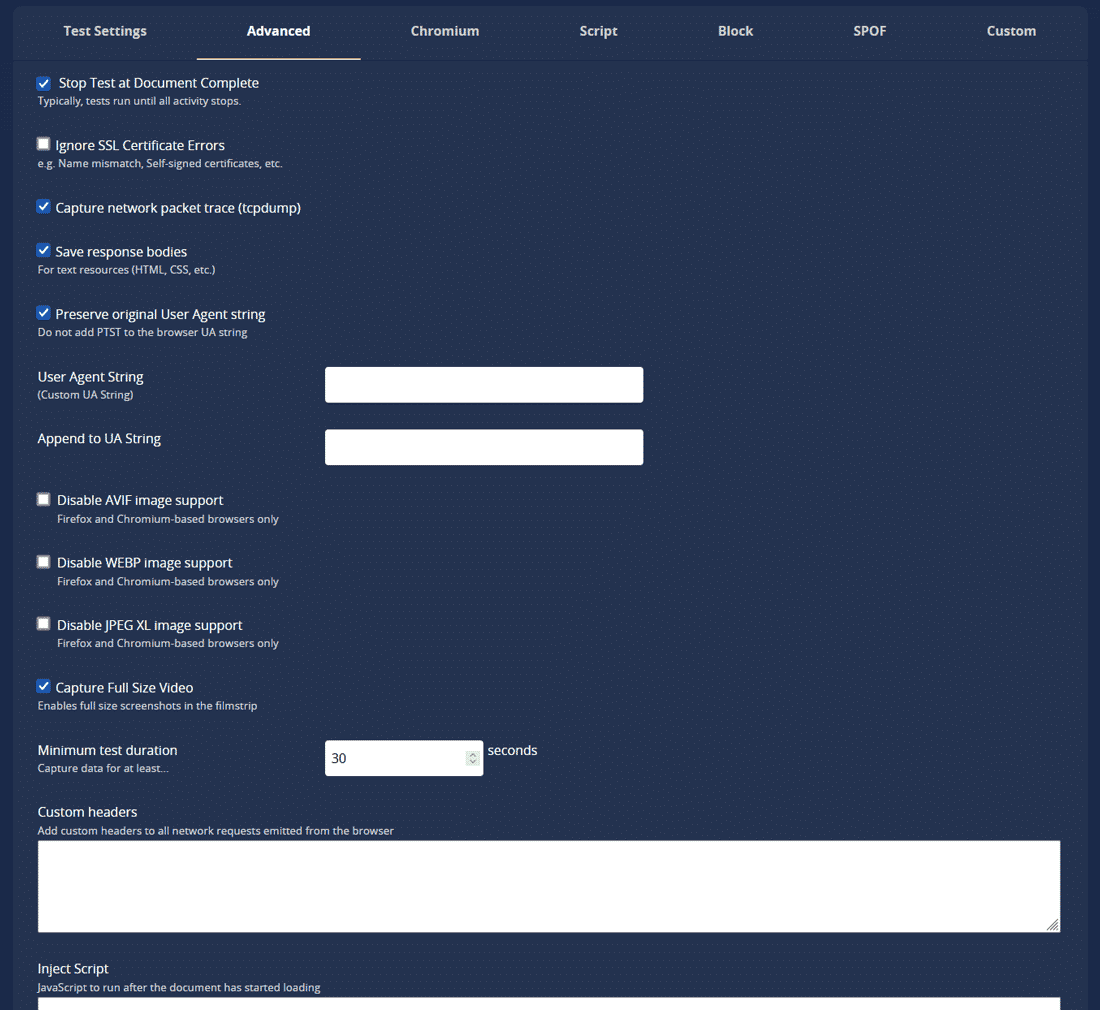
Finally, WebPageTest provides API access for automating tests, and a built-in tests comparison tool. Both these features are just perfect for our use case.
How We Ran the Tests
Once we’ve set a standard testing procedure — location, browser, connection, number of tests, Repeat View — running the tests is a breeze with WebPageTest’s automation tools.
All we need now are actual websites to migrate and test.
Thankfully, we have a constant influx of clients migrating to Kinsta from varied hosting providers — from cheap shared hosting plans to expensive self-managed cloud servers.
Our top-notch migrations team worked closely with the website speed testing team to get the results without hiccups.
We performed one test just before migrating the site, and the next test immediately after finishing the migration. As detailed before, we set the number of tests to 3 to arrive at reliable metrics by letting WebPageTest choose the median result.
All in all, we migrated and tested 3,200+ websites over three months. That’s 2+ migrations completed each hour of every workday!
The Relevant Speed Test Metrics
WebPageTest logs multiple metrics for each test. For comparing a migrating website’s relative performance, we considered these four metrics the most relevant:
1. Time to First Byte (TTFB)
This metric measures the time between the initial request and the first byte of the response. TTFB precedes all the other metrics and is primarily dictated by the server’s response time.
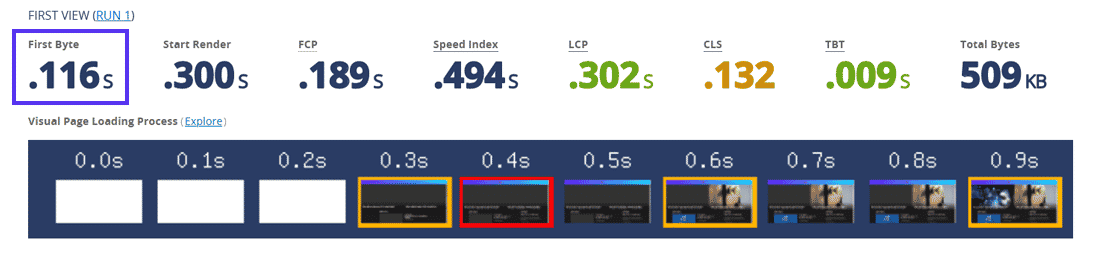
Minimizing TTFB starts by choosing a fast hosting provider with high uptime and responsiveness. Combining it with a CDN can also improve it further.
2. Largest Contentful Paint (LCP)
This metric measures the time to load the largest image or block of text in the browser viewport (above the fold). Usually, these items will be a hero image, banner, heading, or large text block.
A lower LCP score indicates a better user experience. As such, it’s also one of Google’s Core Web Vitals metrics. Any page with a good LCP score can rank higher in search results. If these pages fit the proper criteria, they can also be featured in Google’s other services (e.g. Google News).
When comparing test results, we recommend you give maximum weightage to the LCP metric.
3. Total Blocking Time (TBT)
We cannot track a page’s First Input Delay (FID) — another Core Web Vitals metric — through lab-measurable speed testing tools like WebPageTest. That’s because FID can only be evaluated in the field — measuring it requires a real user interacting with the page.
However, we can measure a page’s TBT through speed testing tools like WebPageTest. As per Google, TBT correlates well with FID in the field. It also captures interactivity issues.
Improving TBT mainly involves optimizing the website code — third-party code, JavaScript execution time, main thread work, number of HTTP requests, and transfer sizes. These tasks are development-oriented and don’t come under the scope of a hosting provider’s primary services.
Typically, page speed optimizations to improve TBT should also improve FID for your users.
4. Fully Loaded Time (FLT)
This metric measures the time to load all the page’s assets — text, images, videos, CSS stylesheets, JS scripts, third-party resources, embeds, etc.
We’re better off with just the LCP metric from a user-experience standpoint. However, as the migrated website remains virtually identical between the tests, measuring FLT greatly indicates how well the new hosting server performs compared to the old one.
You should note that a server is not just its hardware. It also includes various optimizations — server-level caching, platform-specific optimizations, database optimizations, built-in security features, CDN integration, etc.
Comparing the Test Results
Our goal for this project was to see how Kinsta compares to other hosting providers — it serves as a data-backed comparison piece for our potential, new, and old clients.
We also wanted to understand how much of a difference we’re making — positive or negative. If the difference we’re making is positive, it’s great. We’ll know where we can improve further if it’s negative.
Some of the hosts we migrated sites from had only a handful of domains participating — a few even had just one domain migrated. These hosts didn’t have many data points to derive reliable metrics. Hence, we excluded any host with fewer than ten domains analyzed — that’s more than a dozen hosting providers. We may consider adding these hosts in the future as more sites migrate to Kinsta from them.
Let’s move on to the test results now.
Kinsta vs Alternatives: The Test Results
How does Kinsta stack up against the competition? It’s time to find out.
Unless mentioned otherwise, all the metrics are listed in seconds (sec). As these metrics measure website speed and interactivity, slower times are better. Hence, you’ll see a negative symbol preceding the difference amount (Δ) if there’s any improvement.
Here’s what the columns mean:
- Original = Pre-migration test results
- Kinsta = Post-migration test results
- Δ = Difference between the Original and Kinsta metrics
- %Δ = Percentage difference between the Original and Kinsta metrics
We’ll highlight post-migration metric improvements in Kinsta purple color to make it easy for you to spot the differences.
You’ll notice that most metrics are painted purple. In short, you’ll benefit significantly from migrating your site to Kinsta.
Kinsta vs BlueHost
| Kinsta vs Bluehost | ||||||||
| Metric | First View | Repeat View | ||||||
| Original | Kinsta | Δ | %Δ | Original | Kinsta | Δ | %Δ | |
| TTFB (sec) | 2.75 | 0.55 | -2.19 | -79.82% | 1.24 | 0.34 | -0.90 | -72.88% |
| LCP (sec) | 4.17 | 2.20 | -1.97 | -47.20% | 1.88 | 1.15 | -0.73 | -38.68% |
| TBT (sec) | 0.18 | 0.29 | 0.11 | 60.66% | 0.11 | 0.13 | 0.02 | 22.48% |
| FLT (sec) | 6.15 | 3.22 | -2.93 | -47.67% | 3.47 | 1.27 | -2.20 | -63.40% |
Kinsta vs Dreamhost
| Kinsta vs DreamHost | ||||||||
| Metric | First View | Repeat View | ||||||
| Original | Kinsta | Δ | %Δ | Original | Kinsta | Δ | %Δ | |
| TTFB (sec) | 0.92 | 0.73 | -0.18 | -19.94% | 0.30 | 0.30 | -0.01 | -2.21% |
| LCP (sec) | 2.52 | 2.35 | -0.17 | -6.57% | 1.43 | 1.28 | -0.16 | -11.01% |
| TBT (sec) | 0.29 | 0.15 | -0.14 | -48.82% | 0.20 | 0.07 | -0.13 | -65.60% |
| FLT (sec) | 6.65 | 4.90 | -1.75 | -26.36% | 3.89 | 3.35 | -0.55 | -14.00% |
Kinsta vs HostGator
| Kinsta vs HostGator | ||||||||
| Metric | First View | Repeat View | ||||||
| Original | Kinsta | Δ | %Δ | Original | Kinsta | Δ | %Δ | |
| TTFB (sec) | 2.02 | 0.55 | -1.47 | -72.94% | 1.08 | 0.24 | -0.84 | -77.56% |
| LCP (sec) | 3.70 | 2.42 | -1.28 | -34.51% | 2.04 | 1.44 | -0.60 | -29.35% |
| TBT (sec) | 0.22 | 0.26 | 0.03 | 14.64% | 0.11 | 0.12 | 0.01 | 6.02% |
| FLT (sec) | 5.07 | 3.29 | -1.78 | -35.15% | 2.57 | 1.50 | -1.08 | -41.86% |
Kinsta vs Liquid Web
| Kinsta vs Liquid Web | ||||||||
| Metric | First View | Repeat View | ||||||
| Original | Kinsta | Δ | %Δ | Original | Kinsta | Δ | %Δ | |
| TTFB (sec) | 1.13 | 0.55 | -0.58 | -51.28% | 0.92 | 0.39 | -0.53 | -57.65% |
| LCP (sec) | 2.80 | 2.16 | -0.64 | -22.83% | 1.75 | 1.19 | -0.57 | -32.24% |
| TBT (sec) | 0.26 | 0.27 | 0.01 | 3.46% | 0.19 | 0.22 | 0.04 | 20.14% |
| FLT (sec) | 4.45 | 3.66 | -0.79 | -17.71% | 2.83 | 1.83 | -1.00 | -35.21% |
Kinsta vs Amazon AWS
| Kinsta vs Amazon AWS | ||||||||
| Metric | First View | Repeat View | ||||||
| Original | Kinsta | Δ | %Δ | Original | Kinsta | Δ | %Δ | |
| TTFB (sec) | 1.22 | 0.96 | -0.27 | -21.88% | 1.16 | 0.51 | -0.64 | -55.69% |
| LCP (sec) | 3.05 | 3.29 | 0.24 | 7.71% | 2.09 | 1.55 | -0.54 | -25.75% |
| TBT (sec) | 0.30 | 0.33 | 0.03 | 10.05% | 0.24 | 0.17 | -0.07 | -28.73% |
| FLT (sec) | 4.17 | 4.46 | 0.29 | 7.00% | 2.82 | 1.91 | -0.90 | -32.08% |
Kinsta vs Cloudways
| Kinsta vs Cloudways | ||||||||
| Metric | First View | Repeat View | ||||||
| Original | Kinsta | Δ | %Δ | Original | Kinsta | Δ | %Δ | |
| TTFB (sec) | 0.71 | 0.63 | -0.08 | -11.47% | 0.44 | 0.38 | -0.07 | -15.12% |
| LCP (sec) | 2.43 | 2.47 | 0.04 | 1.71% | 1.26 | 1.23 | -0.03 | -2.26% |
| TBT (sec) | 0.44 | 0.50 | 0.05 | 11.93% | 0.27 | 0.22 | -0.05 | -18.52% |
| FLT (sec) | 4.79 | 5.15 | 0.35 | 7.36% | 1.37 | 1.64 | 0.27 | 19.68% |
Kinsta vs Digital Ocean
| Kinsta vs Digital Ocean | ||||||||
| Metric | First View | Repeat View | ||||||
| Original | Kinsta | Δ | %Δ | Original | Kinsta | Δ | %Δ | |
| TTFB (sec) | 0.93 | 0.54 | -0.39 | -42.45% | 0.75 | 0.19 | -0.56 | -74.84% |
| LCP (sec) | 3.26 | 4.21 | 0.95 | 29.25% | 2.37 | 1.75 | -0.62 | -26.15% |
| TBT (sec) | 0.39 | 0.40 | 0.01 | 3.33% | 0.42 | 0.39 | -0.03 | -7.03% |
| FLT (sec) | 5.12 | 5.38 | 0.26 | 5.12% | 4.37 | 1.94 | -2.42 | -55.46% |
Kinsta vs SiteGround
| Kinsta vs SiteGround | ||||||||
| Metric | First View | Repeat View | ||||||
| Original | Kinsta | Δ | %Δ | Original | Kinsta | Δ | %Δ | |
| TTFB (sec) | 0.62 | 0.88 | 0.27 | 43.41% | 0.62 | 0.40 | -0.23 | -36.46% |
| LCP (sec) | 2.21 | 2.75 | 0.53 | 24.01% | 1.44 | 1.25 | -0.19 | -13.09% |
| TBT (sec) | 0.19 | 0.26 | 0.07 | 36.74% | 0.11 | 0.13 | 0.02 | 17.46% |
| FLT (sec) | 3.16 | 3.49 | 0.33 | 10.56% | 1.89 | 1.70 | -0.19 | -10.11% |
Kinsta vs Other
The “Other” hosting provider category includes niche hosts that aren’t our significant competitors.
| Kinsta vs Other | ||||||||
| Metric | First View | Repeat View | ||||||
| Original | Kinsta | Δ | %Δ | Original | Kinsta | Δ | %Δ | |
| TTFB (sec) | 1.40 | 0.91 | -0.49 | -35.05% | 1.03 | 0.46 | -0.57 | -55.75% |
| LCP (sec) | 3.33 | 3.16 | -0.17 | -5.15% | 1.94 | 1.45 | -0.49 | -25.11% |
| TBT (sec) | 0.31 | 0.36 | 0.05 | 15.80% | 0.21 | 0.21 | 0.00 | 0.86% |
| FLT (sec) | 4.99 | 4.75 | -0.23 | -4.71% | 2.89 | 2.33 | -0.56 | -19.34% |
Key Takeaways from the Results
You’ll notice that we faltered in some of the First View results’ metrics, but we performed exceedingly well in the Repeat View results. That speaks volumes about our server-level caching solution and CDN integration.
Our TTFB game is spot on in all the results — the only exception is the First View results against SiteGround. We do beat them convincingly in the Repeat View results.
LCP is the most relevant user-centric metric for improving a website’s perceived performance. Again, we perform superbly here in most of the results — especially Repeat View results. Going by LCP stats, on average, client sites experience 20% faster load times by migrating to Kinsta.
We won’t discuss the TBT results in detail as they depend more on the website code than the hosting provider. However, peeking into TBT scores may provide website optimization opportunities for our newly migrated clients to speed up their sites further.
Finally, there’s the FLT metric. Overall, we topped the FLT metric’s Repeat View results by a large margin, and in its First View results, we beat or almost matched our competitors — the one exception was Cloudways.
Here’s how fast your site can run (and how slow the competition is):
- From BlueHost to Kinsta: +39% improved page load times (avg.)
- From Amazon AWS to Kinsta: +26% improved page load times avg.)
- From Digital Ocean to Kinsta: +26% improved page load times (avg.)
- From Liquid Web to Kinsta: +32% improved page load times (avg.)
- From Cloudways to Kinsta: +2% improved page load times (avg.)
- From HostGator to Kinsta: +29% improved page load times (avg.)
- From Dreamhost to Kinsta: +11% improved page load times (avg.)
- From SiteGround to Kinsta: +13% improved page load times (avg.)
- From Other to Kinsta: +25% improved page load times (avg.)
How is this possible? That’s because all of Kinsta’s customers enjoy:
- A powerful cloud infrastructure
- A stack fine-tuned for WordPress for over 8+ years
- Free CDN powered by Cloudflare’s global network of 300+ locations
- A hard-to-top server-level caching solution
- Edge Caching to deliver your pages even faster to browsers around the world
We’re satisfied with the results here. But we know we still have room for improvement!
Our obsession with website speed compels us to work tirelessly to launch new features regularly. Visit our Changelog page for an up-to-date list of all our latest tools and upgrades.
Summary
There are many good WordPress hosts, but we’ve set out to make Kinsta’s managed hosting solution the best option for your site. Many of the world’s biggest brands and web agencies rely on Kinsta to supercharge their websites.
With rigorous testing over three months, we’ve demonstrated why migrating to Kinsta can give your site a free performance boost.
While improving site speed is the most important criteria to look out for when migrating to a new host, you should also consider other vital factors. For example, we offer many more valuable features to all our clients:
- Free Kinsta CDN, automatic Cloudflare wildcard SSLs, free premium DNS powered by Amazon Route53, staging environments, and automatic daily backups (with the option to create manual backups anytime).
- Full page caching at the server level delivers content instantaneously to visitors. We pair that with our in-house Kinsta MU plugin to provide granular control over caching.
- Support for the latest PHP versions
- Free hack fixes for all websites hosted with us. If your WordPress site is hacked, we’ll fix it with immediate priority.
- Server-level rules and optimizations for WooCommerce and Easy Digital Downloads to ensure a smoother checkout experience.
- MyKinsta — our custom-designed dashboard — to help you manage and improve your site quickly. Schedule a demo of our MyKinsta dashboard and see how it all works.
- MyKinsta analytics reports for data analysis and performance insights.
- Multi-user access with fine-grained permissions. Add any number of users to your team. Give them access to all your sites, just billing, or add them as developers or administrators to a subset of your sites.
- Free Kinsta APM tool for debugging performance issues on your site.
- SSH access, Git, and WP-CLI support.
- Full integration with DevKinsta, our local development tool. You can clone your live or staging sites to a local environment, make any changes, and quickly push the updates to your live or staging Kinsta site.
Kinsta offers free migrations from other hosts on all its plans. Simply sign up for one of our plans to get started. Test the service and the speed risk-free, and we provide a 30-day money-back guarantee. You only lose if you don’t give us a try!