Add as a preferred source on Google
Most hosting providers talk about speed in averages. Average response time. Average load time. Average benchmark scores. But real visitors don’t experience averages. They experience the page in front of them, on their device, over their connection, at that specific moment.
A site might look great in a speed test and still feel slow when a shopper reaches checkout, a member logs in, a form submits, or traffic suddenly picks up. Those slower moments may affect only a small percentage of visits, but they are often the ones that matter most.
This is why performance consistency deserves more attention. Peak speed is useful, but predictable speed is what creates a smoother user experience.
For WordPress sites, especially those with e-commerce, memberships, LMS features, admin activity, or unpredictable traffic patterns, the real question isn’t just “How fast can this site be?” It’s “How often does it stay fast?”
The problem with average-based performance claims
Average speed is easy to promote because it compresses a lot of activity into one simple number. It gives teams something clean to compare, report, and market.
But averages can also hide the exact problems your visitors are most likely to remember.
For example, a page might load quickly for most users but slow down sharply for a handful of users. Once those fast and slow visits are blended together, the final average can still look acceptable. On paper, performance seems fine. In practice, some users are stuck waiting.
This matters because slow experiences are rarely distributed evenly. They often show up during specific conditions, such as:
- Traffic spikes
- Cache misses
- Logged-in sessions
- Checkout activity
- Search queries
- Form submissions
- Backend admin work
- Bot traffic
- Database-heavy requests
A homepage speed test may never expose those issues. Neither does a single average response time. You could have a site that appears fast in a monthly report, while a portion of visitors regularly experience delays at key moments.
And for WordPress sites, those important moments often involve dynamic activity, such as a WooCommerce cart, a membership dashboard, an LMS lesson, or a filtered product search.
Your speed tests may look fine, but that’s not the whole picture
Speed tests are useful. They can show obvious performance issues, help teams track improvements, and give you a baseline for comparison.
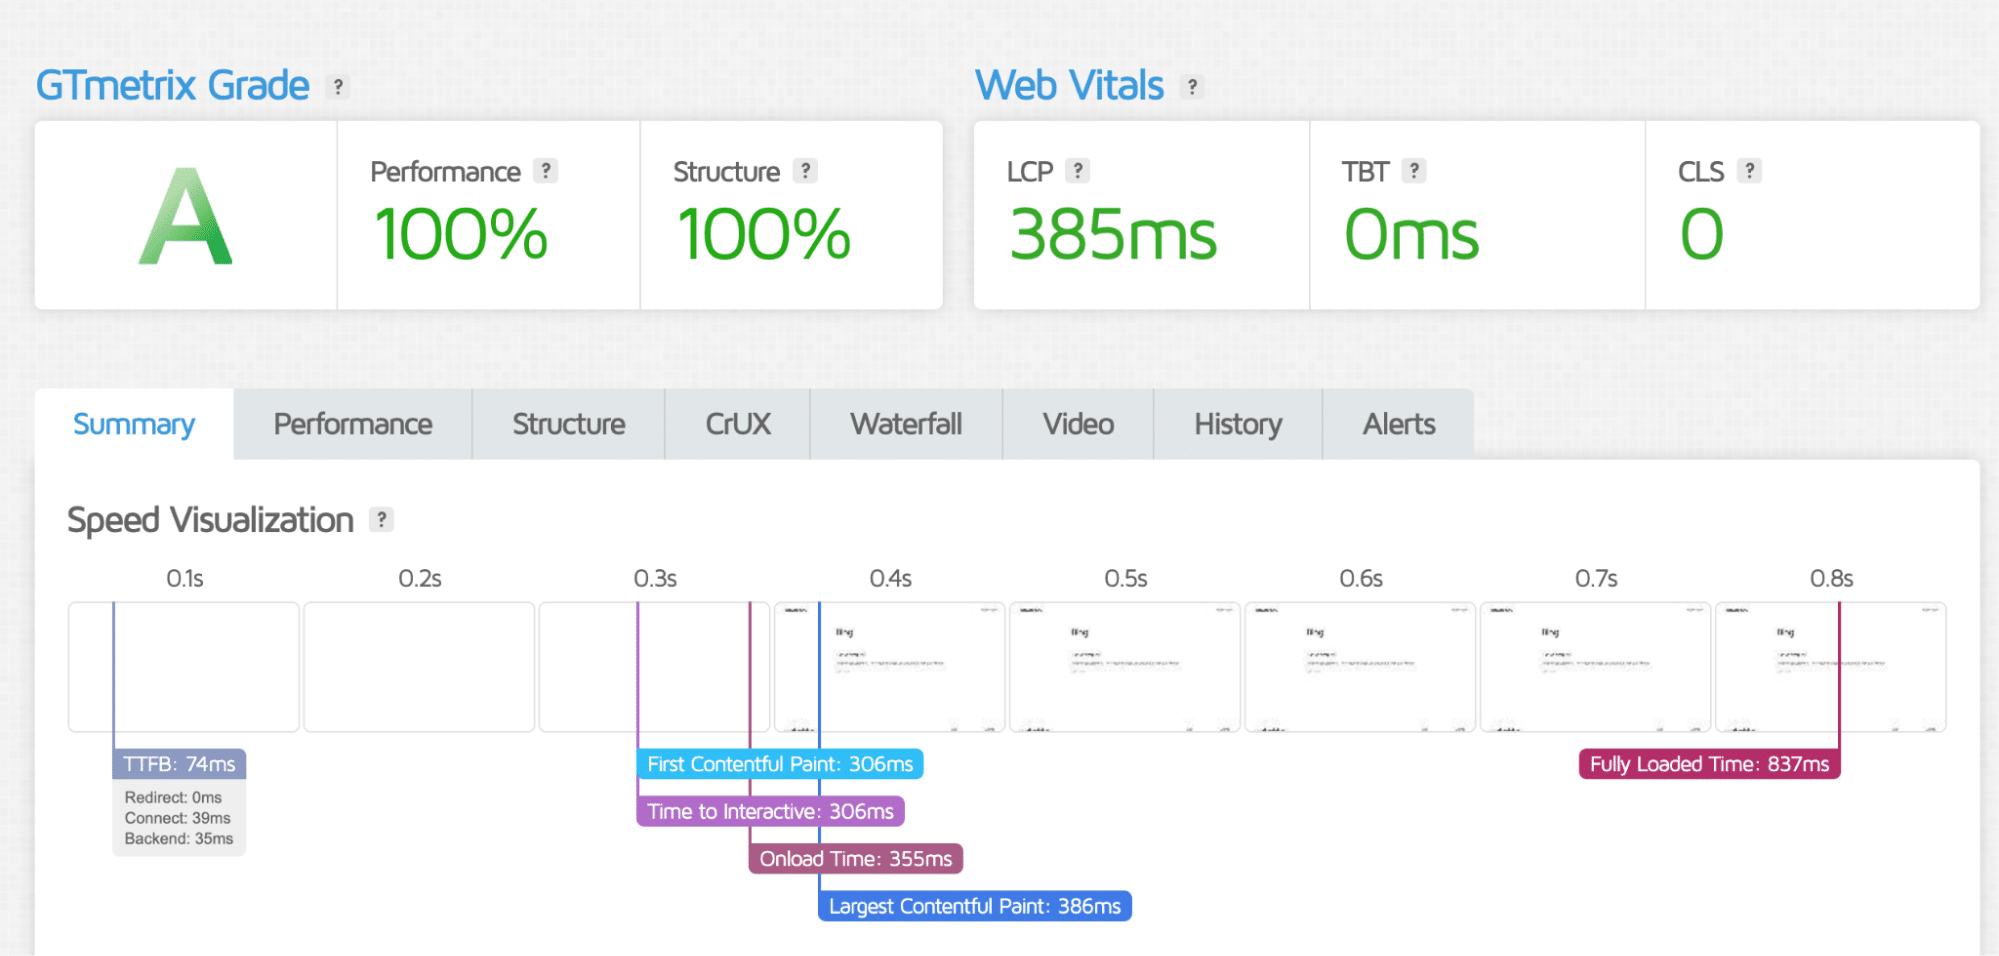
But they’re still a snapshot.
Most synthetic tests measure a single page, from a single location, at a single moment in time. Depending on how the test is configured, it may also be measuring a clean, cached version of the page under ideal conditions. That can be helpful for controlled testing, but it doesn’t always reflect what real users experience.
Actual visitors arrive with more variables in play. They use different devices, browsers, networks, and locations. Some are seeing cached pages. Others trigger uncached or partially cached requests. Some are logged in. Others are adding products to a cart, submitting a form, searching a catalog, or moving through checkout.
Those interactions can put very different demands on a WordPress site.
A synthetic test might tell you your homepage loads quickly. It may not tell you whether your checkout stays responsive during a promotion, whether logged-in members can move smoothly through an account dashboard, or whether a search-heavy product page slows down when traffic increases.
This is one reason “our speed tests look fine” can be misleading. The tests may be accurate for what they measured. They’re just not measuring every experience that matters.
Why p95 and p99 performance matter
If averages show the middle of the story, percentiles show the edges.
Performance percentiles help you understand what slower visitors are experiencing, not just what the typical visit looks like. Instead of blending all requests into a single number, they show how performance varies across different user groups.
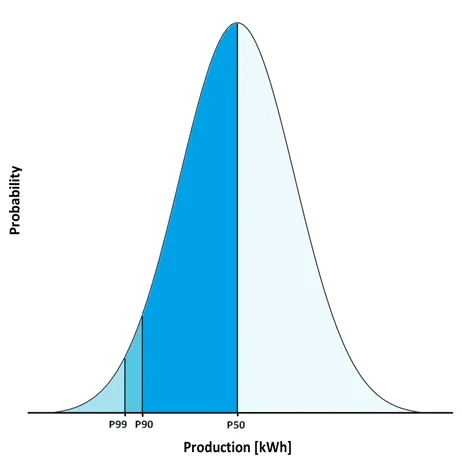
For example, p95 performance represents the slowest 5% of experiences. If your p95 load time is high, it means 5 out of every 100 visits are noticeably slower than the rest. p99 goes even further, showing the slowest 1% of experiences.
That might sound like a small slice of traffic. But on a busy site, it adds up quickly.
If your site gets 100,000 visits a month, a slow p95 experience could affect thousands of sessions. If those sessions happen during checkout, account login, lead generation, or product search, the business impact can be much bigger than the percentage suggests.
Percentiles are especially useful because they reveal patterns that averages can bury. A site may have a reasonable average response time while still delivering poor experiences to users caught in traffic spikes, cache misses, database-heavy requests, or uncached ecommerce flows.
For technical teams, p95 and p99 metrics offer a more honest way to evaluate hosting performance. They help answer questions like:
- How often does the site slow down?
- How bad do the slowest requests get?
- Are dynamic pages staying responsive?
- Does performance hold steady during heavier traffic?
- Are a small number of slow requests dragging down important user journeys?
These numbers don’t replace average speed, but they give it context. A fast average is nice to have. A stable p95 and p99 tell you whether that speed is reaching the users who are most likely to notice when it doesn’t.
What causes inconsistent WordPress performance?
WordPress performance usually doesn’t come down to one problem. It comes down to workload.
A simple cached page and a dynamic checkout request may live on the same site, but they ask very different things from the server. When hosting can handle one type of request well but struggles with the other, performance starts to feel uneven.
Cached pages are the easy part
Caching can make WordPress extremely fast. When someone visits a cached homepage, blog post, or landing page, the server can often serve a saved version of that page instead of rebuilding it from scratch. That means less work for PHP, fewer database queries, and faster response times for visitors.
This is why a site can perform beautifully in a homepage speed test. The page may be lightweight, cached, and easy to serve.
But many of the moments that matter most in WordPress don’t work that way.
Dynamic pages need more server resources
WooCommerce cart and checkout pages usually can’t rely on the same full-page caching as a public blog post. The content changes based on the individual shopper, cart contents, shipping details, taxes, coupons, payment options, and session data.
The same applies to:
- Logged-in account pages
- Membership dashboards
- LMS lessons and progress tracking
- Personalized content
- Product filtering and internal search
- Form submissions
- Admin screens and editorial workflows
These requests often need PHP threads, database queries, plugin logic, and sometimes third-party services before WordPress can return a response.
That’s where inconsistency often shows up. One visitor reading a cached article may get a fast response. Another visitor updating a cart or submitting a form may hit a much heavier request seconds later.
Plugins, themes, and third-party calls can create uneven slowdowns
Plugins and themes can also make performance harder to predict.
A plugin might add database queries to product pages. A theme might load extra scripts across the entire site. A form plugin might call an external service during submission. A shipping, tax, CRM, analytics, or payment integration might add extra wait time to one part of the user journey.
These issues don’t always affect every page. The homepage may still feel quick, while checkout, search, account pages, or the WordPress admin area slow down.
This makes inconsistent performance frustrating to assess. The site isn’t simply “fast” or “slow.” It depends on what the visitor is doing.
Background tasks can compete with live traffic
WordPress sites are busy even when visitors aren’t clicking around. Product imports, scheduled posts, backups, plugin updates, security scans, analytics jobs, email syncs, reporting tools, and admin activity all use resources. On a quiet site, those jobs may run without anyone noticing. During a busy period, they can compete with live traffic.
For example, a WooCommerce store might run an inventory sync while shoppers are browsing products and moving through checkout. A membership site might process email automations while logged-in users are loading lesson pages. A content site might run backups while editors are working in the dashboard.
Each task may be reasonable on its own. Together, they can push response times higher.
Traffic spikes and bots add pressure fast
Traffic rarely arrives in a perfectly steady line. A sale, newsletter, ad campaign, social post, product launch, or press mention can send a quick rush of visitors to the site. Bot traffic can trigger the same effect, often without warning. Unlike a promotional spike, it doesn’t correlate with any business activity that would help you anticipate it.
The infrastructure impact depends on where bots land. A bot hitting cached pages adds relatively little pressure. A bot hitting dynamic endpoints like cart pages, filtered product URLs, or search queries with parameters requires the same server resources as a real visitor on every single request. At scale, that kind of automated traffic can exhaust PHP capacity and slow response times for legitimate users even when nothing about the site itself has changed.
If most incoming traffic hits cached pages, the site may handle the pressure well. But when bots or a traffic surge push volume through uncached dynamic endpoints, the workload changes quickly and response times follow.
Shared resources can make performance harder to explain
Shared infrastructure adds another layer of uncertainty. When multiple sites compete for the same underlying CPU and memory, one site’s activity can affect another site’s performance. Your WordPress site may not have changed. Your plugins may not have updated. Your traffic may look normal. But if resource contention increases around your site, it can still slow down.
That unpredictability makes troubleshooting harder. You can optimize the site itself and still run into performance dips due to the surrounding environment.
Why consistency matters more than peak speed
Peak speed makes for a good headline. It can show what a hosting environment is capable of under the right conditions.
But users don’t judge a site by its best moment. They judge it by the visit they actually have.
A homepage that loads quickly in a test doesn’t guarantee a smooth checkout experience. A cached landing page doesn’t tell you how search, login, cart updates, or form submissions behave when the site is under pressure. And a fast result from one location at one point in time doesn’t prove performance will hold steady throughout the day.
Consistency is what keeps the experience feeling reliable.
- For e-commerce sites, that means cart and checkout pages stay responsive when shoppers are ready to buy.
- For membership sites, it means users can log in and access content without delays.
- For lead generation sites, it means forms submit smoothly instead of hanging at the worst possible moment.
The same applies to agencies and technical teams. A site that performs well only under ideal conditions is harder to support. It creates more uncertainty, more troubleshooting, and more awkward client conversations. Predictable performance gives teams something steadier to monitor, explain, and improve.
How Kinsta supports predictable WordPress performance
Consistent performance starts with the hosting environment itself. At Kinsta, every WordPress site runs in its own isolated container with dedicated resources that aren’t shared with other sites, even sites on the same account. That separation directly addresses the issue of one site affecting response times on another without any visible cause.
Caching plays a major role across two layers. Edge Caching distributes cached HTML across a global network of data centers, serving pages from locations close to each visitor, boosting performance by up to 40% and bypassing PHP threads entirely for cacheable requests. That frees up PHP capacity for the requests that actually need it. For dynamic pages that can’t be fully cached, Redis object caching reduces database load by storing query results in memory, so PHP doesn’t re-query the database on every request.
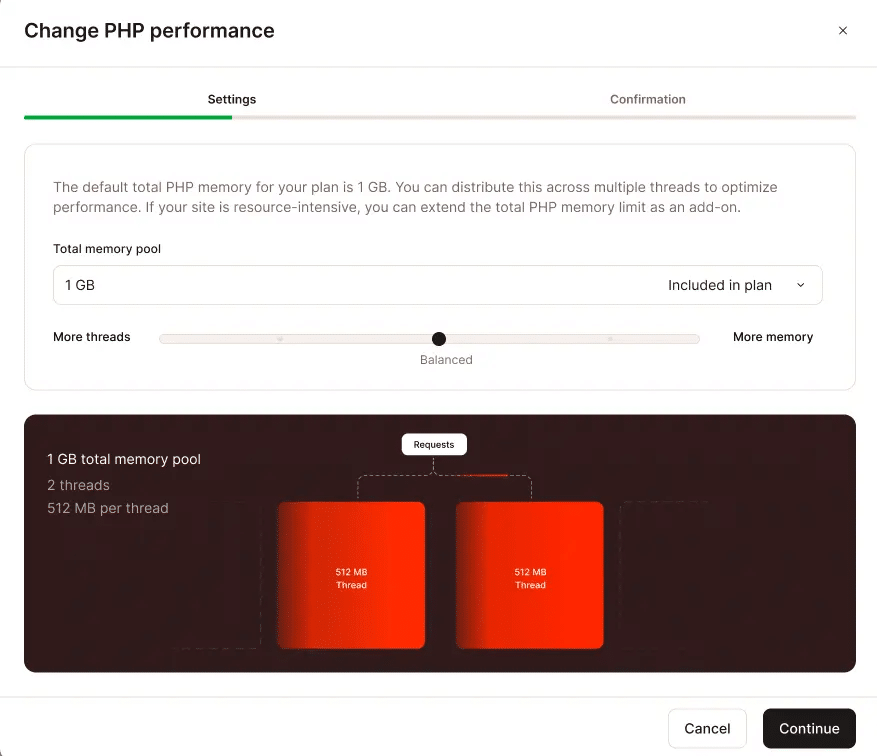
Because Edge Caching and Redis keep more requests out of PHP entirely, the remaining PHP threads are available for workloads that genuinely need them. For teams running complex WordPress sites, Kinsta provides visibility into and control over PHP performance directly in MyKinsta, which is especially useful when workloads include uncached WooCommerce pages, membership areas, LMS content, admin activity, or sustained traffic that arrives unevenly.
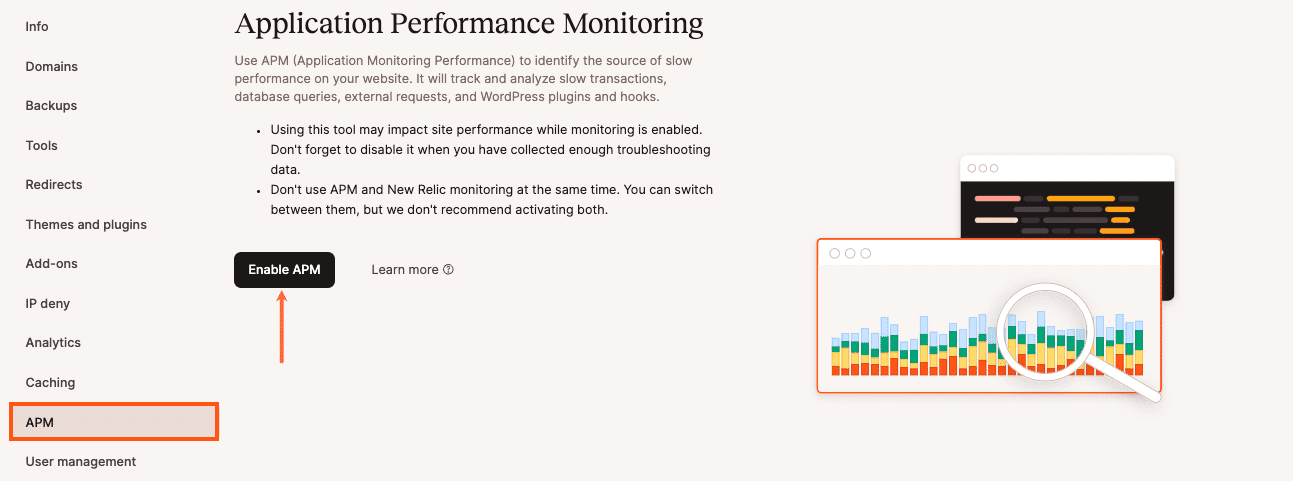
Visibility matters too. The Kinsta APM tool helps identify PHP performance bottlenecks, slow MySQL queries, external HTTP calls, and other backend activity that can affect specific requests. Instead of guessing why a checkout page, login screen, or account area is slow, teams can investigate the parts of the request that are taking the most time.
None of this removes the need for good site architecture, clean code, optimized plugins, and sensible caching rules. But it gives WordPress teams a stronger foundation for handling the mix of traffic real sites receive: cached visitors, uncached requests, logged-in sessions, admin work, and sustained traffic that doesn’t always arrive neatly or evenly.
Fast averages don’t guarantee fast experiences
Average speed can be useful, but it shouldn’t be the only number guiding your hosting decisions.
A site can look fast in a benchmark and still frustrate users when checkout slows down, logged-in pages lag, search takes too long, or a form submission hangs.
Those moments may not ruin your average performance score, but they can shape how people feel about your site.
Consistency is the more practical goal: WordPress performance that holds up across cached pages, dynamic requests, admin activity, and sustained traffic.
Fast on average isn’t the same as fast for the user who’s ready to convert.
If you’re ready for WordPress hosting designed around consistent performance, explore Kinsta’s managed WordPress hosting plans.