When it comes to your WordPress site, speed is important. This is a fact. Why? First off, website speed is a significant factor in Google’s algorithm. Fast-loading websites can expect to rank higher in the SERPs and attract more visitors. Second, there are all the user experience considerations. If a site loads quickly, visitors are more likely to stick around, read your content, and ultimately convert. In other words, a lightning-quick website unlocks all the good things that webmasters crave.
However, we’re not here today to talk about how to make your website faster. We’ve already covered that extensively in our speed up WordPress guide and article on page speed. We’re here to discuss another common problem we see WordPress users making on a daily basis, and that is running a website speed test incorrectly.
You might not think this is that big of a problem… but in reality, it is, especially when you’re trying to gauge improvements. If you run a website speed test the wrong way, it might appear that your site is slower, when actually it’s faster.
So below, we’ll dive into the proper way to run a website speed test, along with some tools you can use to tangibly measure your site’s speed and track any improvements.
Before You Run a Website Speed Test
Before running a speed test, you should check to see if you have the following two things already configured and running on your WordPress site:
If you don’t know, check with your web developer or hosting provider. And if you’re launching a brand new site, make sure to set these things up first, and then run your speed tests.
1. Configure Caching
If you’re a Kinsta client, our server-level page cache will already be running on your live WordPress site, so there’s nothing you need to configure. However, remember that caching is disabled on our staging environments by default for development and debugging purposes. To enable caching on a staging environment, you can toggle the “Enable Cache” button on the tools page for your site in MyKinsta.
An instant 37% reduction in the loading time after moving @WPColt to @kinsta! (NO CACHING PLUGINS) 🚀🚀🚀
— WPColt (@WPColt) January 3, 2018
If you’re hosting elsewhere, make sure to check out their documentation to ensure caching is enabled. If you’re using a shared host or VPS, this might mean you need to install a WordPress caching plugin.
2. Enable Content Delivery Network (CDN)
If you don’t know what a content delivery network is, you should first read our in-depth post on why you should be using a WordPress CDN. In 99.9% of scenarios, it will have a huge impact on the speed of your site. Depending on the location of the data center your site is hosted on, and the location of your visitors, we’ve seen a CDN decrease load times by over 50%!
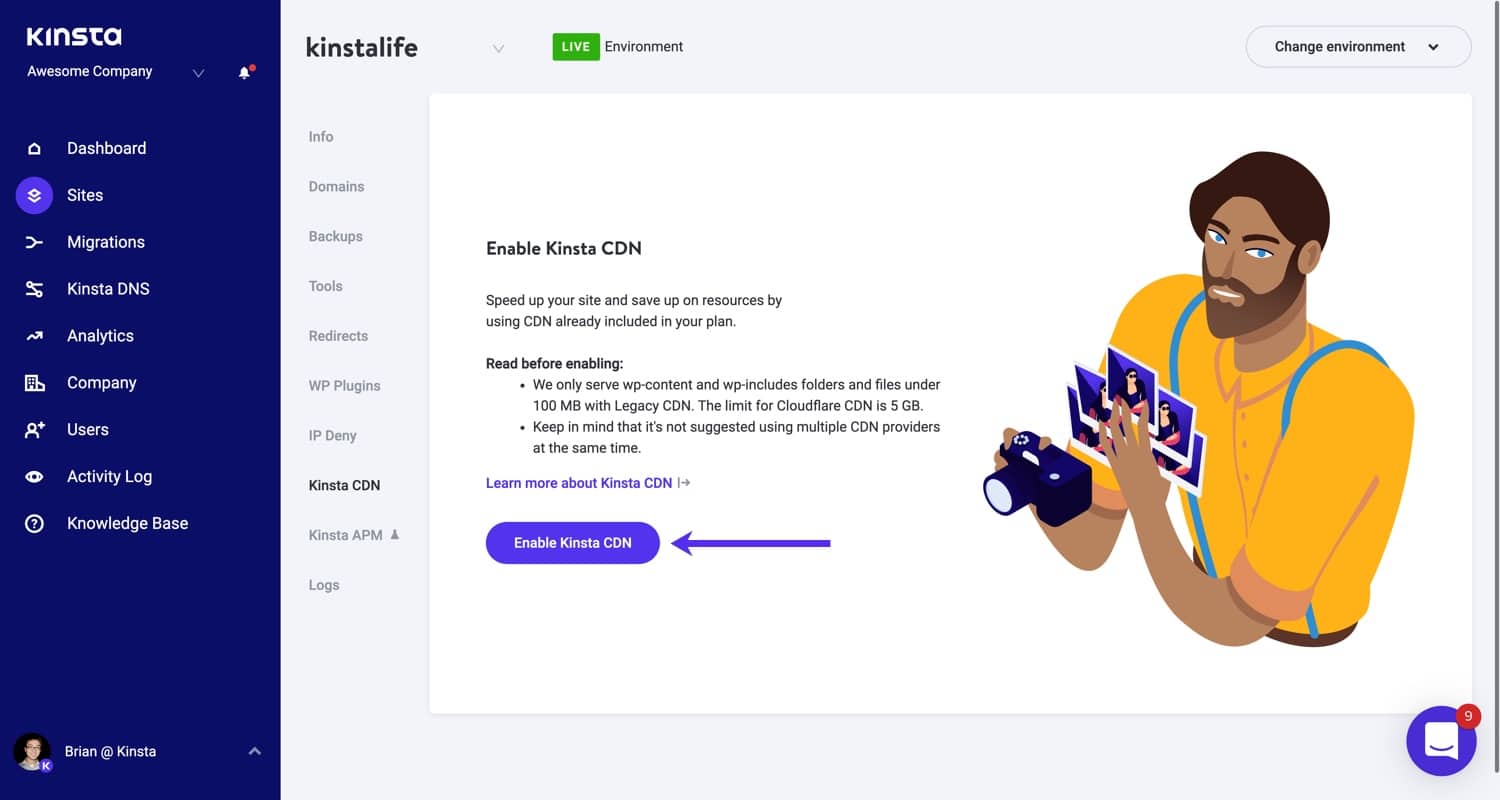
If you’re a Kinsta client, we include free CDN bandwidth on all of our hosting plans. You can enable the Kinsta CDN in two simple steps.
Step 1
First, log in to your MyKinsta dashboard. Click on your site and then on the Kinsta CDN tab.
Step 2
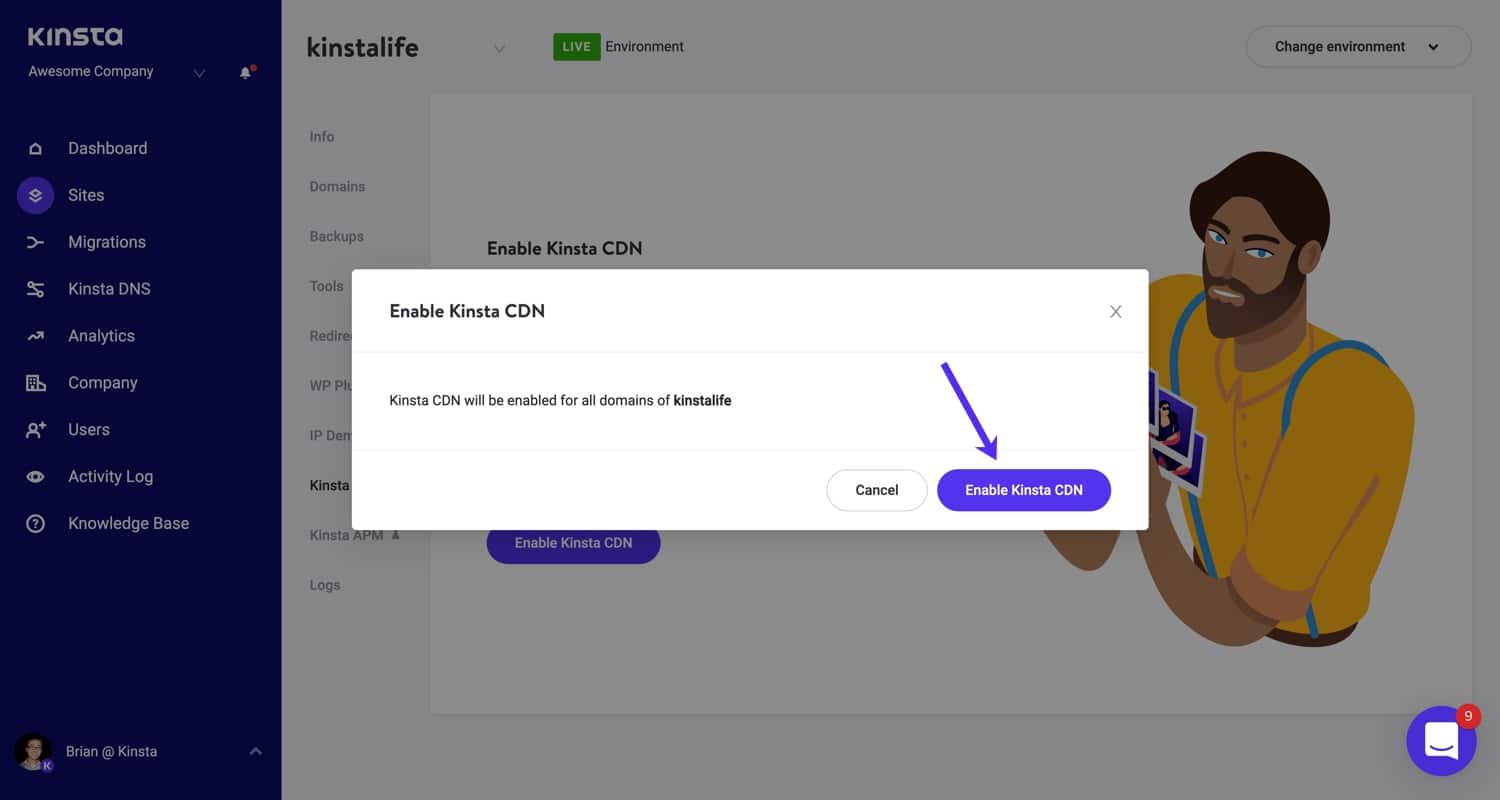
Then confirm the change by clicking on the Enable Kinsta CDN button in the modal window that appears.
If you are using or interested in Cloudflare, we have an in-depth tutorial on how to install Cloudflare on your WordPress site and this post on the most optimal settings. We also recommend checking out our comparison of the Kinsta CDN vs Cloudflare, and our guide on CloudFlare’s Automatic Platform Optimization.
Third-party CDN providers should have documentation you can follow to set up their CDN on your WordPress site. You can then use a free plugin like CDN Enabler.
How to Properly Run a Website Speed Test
Now that you have caching configured and a CDN enabled, it’s time to dive into how to properly speed test your WordPress site.
There are a lot of different tools you can use to measure the performance of your site. You can check out a full list further below. For this example, we are going to be using Pingdom, one of the most popular and commonly used tools.
Speed Test Location Matters
Almost every speed test tool allows you to choose from different testing locations around the globe, and this matters quite a bit. This is because your speed is relative to the data center where your WordPress site is hosted. TTFB, network latency, and more come into play. And if you’re a Kinsta client, we have 27 different data centers you can choose from for your sites.
So it’s important to speed test your site both from a location that’s close to your data center, as well as one that’s far away. This will also help you see how much of an impact the CDN has on your WordPress site. You can even disable your CDN temporarily and re-test again without it to really see the difference.
Whatever you do, be consistent with the location you choose.
You Have to Test Multiple Times
We won’t go too deep into caching in this article, but just remember that caching — both from your WordPress host or plugin and from your CDN — is what makes your WordPress site load super fast.
The big problem is that many users tend to only run a speed test once. Often in this case, the content isn’t cached on the WordPress host or CDN yet, and so it appears that the site is actually slower. This can also happen if you’ve just cleared your WordPress site or CDN’s cache.
How can you tell that your content or media isn’t serving from cache?
It’s easy: Every speed test tool shows you what are called HTTP headers (also known as response headers). These contain important information about each request.
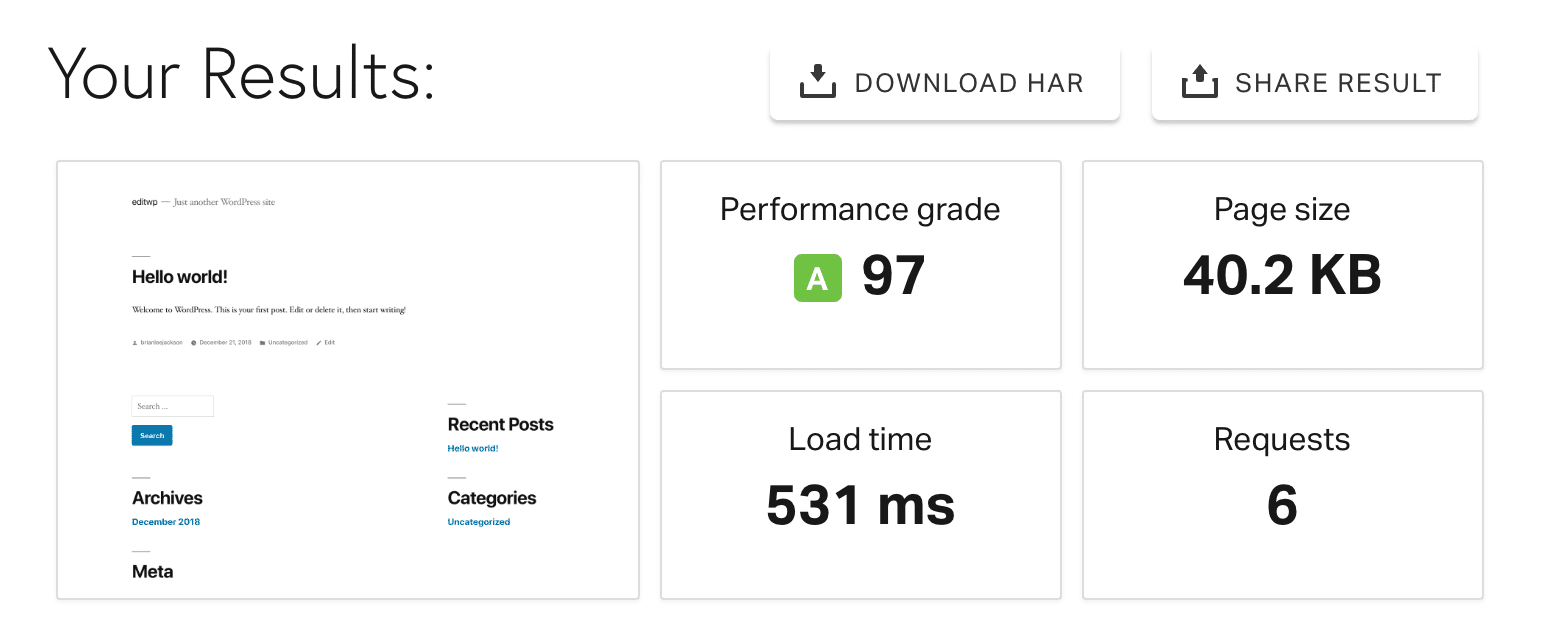
We have a development site set up at Kinsta with the Kinsta CDN enabled. We first tested it through Pingdom and got the following result.
If you take a look at the example below, the first request is to the primary domain, and this is loading directly from the Kinsta server. Below that, you can see the rest of the requests are loading from the Kinsta CDN (xxxx.kinstacdn.com).
If you look at the request to the Kinsta server, you’ll see a header called x-kinsta-cache. When it’s not serving from cache yet, it will register a MISS. The name of this header might vary slightly based on your hosting provider.
The Kinsta CDN requests below that are the same way. Look for the header called x-cache. When it’s not serving from cache yet, it will register a MISS. Again, the name of the header might vary slightly based on your CDN provider. For example, when you’re using Cloudflare, the HTTP header is called cf-cache-status.
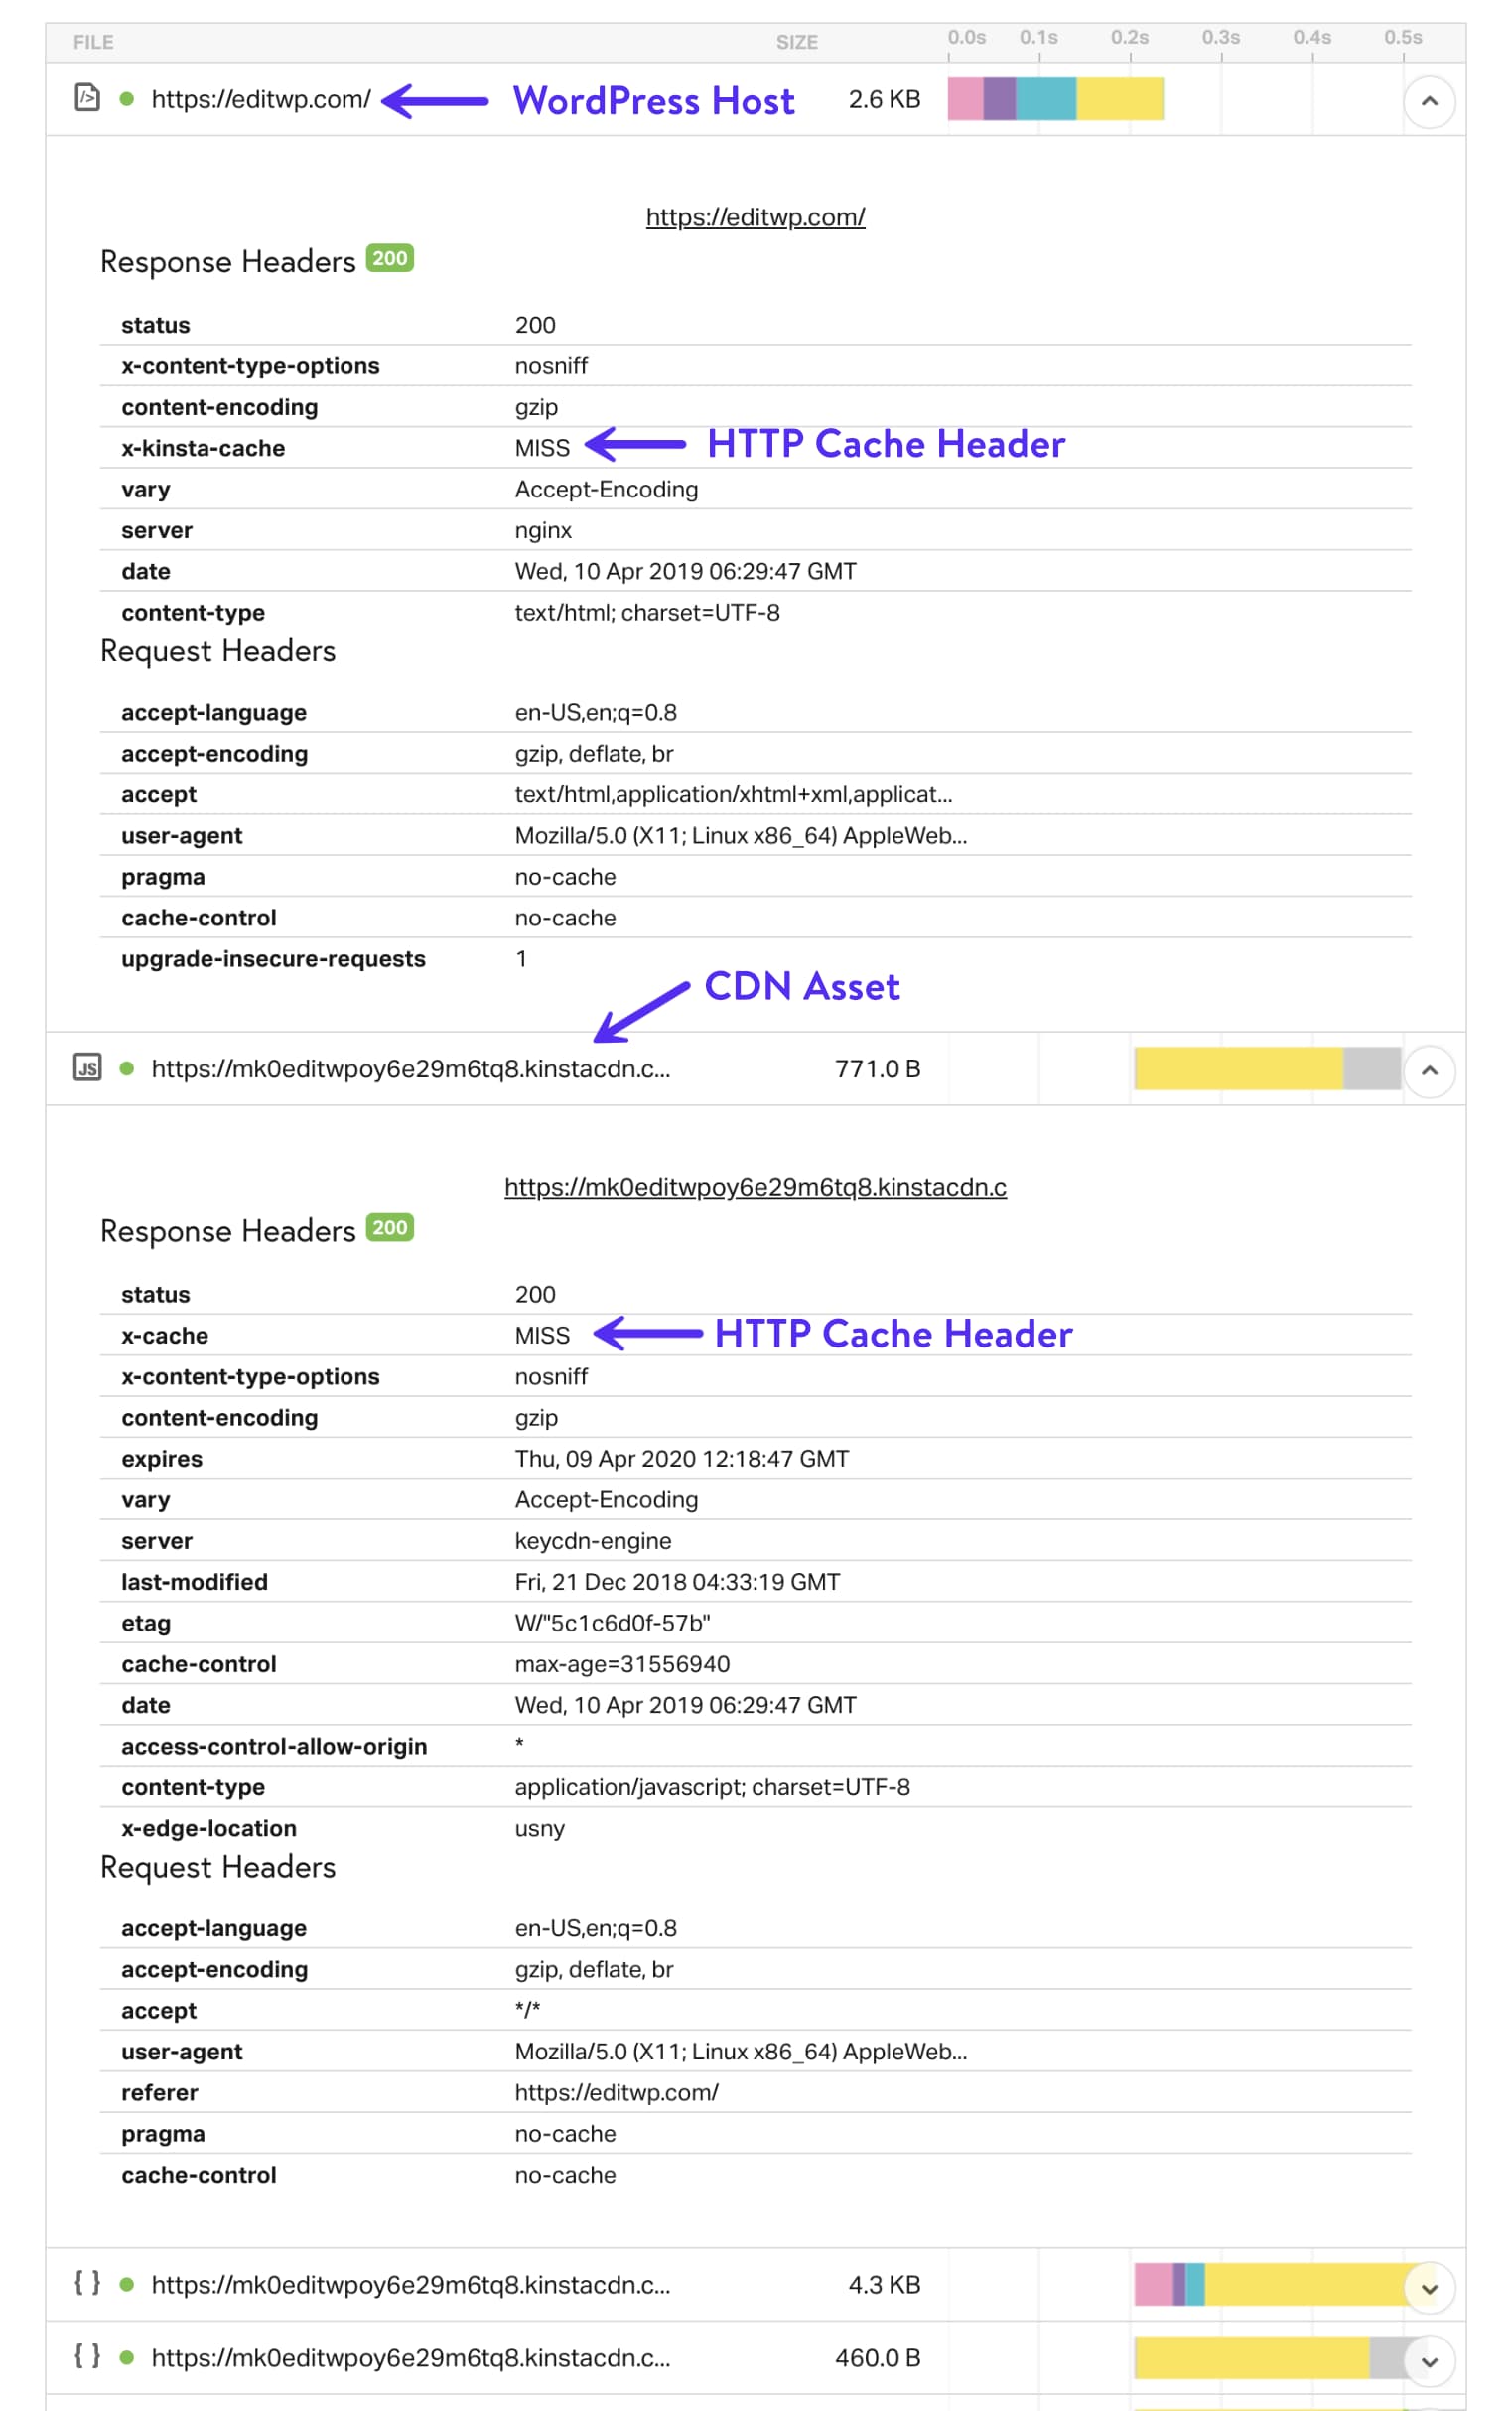
To properly speed test, you need to see everything load from cache, both from your WordPress host and your CDN. Once everything is in view, the x-kinsta-cache and x-cache headers will register a HIT (as seen below). This usually requires running your speed test multiple times. We’ve found that three is usually the magic number.
Some speed test tools like Pingdom also limit the time between each test (usually a couple of minutes), so you might have to run your speed test, come back later, run it again, etc.
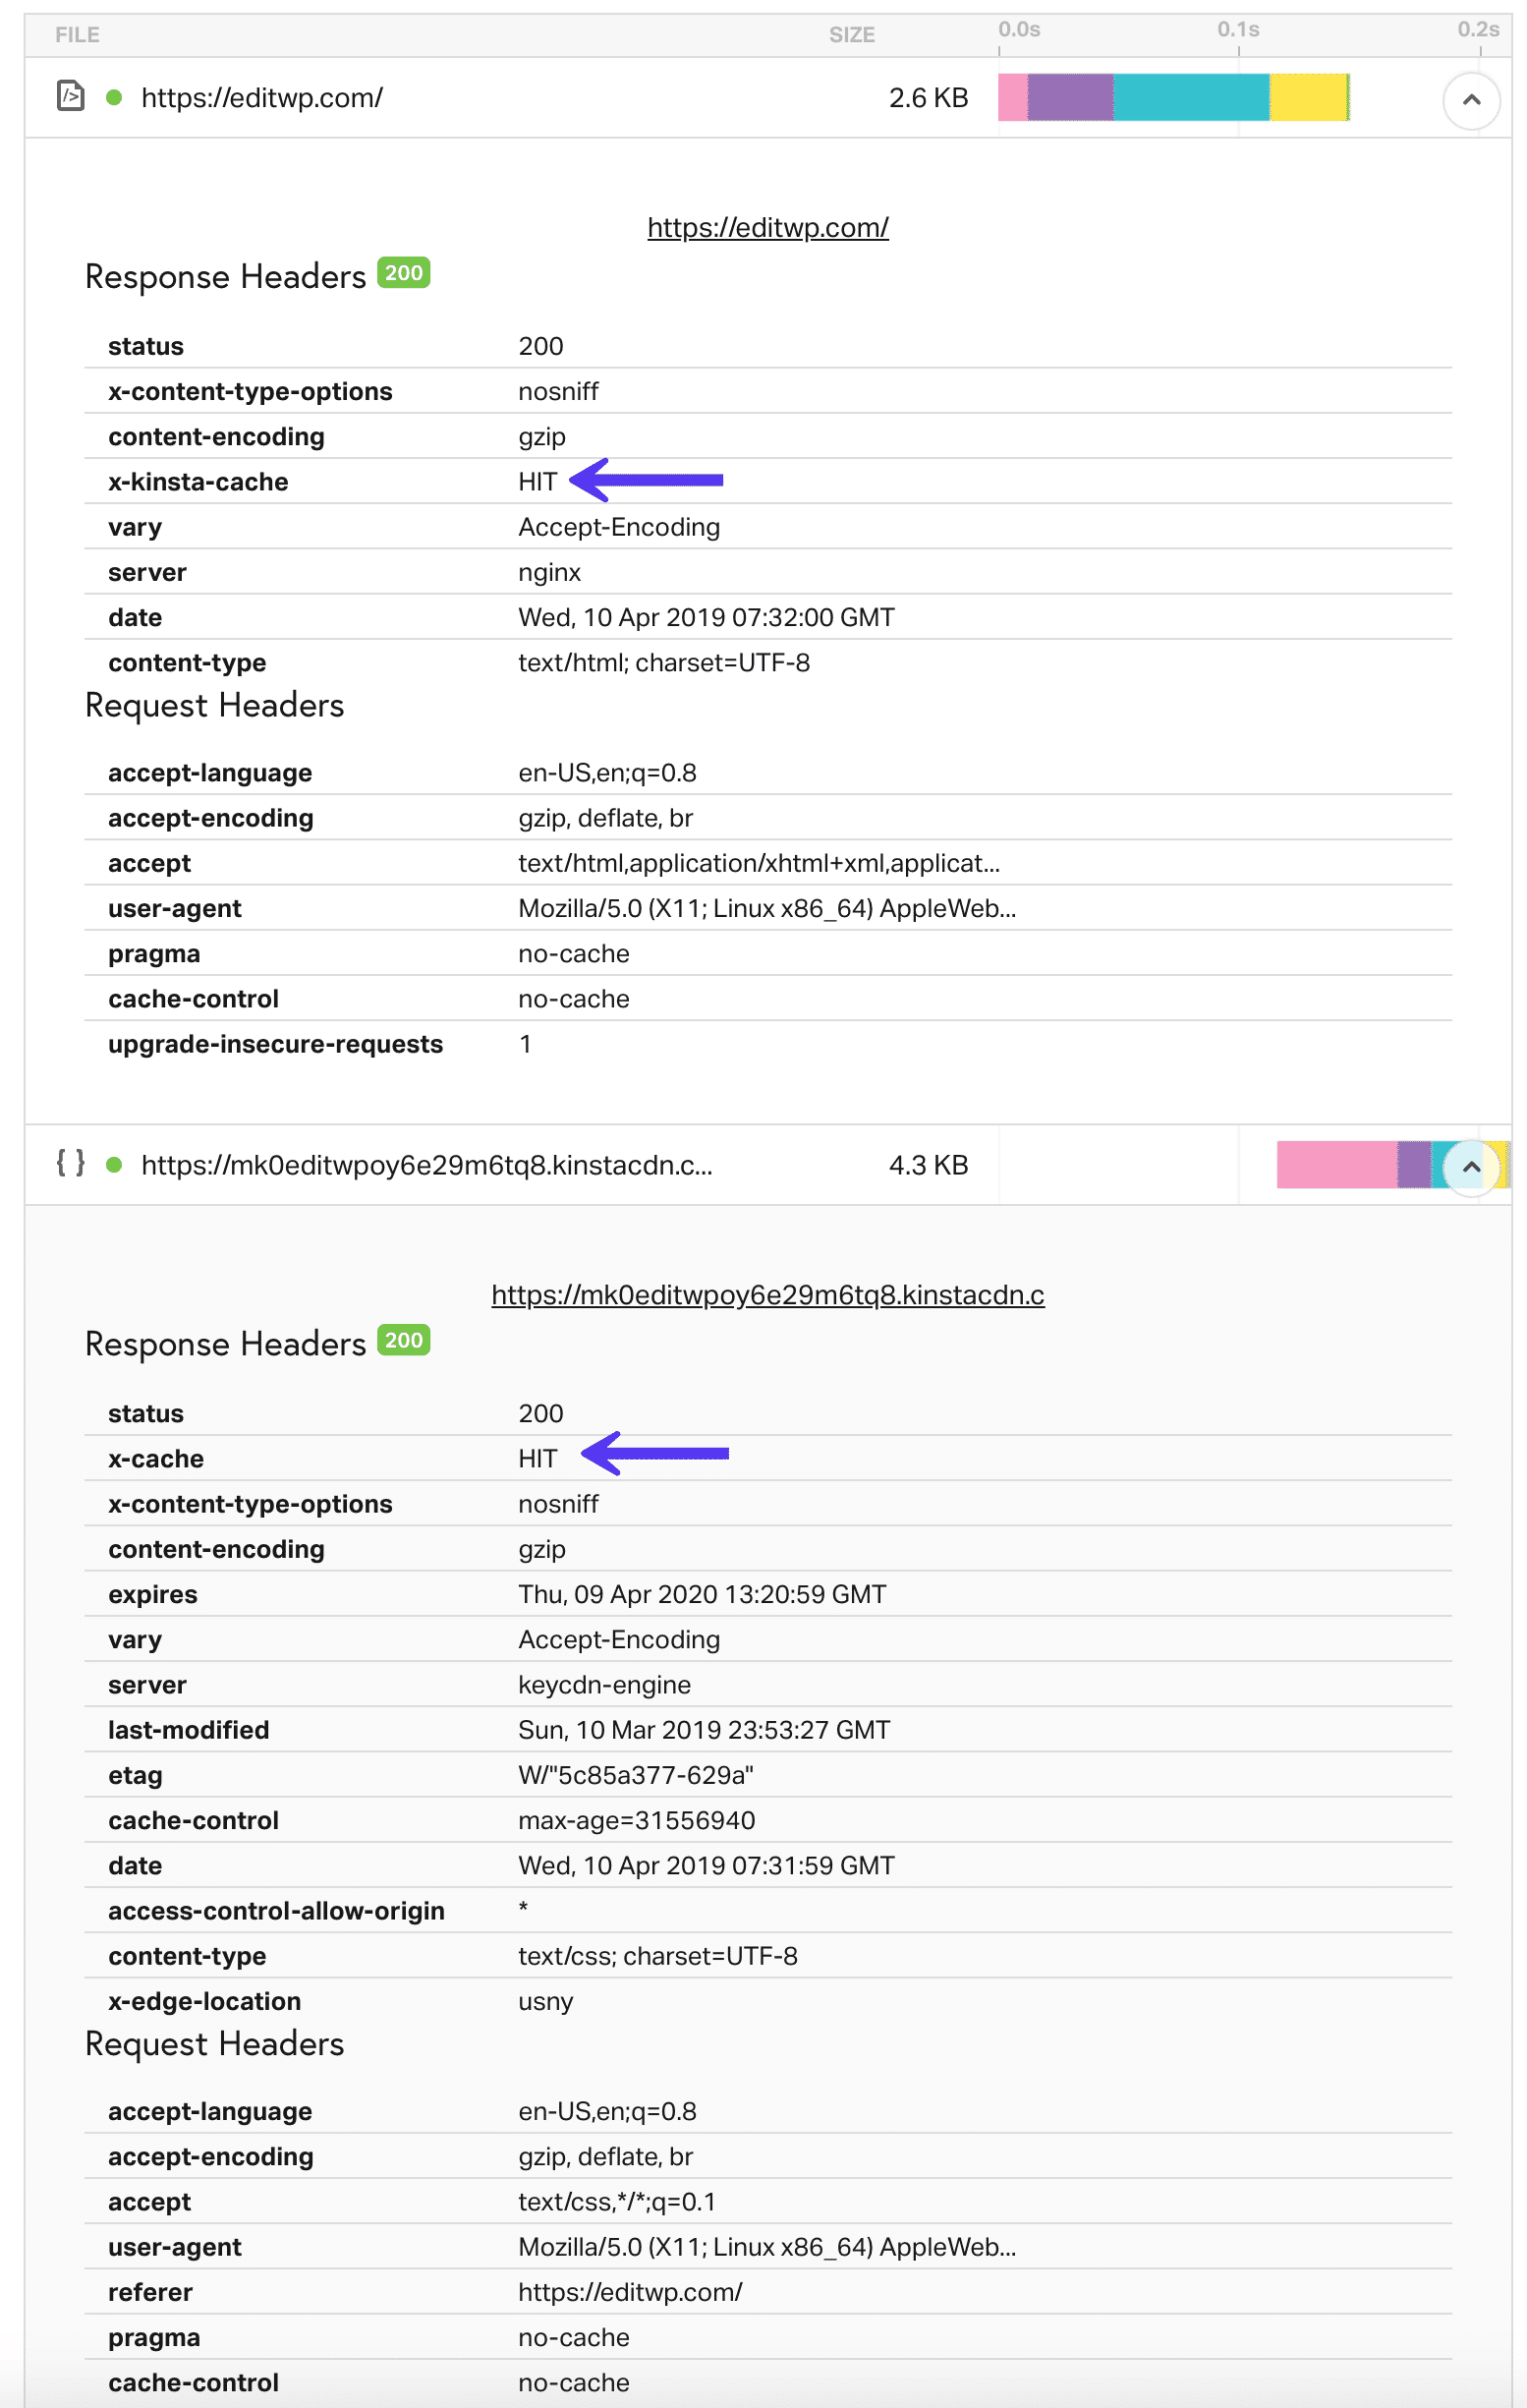
It’s also possible that your WordPress host will register a HIT with cache before your CDN. You can quickly scan down the test and look for the large yellow bar. This indicates TTFB (wait time), which is what spikes really high when a page or asset isn’t delivered from cache.
Why does this matter so much? Because if you look at our speed test before and after, the site that loaded entirely from cache was over 50% faster. And this was on our small development site. On larger sites, the percentage will be even bigger. This is why it’s vital that you understand how to speed test your website properly.
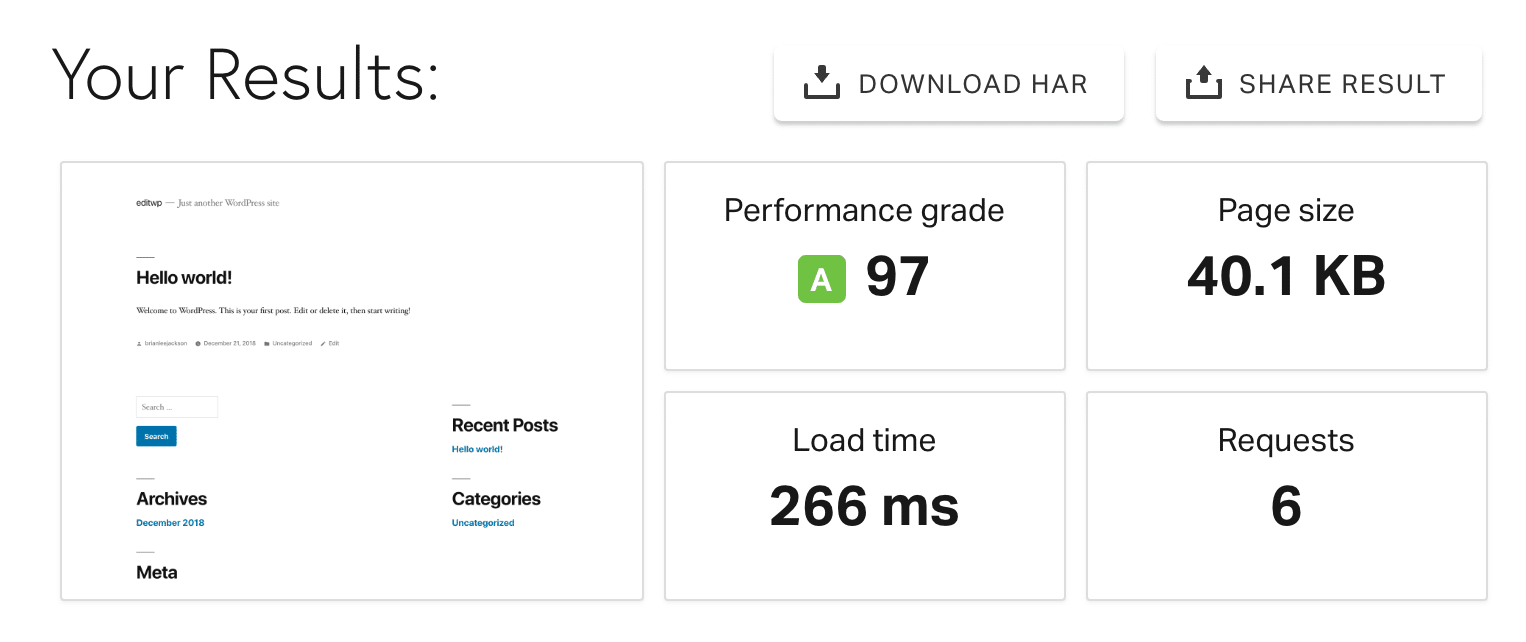
Besides the requests to your hosting provider and CDN, you will most likely also have external requests to things such as Facebook, Google Analytics, Google Fonts, etc. Troubleshooting these is an issue for another day. 😉 Check out our post on how to identify and analyze external services on your WordPress site, our ultimate Pingdom guide, and our in-depth guide on how to change fonts in WordPress.
Best Website Speed Test Tools
Now it’s time to dive into all the different website speed test tools you can use. What’s the optimal load time that you should be aiming for? Well, the faster the better, but most experts suggest that around two seconds or less is a good target. Remember too that there is a difference between perceived performance and actual performance.
One of the most important rules when it comes to website speed testing is to pick one tool and stick with it. Each has its own set of different metrics, and therefore, you can’t directly compare one tool’s test results to another. There is no right or wrong tool; you should simply focus on the one you prefer to help you make improvements.
Gary Illyes, Webmaster Trends Analyst from Google, sums it up well:
Each tool has a set of different metrics but each metric on its own makes perfect sense to improve. No tool is perfect and normally I'd tell you which one is the closest, but in this case is really about picking one that you like.
— Gary 鯨理/경리 Illyes (so official, trust me) (@methode) July 12, 2018
1.Pingdom
Pingdom is a market-leading website monitoring service, best known for its free website speed testing tool. The speed testing tool displays all of your site’s requests in a waterfall view. You can filter by load order, file size, and load times, giving you different perspectives for identifying potential improvements. It also lists total requests, load time, and page size.
It has gained popularity over the years due to the fact that it is super easy to use, especially when compared to similar speed test tools. For beginners, Pingdom can be a great way to start.
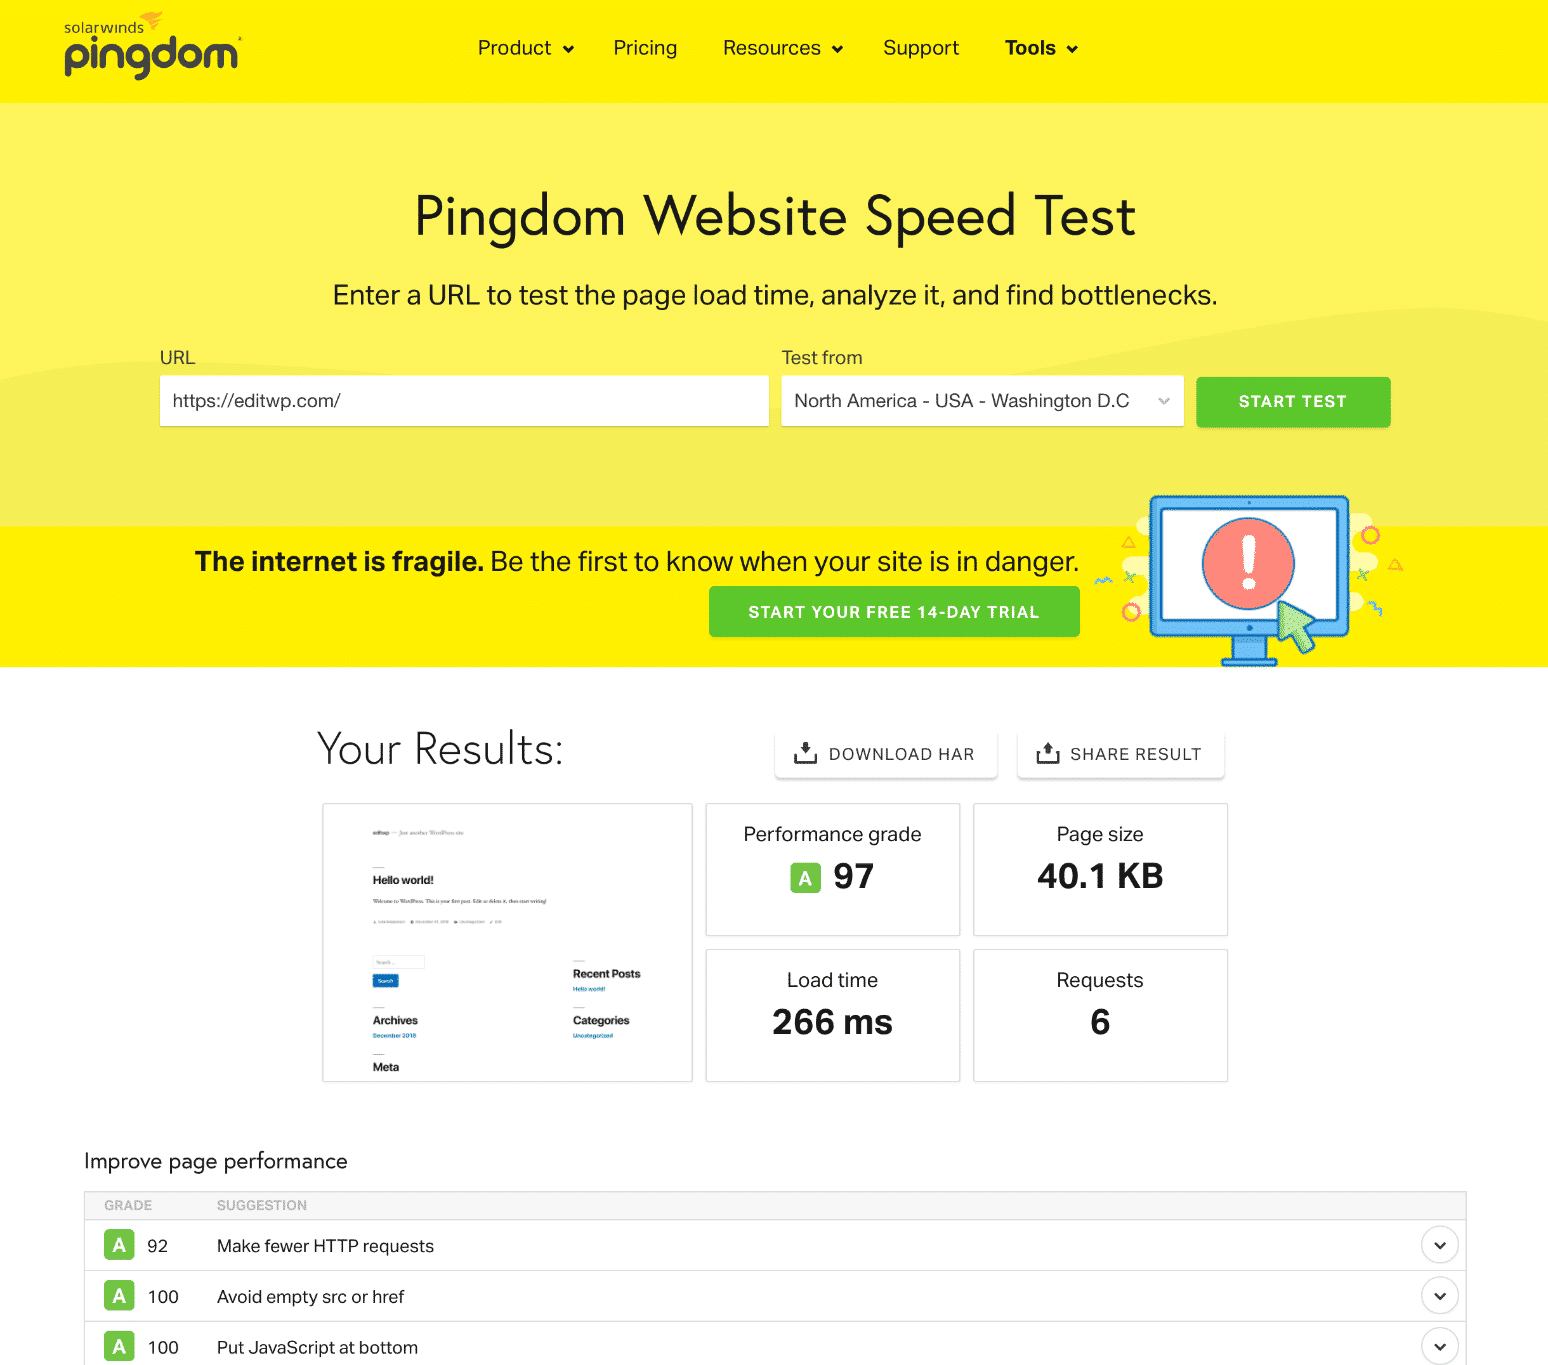
Pingdom also gives you a speed performance rating, scored out of 100. This rating is broken down into twelve criteria, with each given an individual score. Again, this is helpful for identifying the “quick wins” you can target to make instant, tangible improvements to your site’s speed. It’s possible to score as high as 100. However, don’t obsess too much over scores, as they don’t matter as much as simply making improvements on your site to speed it up.
Pingdom stores the results of all tests performed on your website, allowing you to historically track speed improvements over time.
2. Google PageSpeed Insights
Google has said since 2010 that page speed is an important ranking factor for SEO. To help you improve your site’s speed, Google has its very own speed testing tool, Google PageSpeed Insights, which measures the performance of a page for mobile devices and desktop devices.
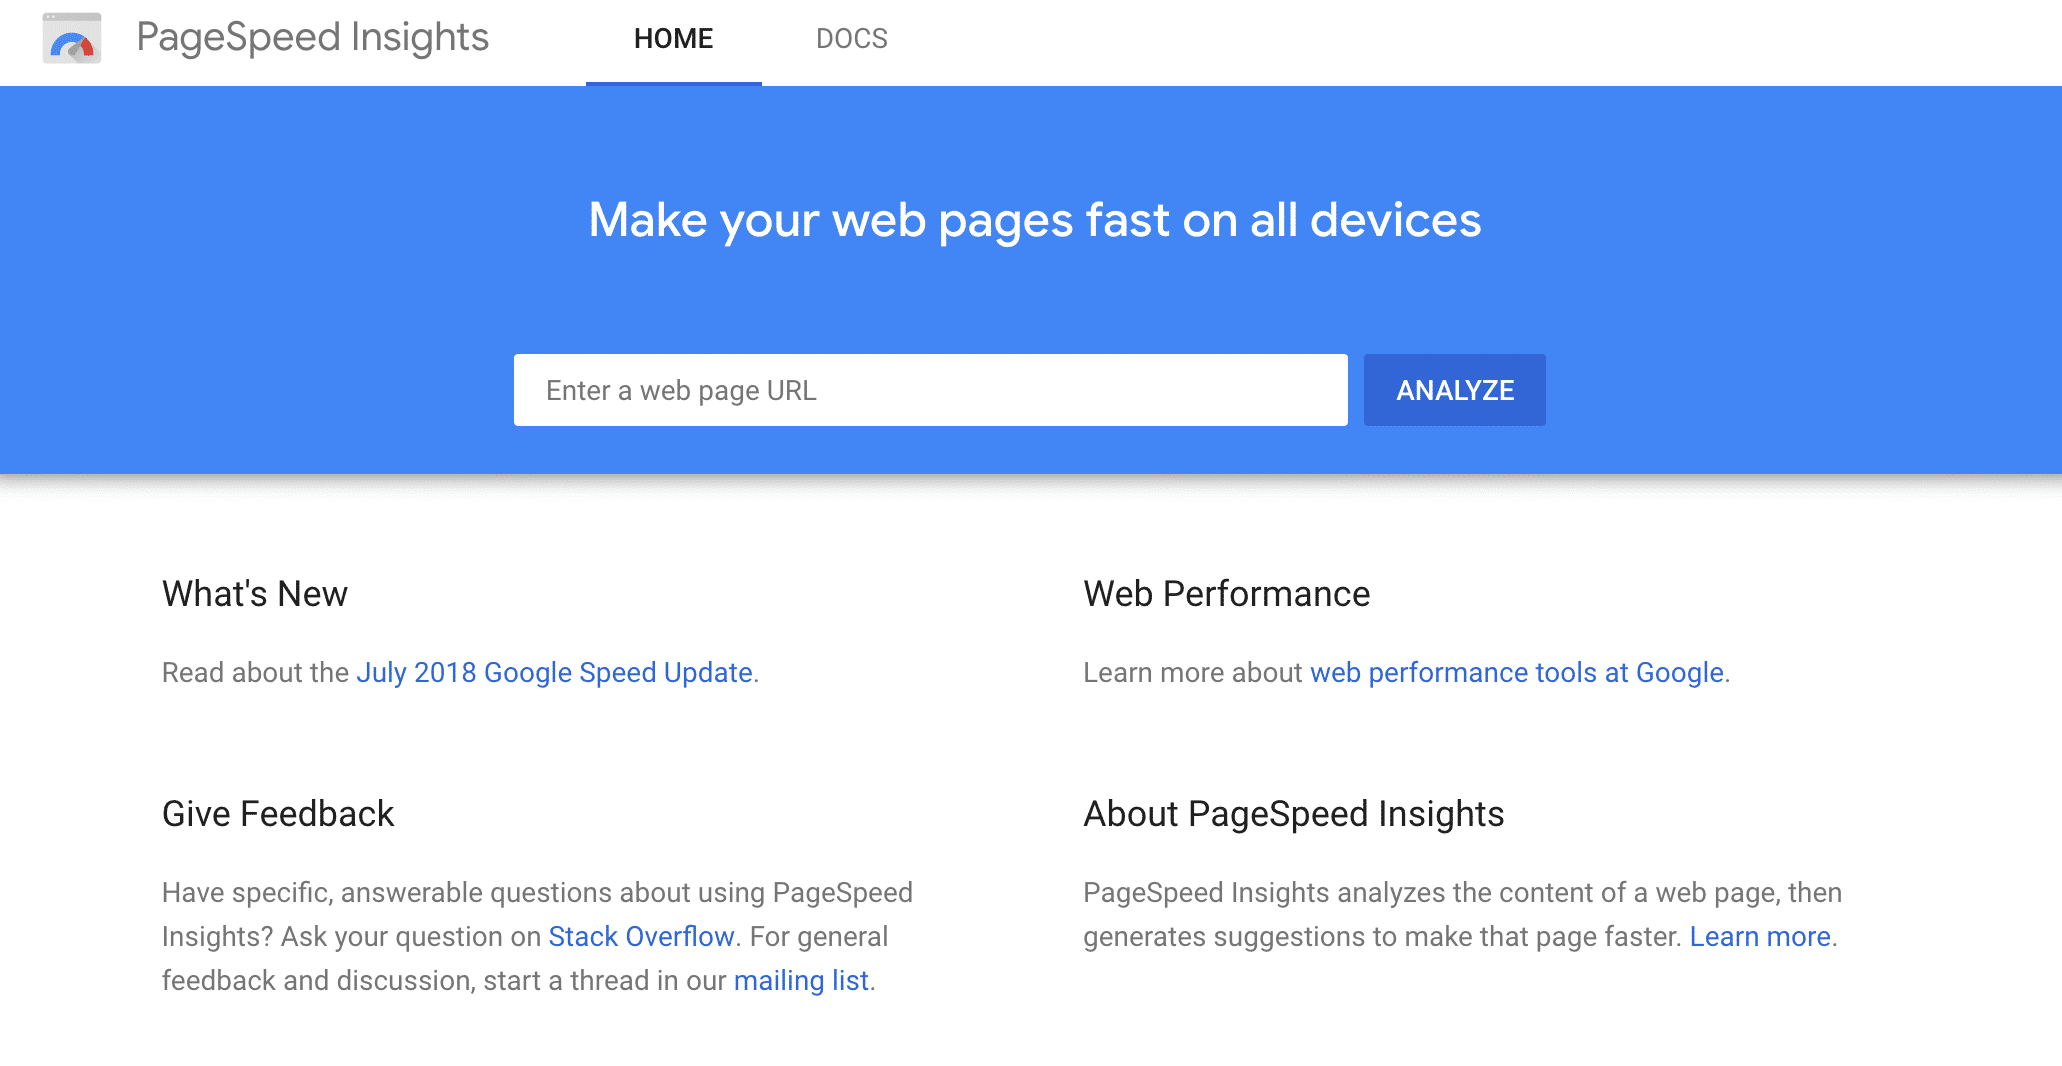
PageSpeed scores range from 0 to 100 points, and they’re based on Lighthouse. A higher score is better; a score of 85 or above indicates that the page is performing well. The report page gives you a useful breakdown of the steps you can take to improve performance. PageSpeed Insights also provides you with additional user experience suggestions for mobile devices. Check out our thoughts on whether or not it’s possible to achieve a 100/100 score on PageSpeed Insights.
If you care about elevating your website to the top of the SERPs, it pays to listen to what Google recommends. We also have a walk-through on how to fix that stubborn leverage browser caching warning.
3. Google Analytics Site Speed
Google Analytics also has the ability to measure site speed. This exists in your GA dashboard under the Behavior menu. It captures information via a snippet of code you’d include in your web pages.
Their site speed reports measure three aspects of latency:
- Page-load time for a sample of pageviews on your site
- Execution speed or load time of any discrete hit, event, or user interaction that you want to track
- How quickly the browser parses the document and makes it available for user interaction
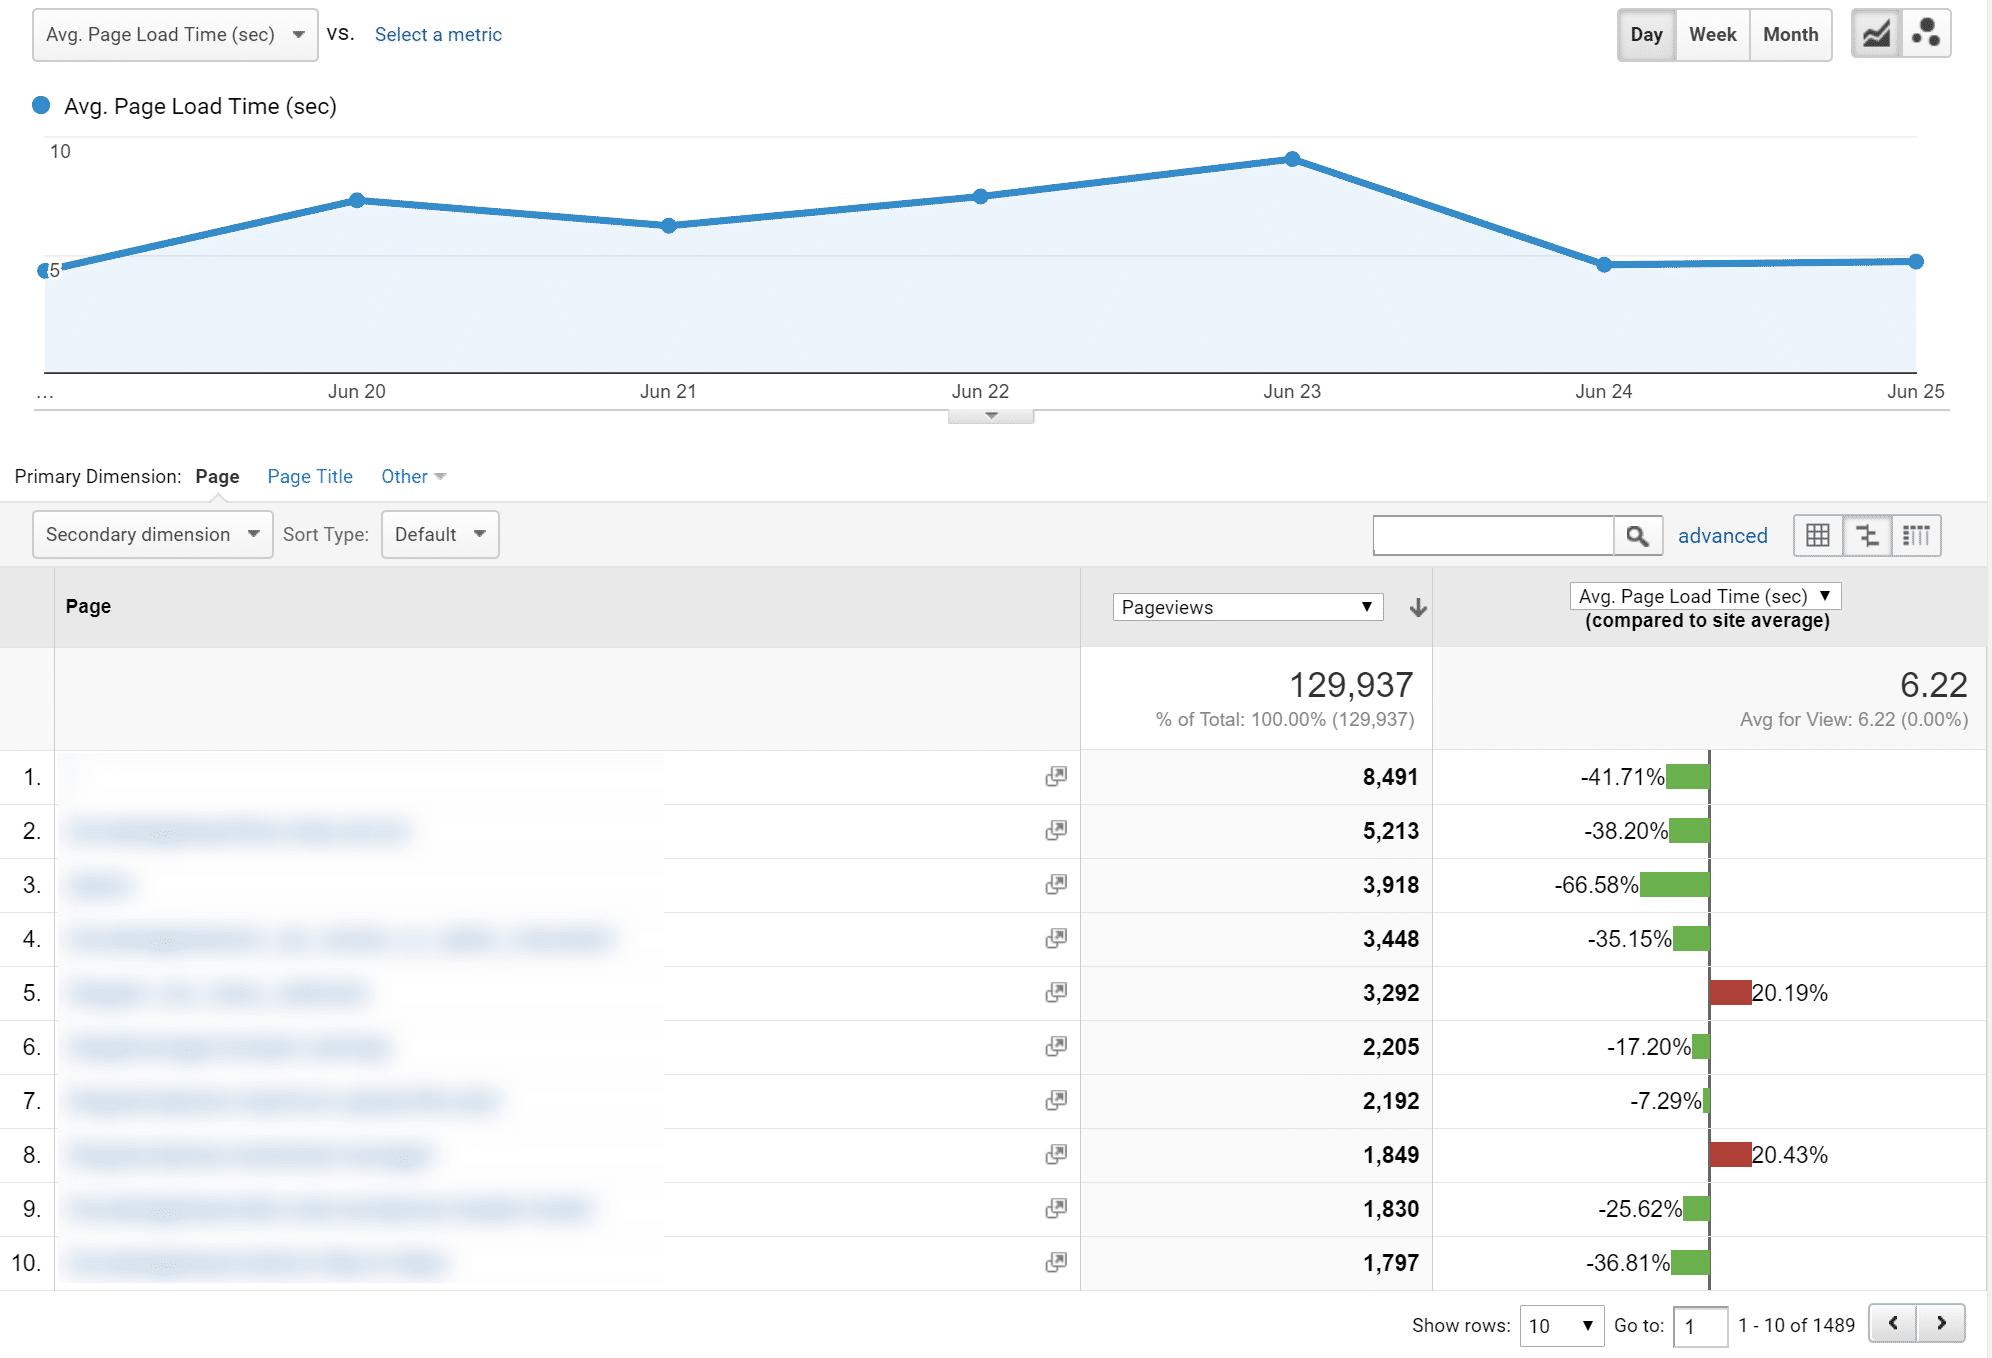
While this can be helpful as an overall comparison, we generally don’t recommend using this as your speed test tool — we’ve found the data isn’t always accurate or accompanied by a clear depiction of what’s really happening on the site. Why? Because it’s collected from a random sampling of data.
Joe Christopher has a great write-up on the problem with site speed accuracy in Google Analytics. Tedd Rodman has also reported on frequent errors that can throw off the site speed averages substantially. We recommend using one of the other speed test tools mentioned in this post.
4. WebPageTest
WebPageTest was created by Patrick Meenan, a Chrome engineer at Google. It’s an open source project that allows you to run a free website speed test from multiple locations around the globe, using real browsers (IE, Chrome, etc.). For you more advanced users needing to get additional data from your speed tests, this is a great tool.
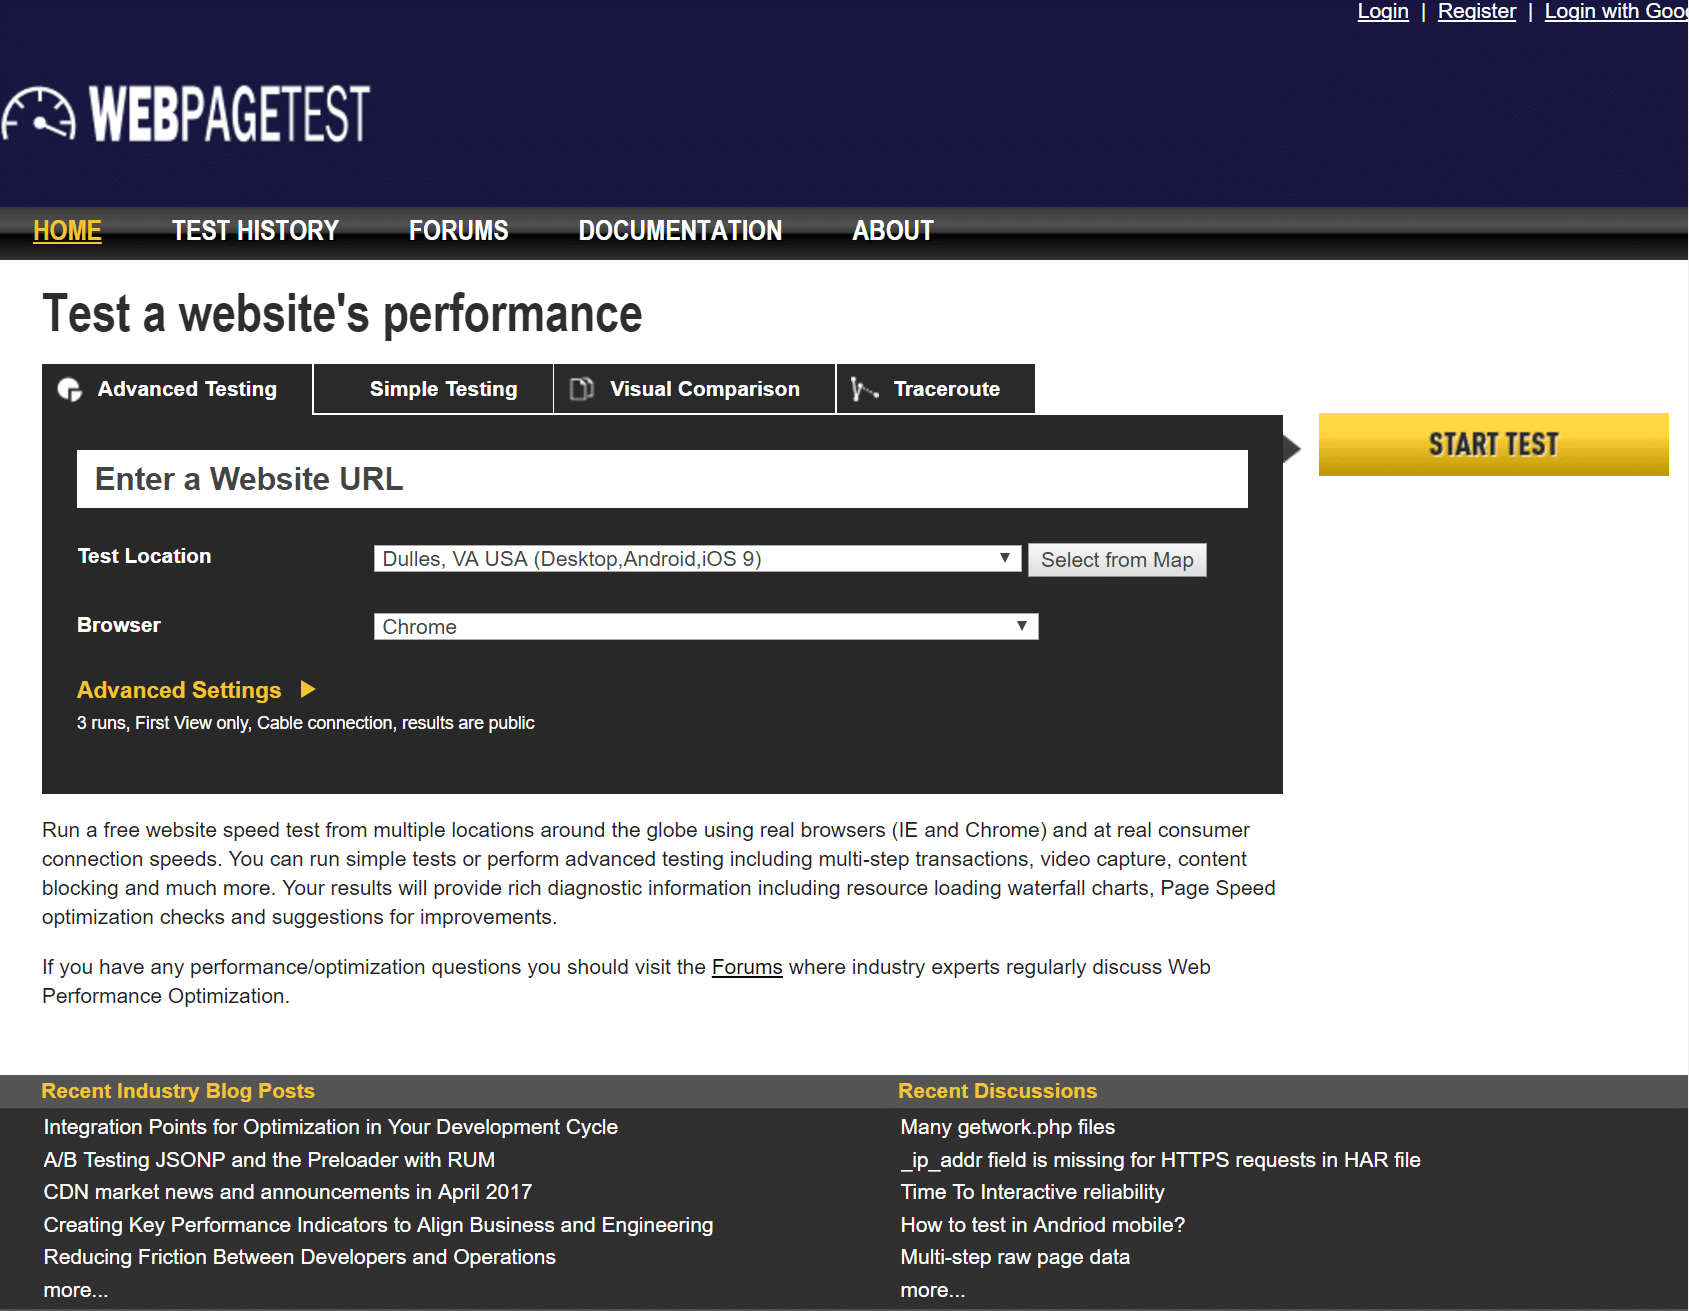
WebPageTest allows you to perform advanced tests, including multi-step transactions, video capture, content blocking, comparison of first view verses repeat view, changes in the connection speed, and much more. Their waterfall charts and resource loading reports provide lots of additional information regarding improvements that can be made across your site.
5. GTmetrix
GTmetrix is another popular speed analysis tool and arguably the best-known of all the Pingdom alternatives. It’s easy to use, so beginners can pick it up quite fast. The tool provides comprehensive analysis by combining the performance and recommendations provided by Google PageSpeed Insights and YSlow. This means that GTmetrix is effectively a one-stop shop for all your speed optimization needs.
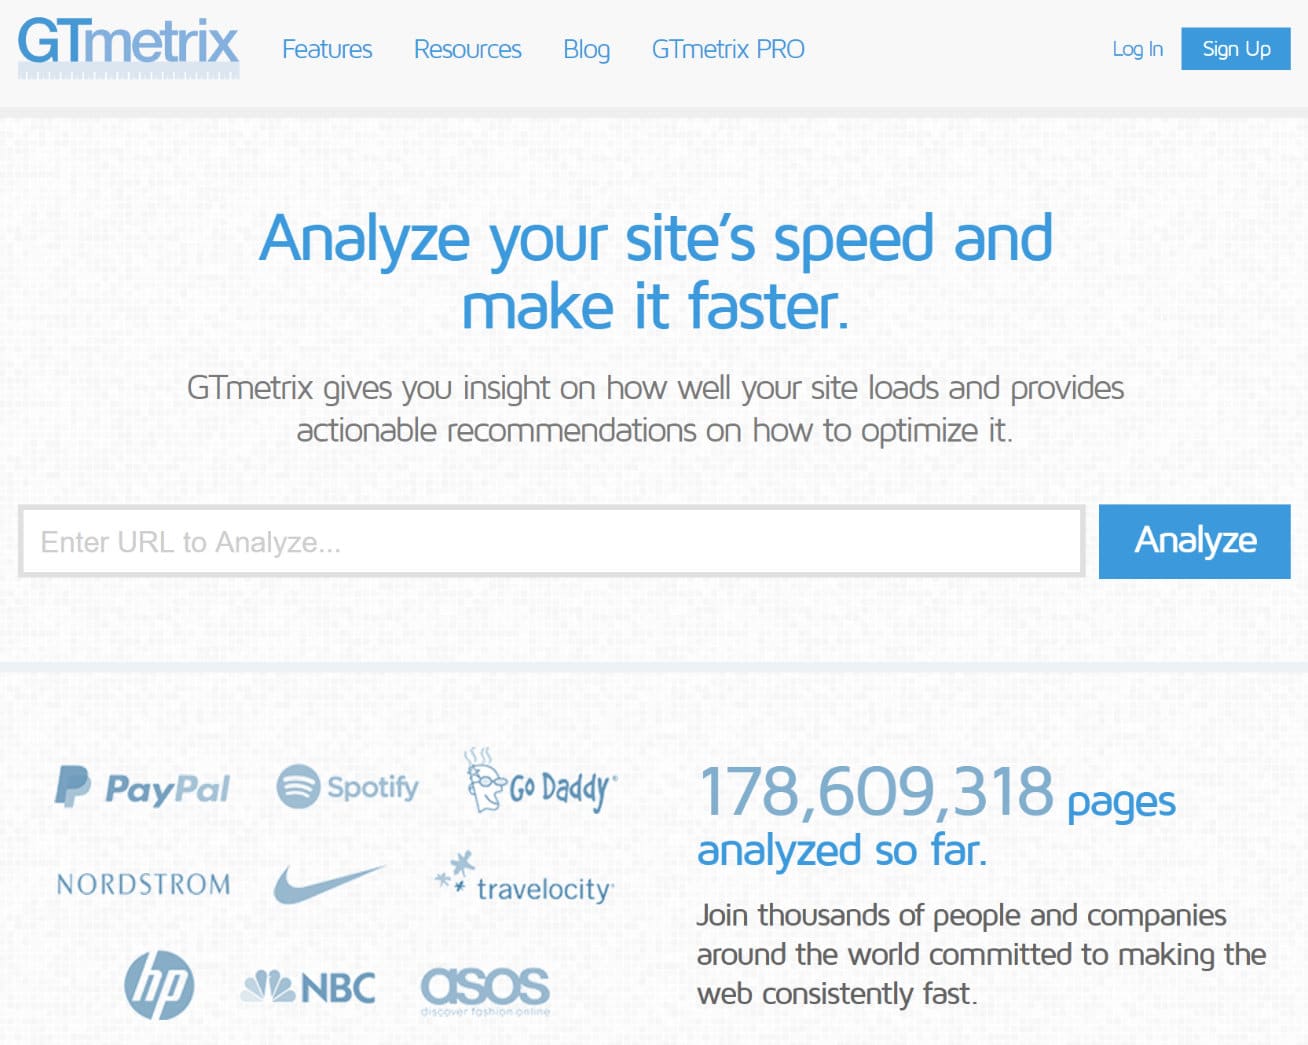
To ensure that your top-level data is easier to digest, GTmetrix displays a summary at the top of the page, listing your total page load time, page size, and number of requests. The tool also displays a list of your requests in a waterfall chart, enabling you to identify problem areas and bottlenecks with ease. The waterfall chart can be downloaded, too, so that you can perform further analysis offline.
What’s more, you can create a free account for the tool, which allows you to record the last 20 tests, compare historical data, and save pre-configured settings for testing locations, browsers, connection speeds, and more.
Make sure to also check out our in-depth guide where we dive into how to use the GTmetrix speed test tool.
.
6. KeyCDN Website Speed Test
KeyCDN’s free website speed test tool provides an incredibly fast and easy way to determine the overall speed of your WordPress site. The simple page speed test includes a waterfall breakdown and a website preview. You can select from 14 different test locations strategically located around the globe in order to better determine the overall download time of your assets from that physical region.
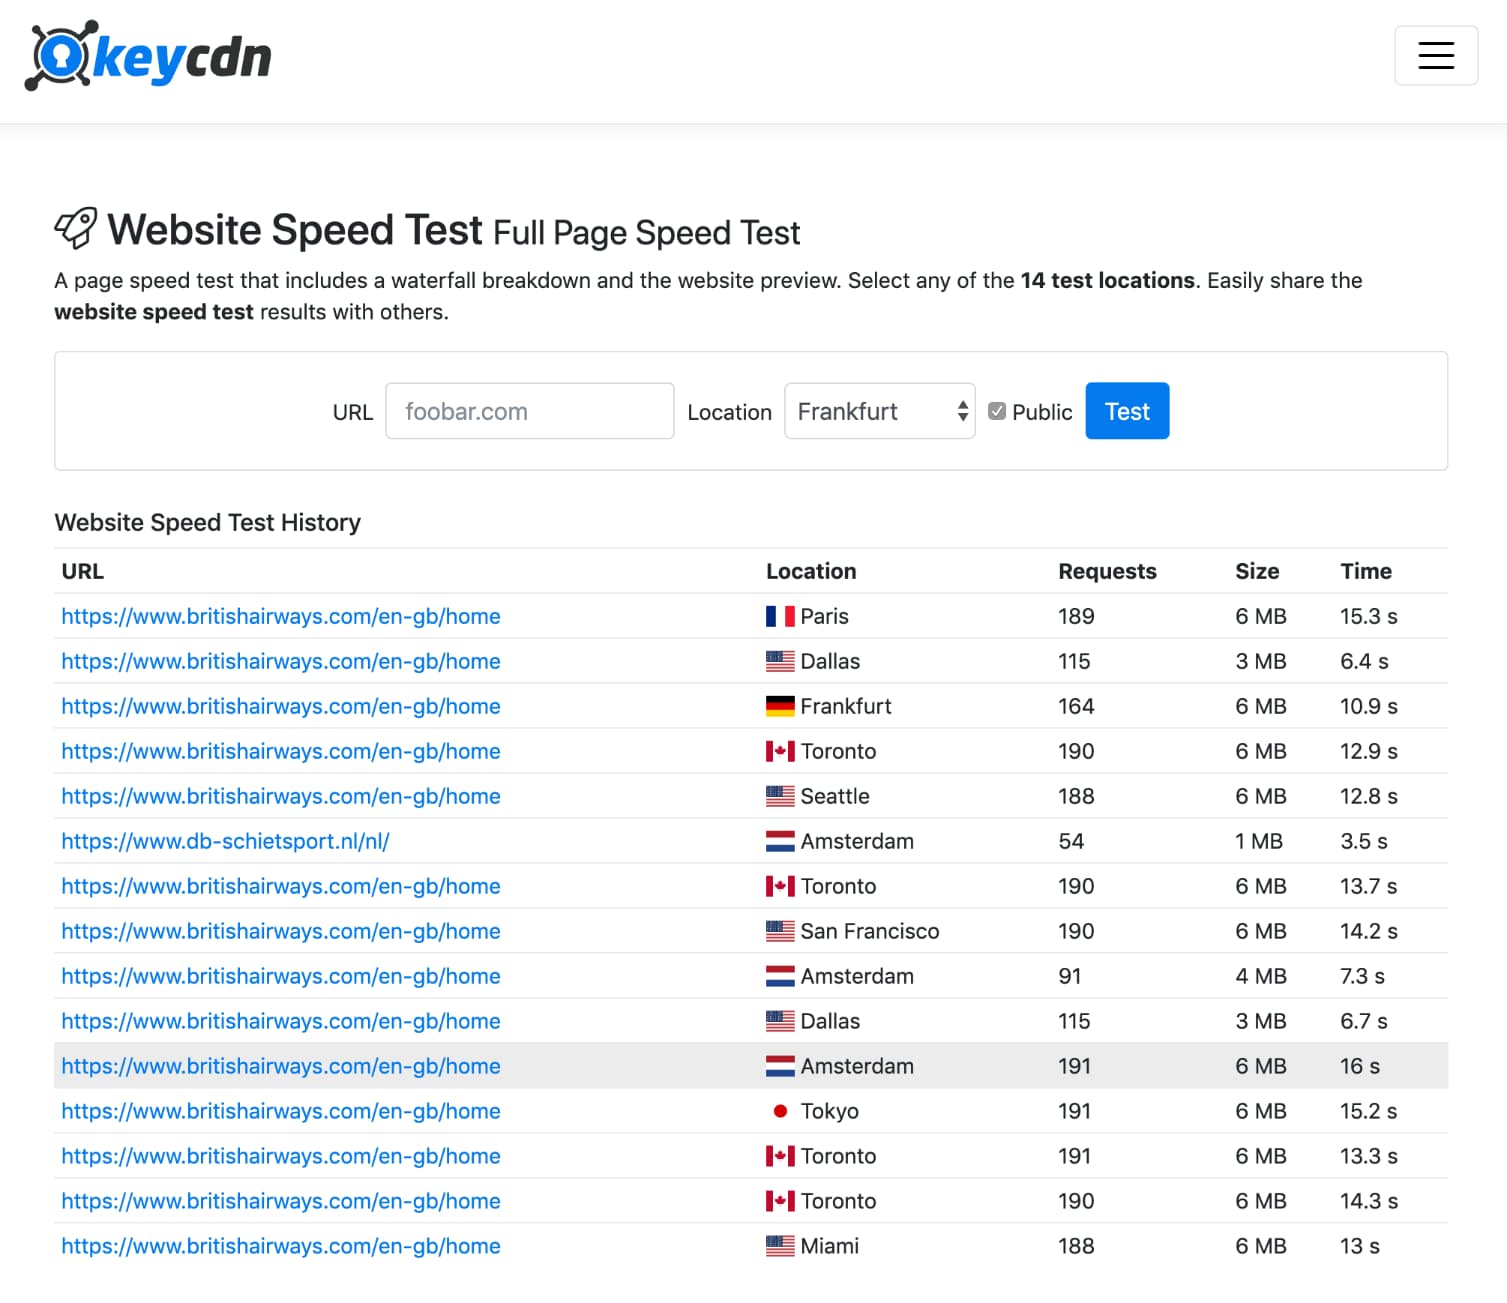
You can run both a private and public test, which you can then later share or bookmark for future reference. The breakdown report shows a great overview of the request methods (GET/POST), HTTP status codes (such as 200 OK or 404), file types, content size, wait/receive time, total download time, and the overall number of HTTP requests generated on your site.
KeyCDN also offers other free handy web performance testing tools such as Ping Test, HTTP/2 Test, HTTP Check, and Traceroute Tool.
7. DareBoost
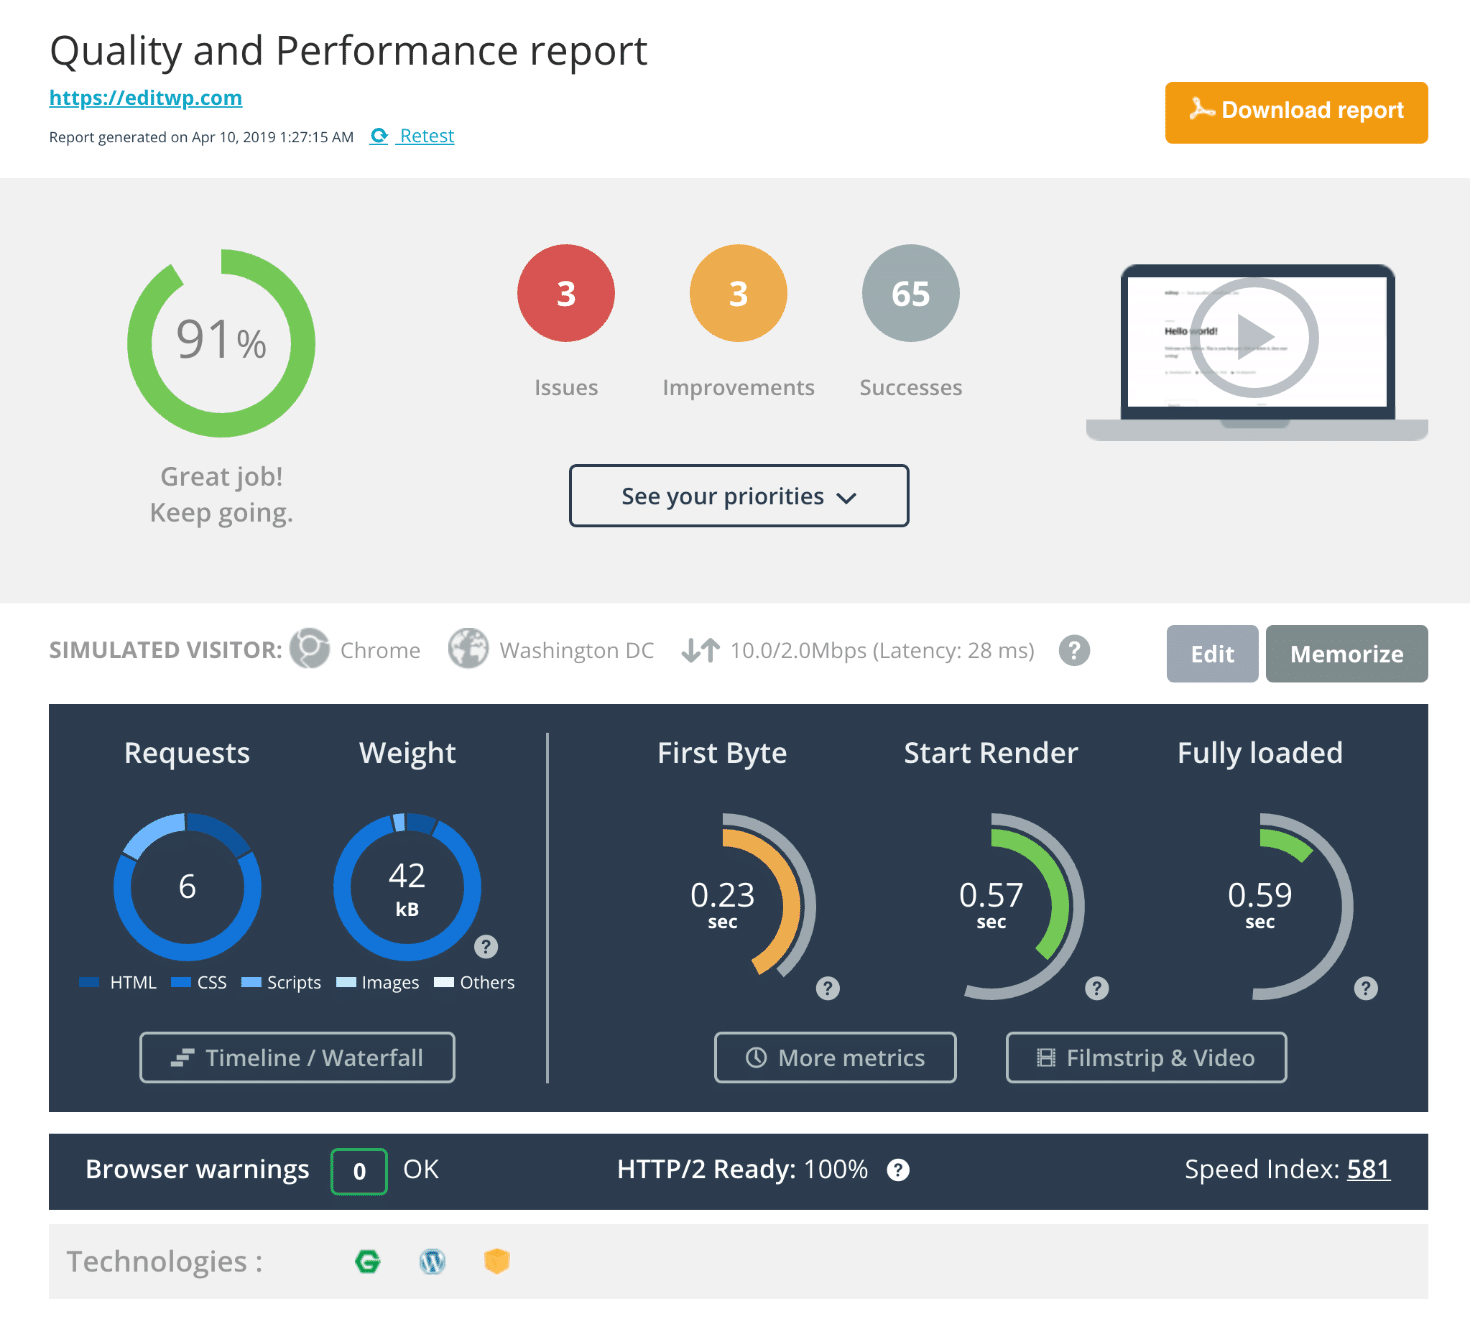
DareBoost is an all-in-one service for website speed testing, web performance monitoring, and website analysis (speed, SEO, quality, and security). And while they are primarily a premium service, you can use their website speed test tool for five free reports per month, though you’ll be missing a few advanced features that are only for paid customers. The free reports are actually pretty impressive!
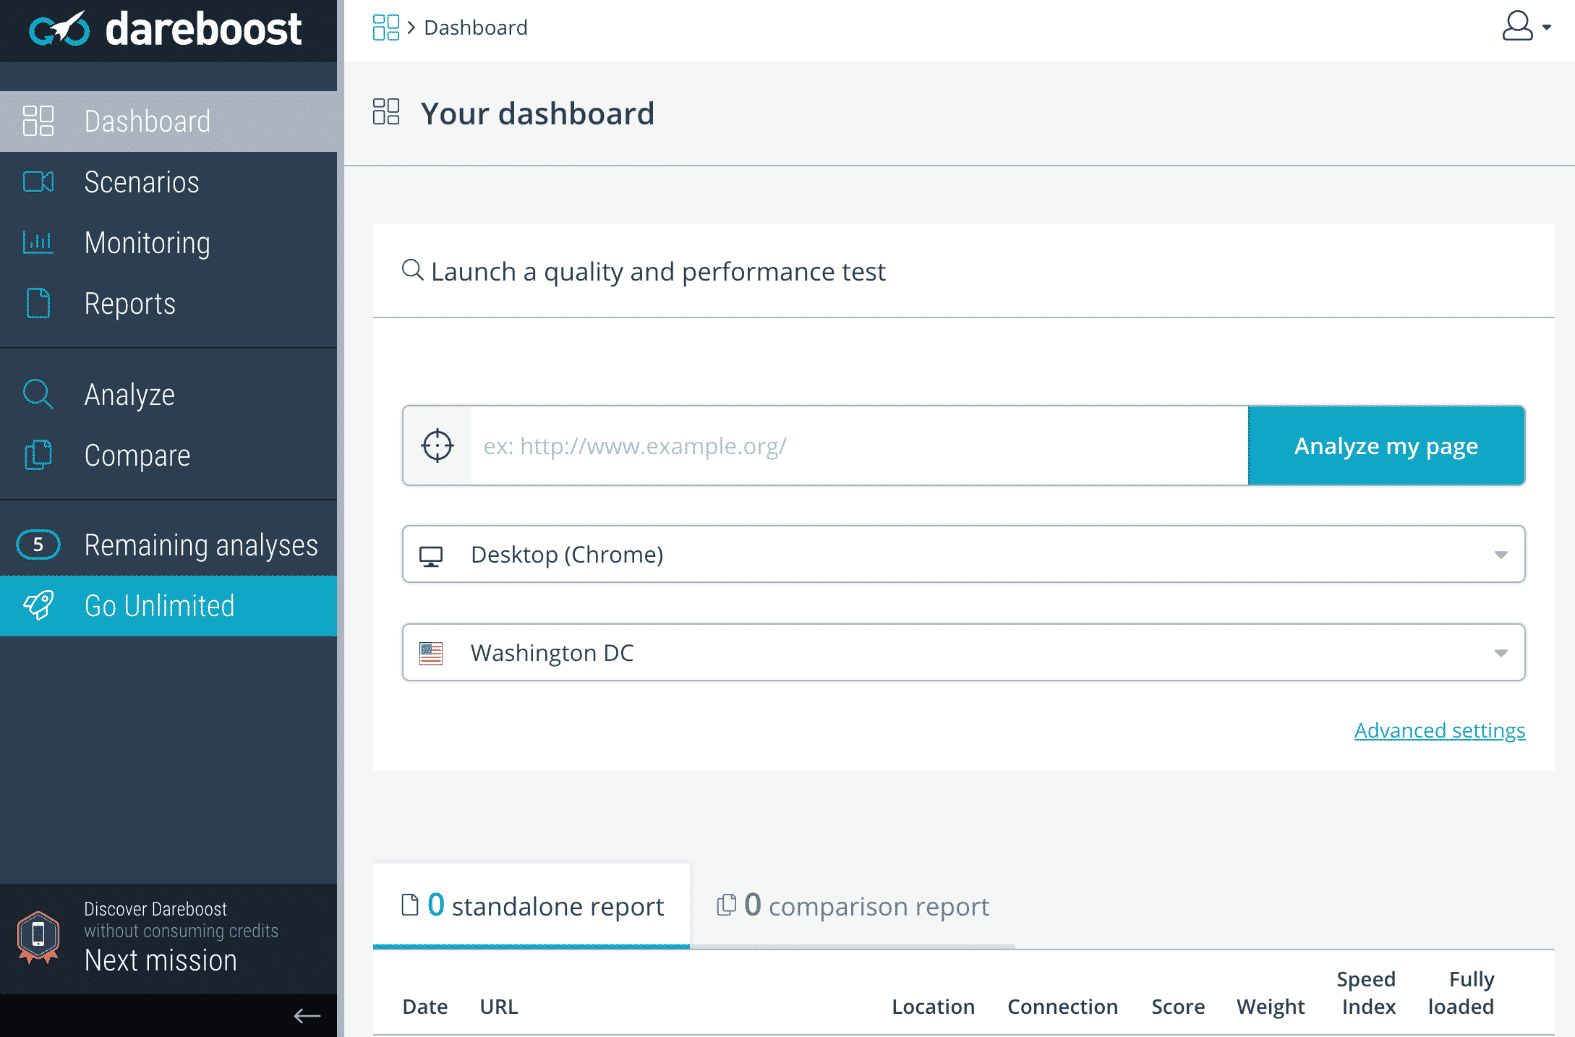
The DareBoost speed test report analyzes over 80 different data points across the following categories:
- Cache policy
- Number of requests
- Security
- Accessibility
- Compliance
- Quality
- jQuery
- Browser rendering
- Data amount
- SEO
You can quickly see where your WordPress site is struggling and needs work. The security reporting is also very unique when compared to the other tools we’ve mentioned — you can see things such as whether your website is exposed to clickjacking attack, whether you’re missing a content security policy header, and even information about your SSL certificate. Their design is pretty awesome, too!
If you need a report for your boss or agency, this might be a tool you want to check out.
8. Web Page Analyzer
The Web Page Analyzer is a highly recommended free tool for analyzing your site’s speed, size, and composition. The script calculates the size of individual elements and sums up each type of web page component. Based on these page characteristics, the script then offers advice on how to improve page load time.
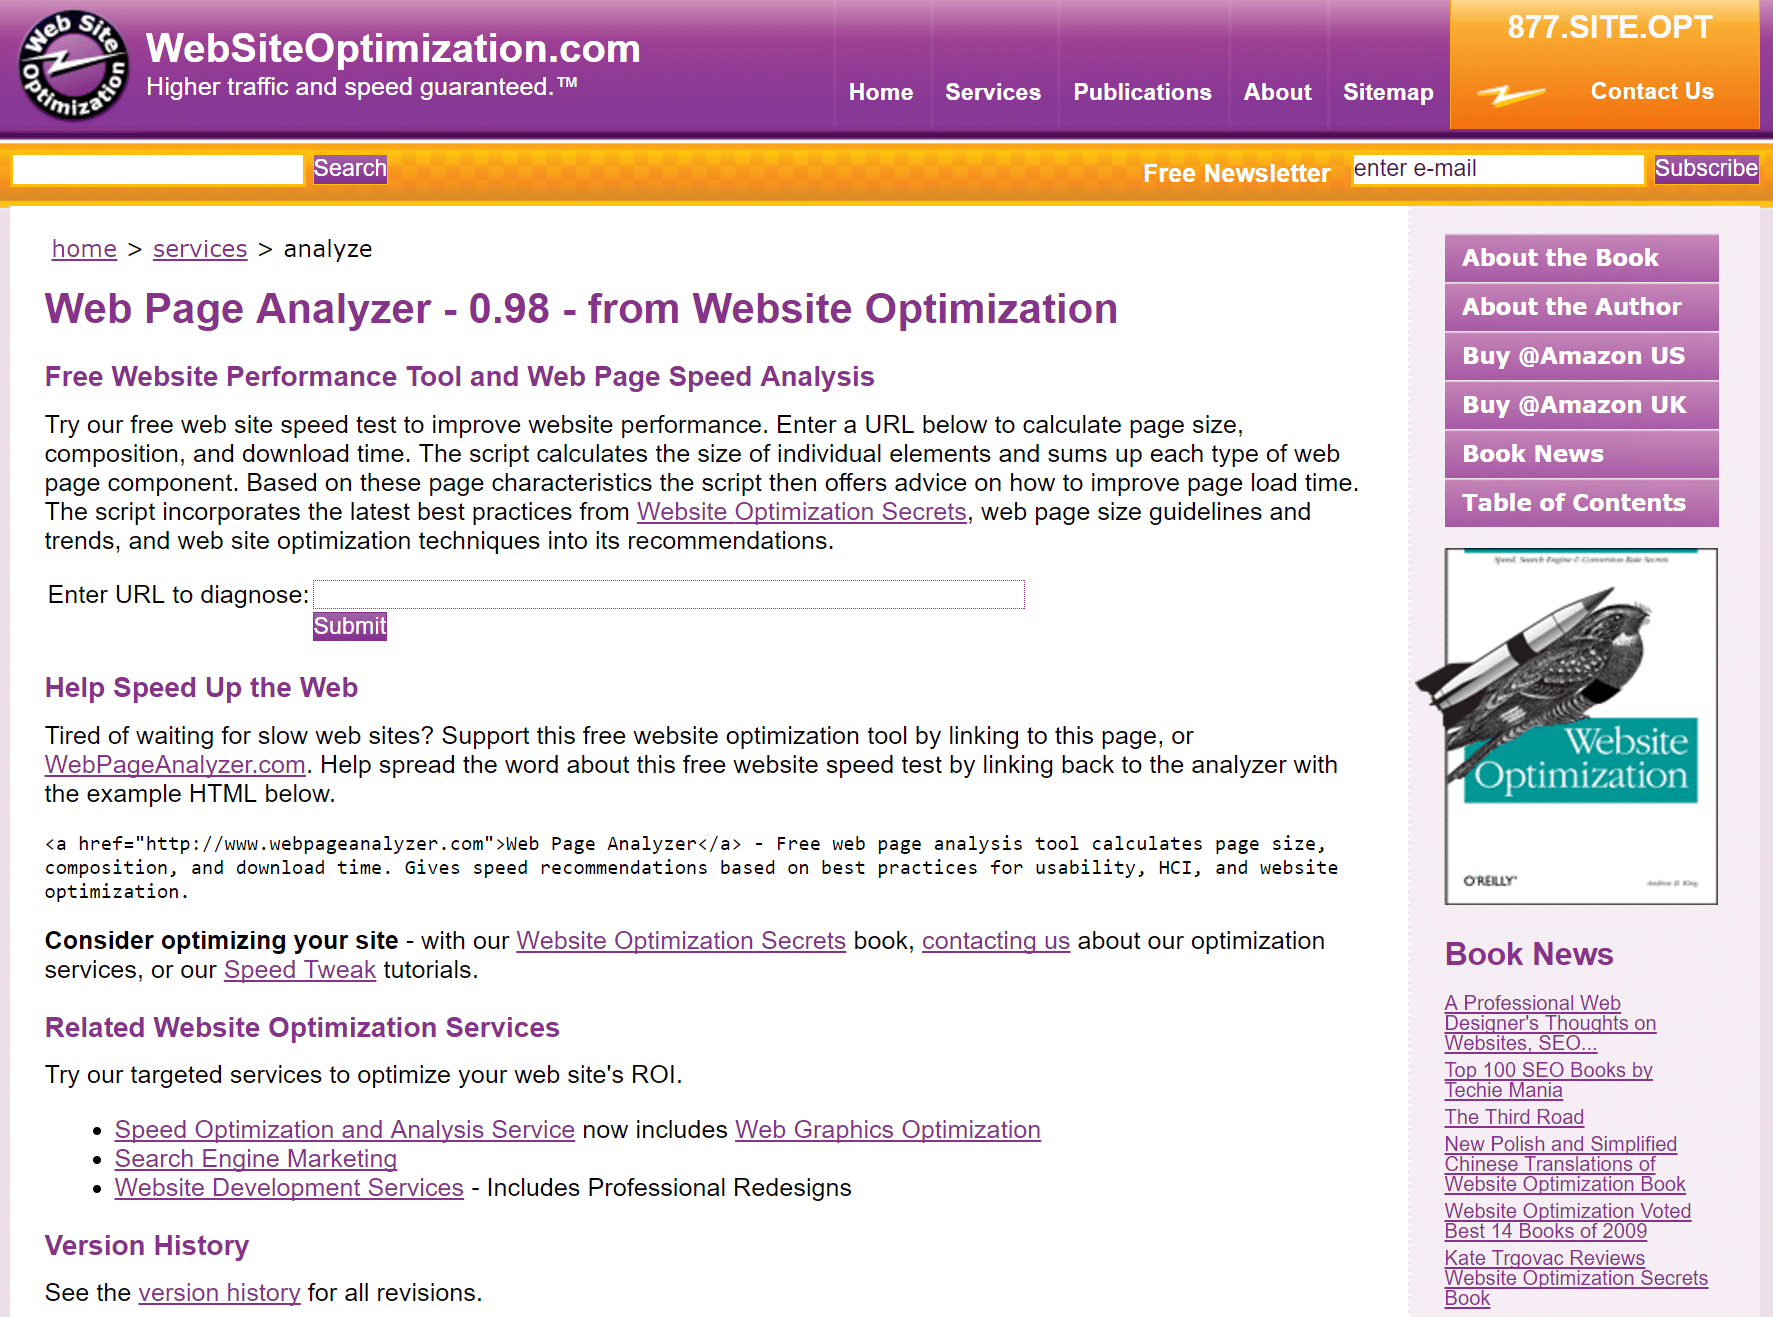
More specifically, the tool will tell you how long your website takes to load through different connection speeds. If you like your data detailed, the Web Page Analyzer tool breaks it down for you, displaying the size and a comment for each element. At the bottom of the analysis, the tool provides comments and recommendations on 11 specific aspects of your site’s performance, including the areas where you perform well. However, it appears this tool hasn’t been updated though for a while, so don’t expect things like HTTP/3 support
9. YSlow
Next up is Yahoo!’s page performance tool, YSlow. The tool requires installation as an add-on for your browser, but it’s completely free to use — and most popular web browsers are supported.
The Yahoo! team has identified 34 factors that impact a website’s speed. Unfortunately, only 23 can be tested quantitatively, and so the tool focuses its analysis on these areas. The YSlow website lists these 23 “rules” with extended details, which are well worth checking out.
With the analysis complete, YSlow will grade you for each area, scored from A to F. This makes it super easy to spot your weaker areas, which you can then target for the biggest steps forward in terms of site speed.
This used to be the most popular speed testing tool, but unfortunately, the YSlow project is no longer maintained. Their last commit was years ago, and there are over 100 open issues on their GitHub page. However, there is still some useful information that the extension can provide, though we would recommend using a newer and more actively supported website speed test tool.
10. Chrome DevTools
The Chrome DevTools network panel comes as part of Chrome and other Chromium-based browsers. This is a very popular tool among developers as it’s easily accessible and a great option for local debugging and testing. You can easily launch the network panel in Chrome by pressing Command+Option+I (Mac) or Control+Shift+I (Windows and Linux). You can then generate a waterfall analysis of your site and dig into the performance of each of your assets.
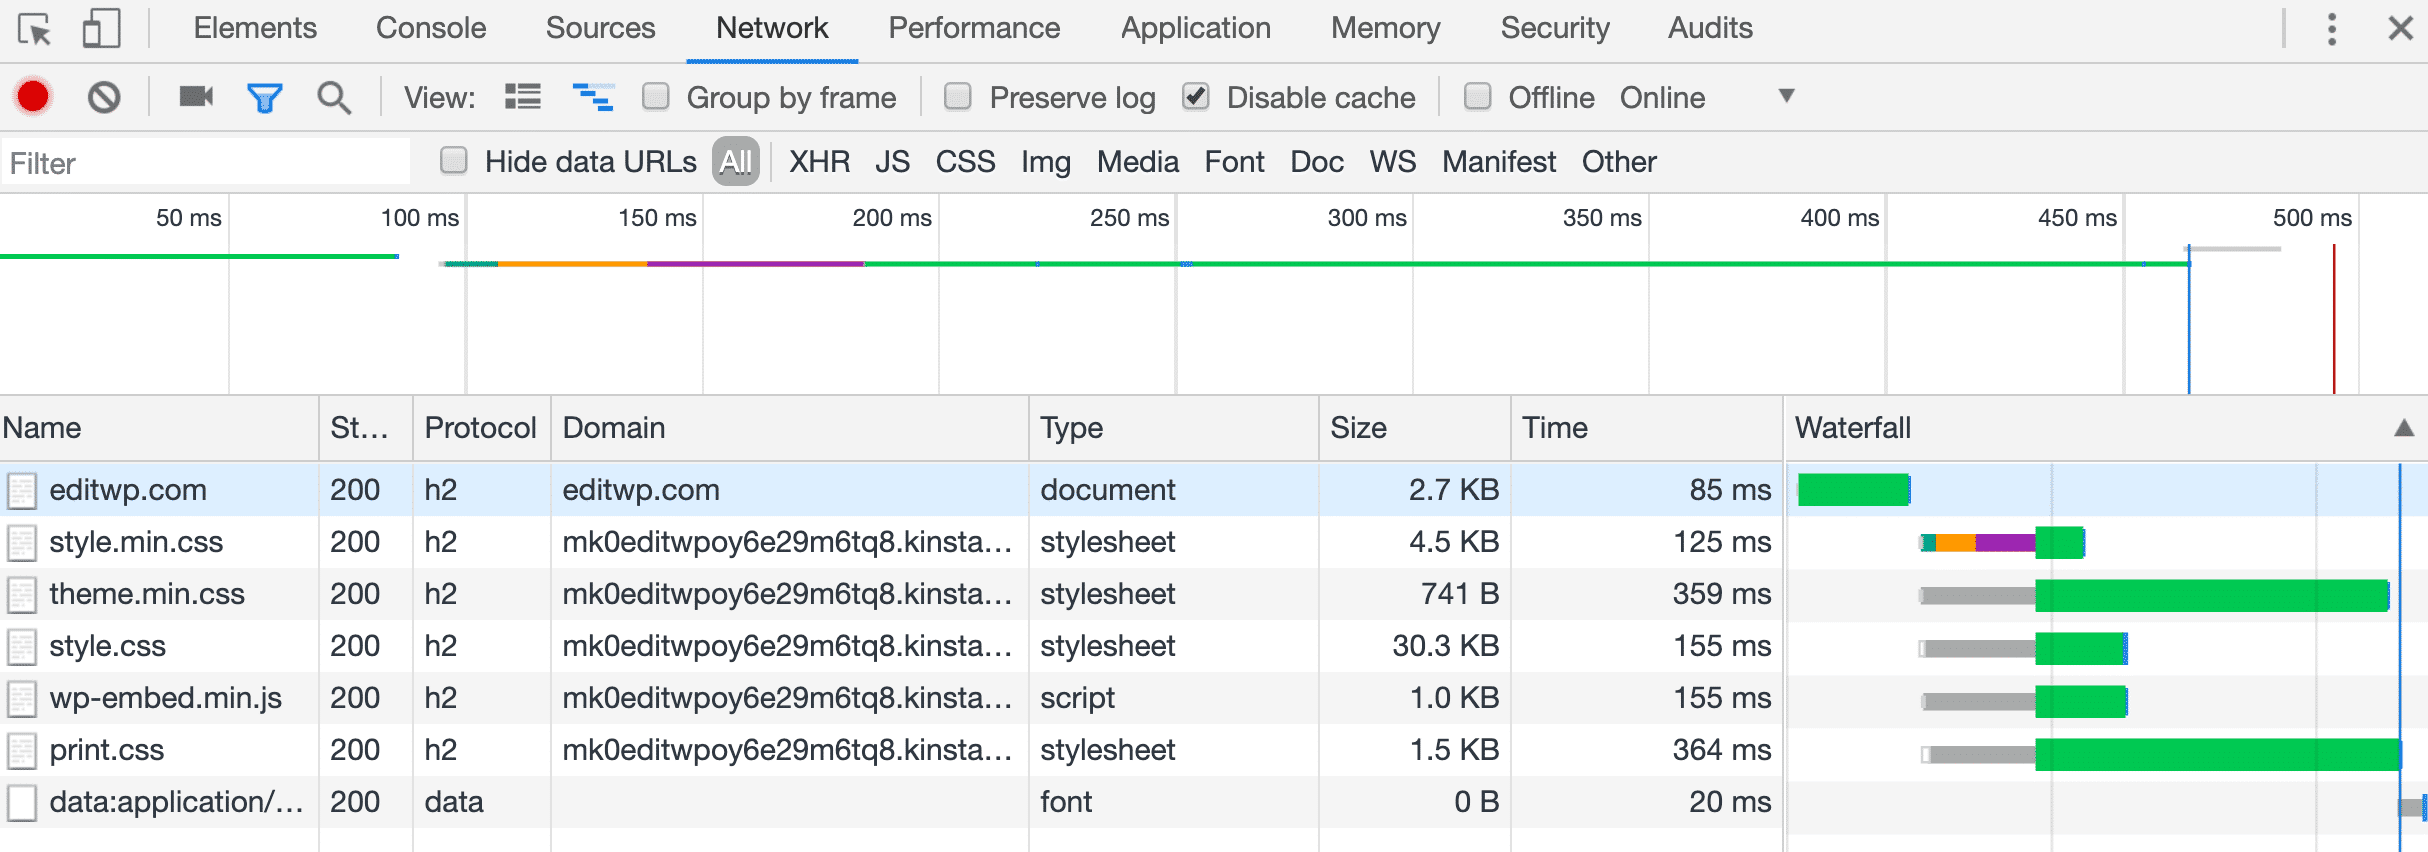
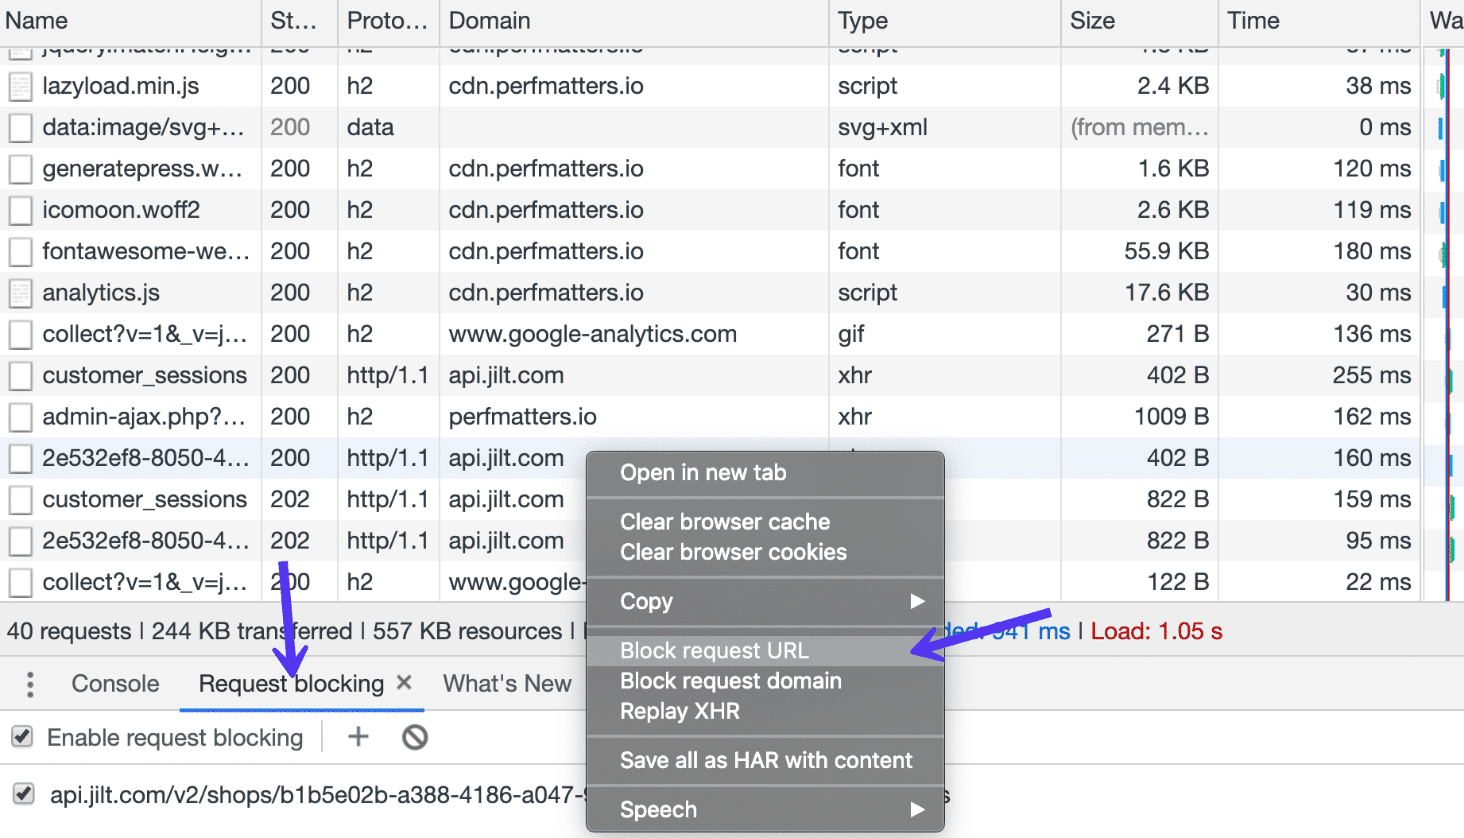
Another great feature added in Chrome 60 is the ability to block requests. This can be very useful when trying to determine how much overhead a third-party service or script is having on your site.
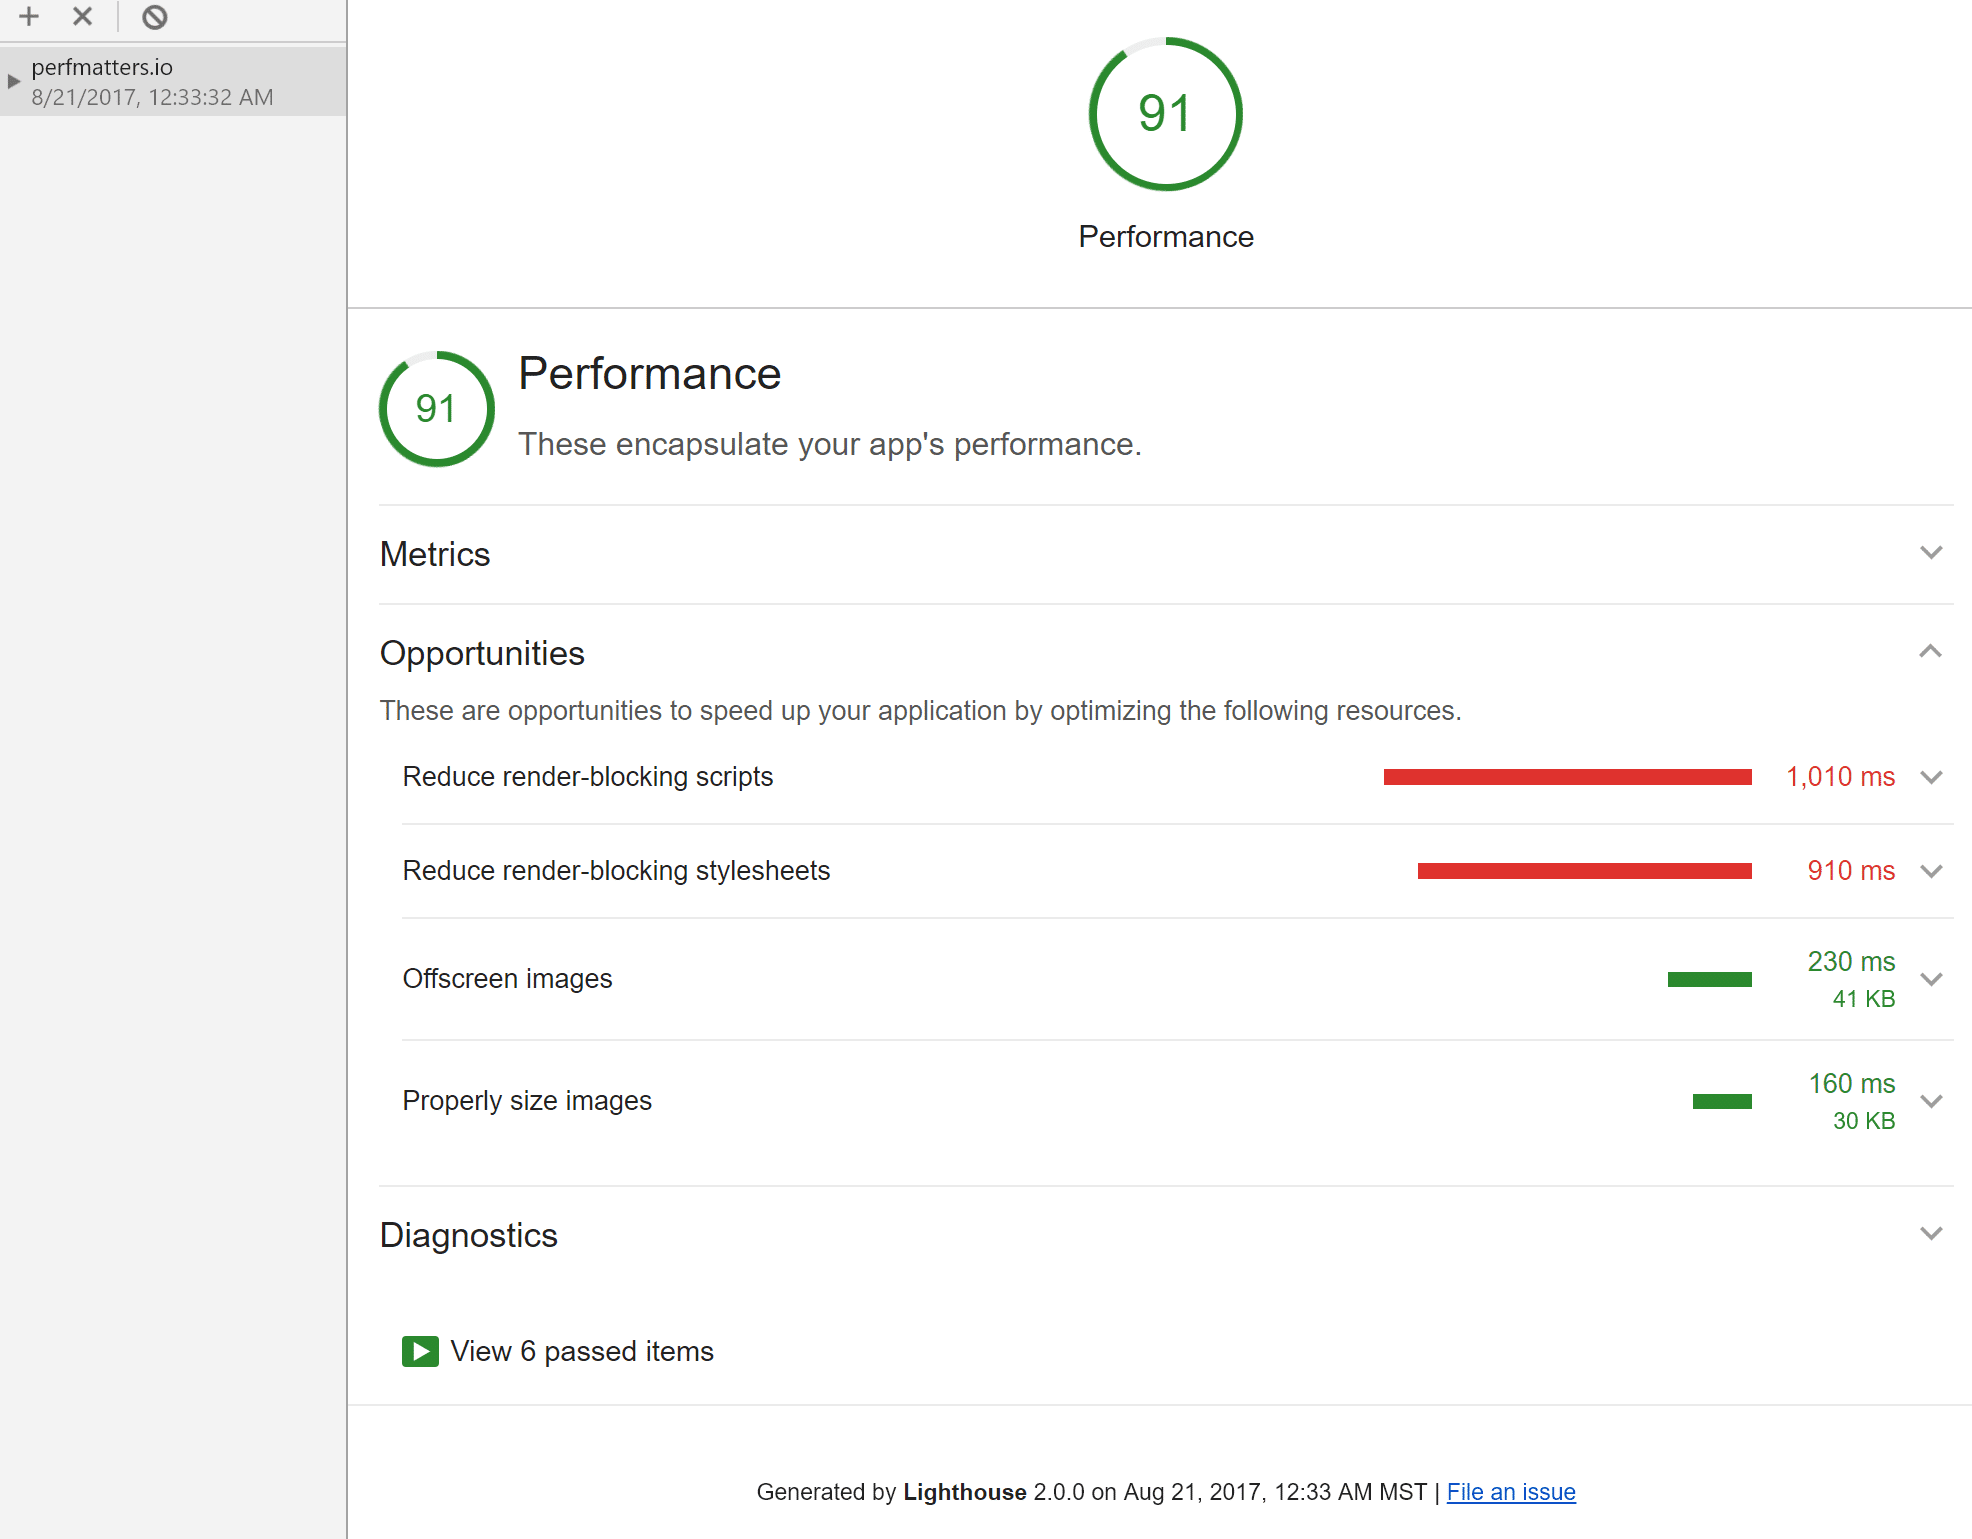
The team at Google also integrated Lighthouse into Chrome DevTools. Lighthouse is an automated open source tool for improving the quality of web pages. It offers audits for performance, accessibility, progressive web apps, and more. You can run it from the “Audit” tab. It has a similar 0/100 grading system. You can dive into your requests, see what scripts might be render-blocking, find your image compression savings, and so on. You can then easily share your results with others.
Other features in Chrome DevTools include being able to disable the cache, throttle your network connections, take screenshots of page rendering, and diagnose slow TTFB.
11. Site Relic
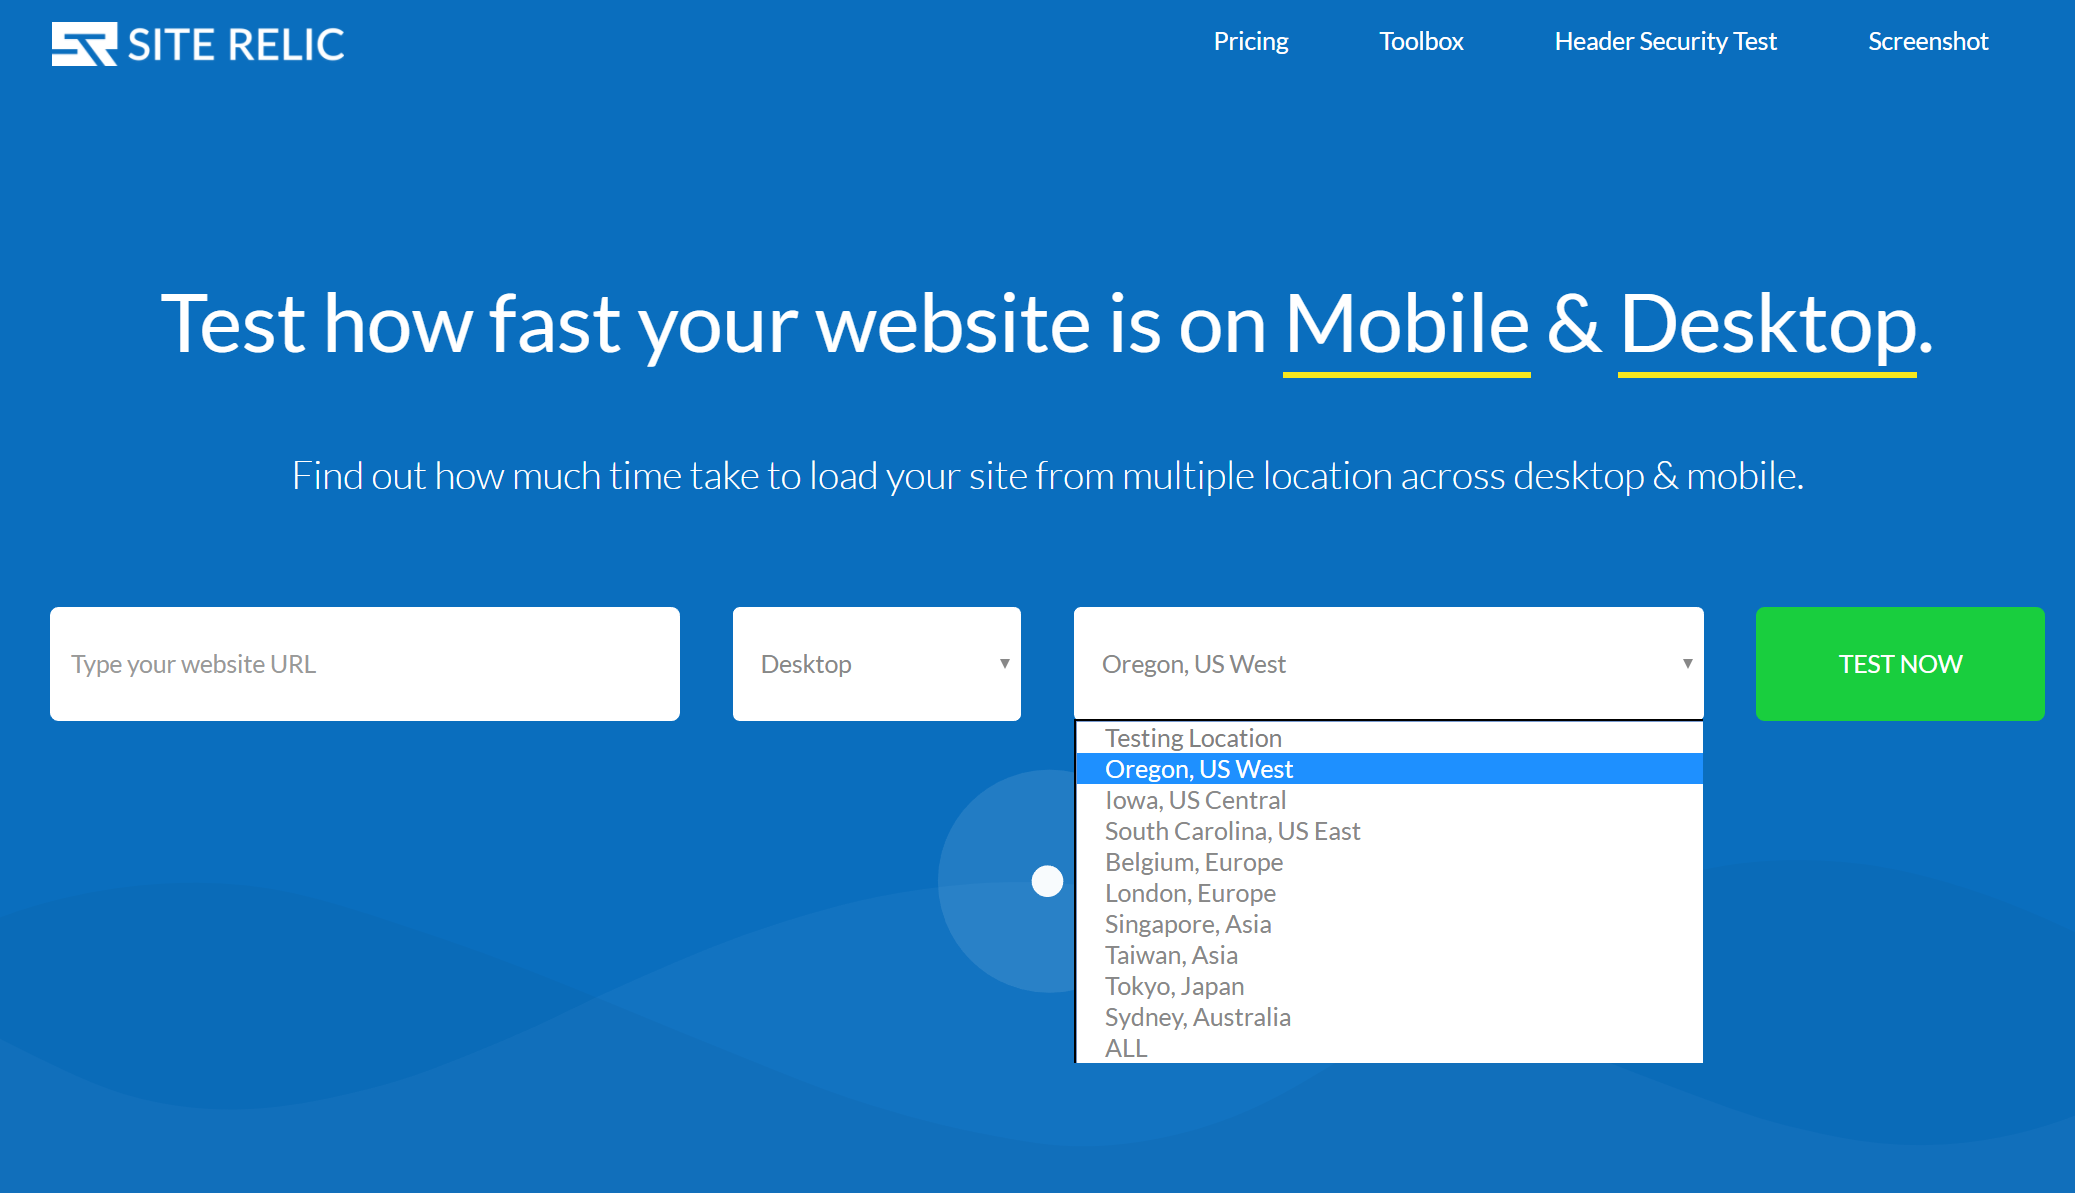
Site Relic is another completely free website speed test tool that has popped up recently. It allows you to easily check your site’s load time on both mobile and desktop across nine different regions. You can also view your TTFB across all regions at once.
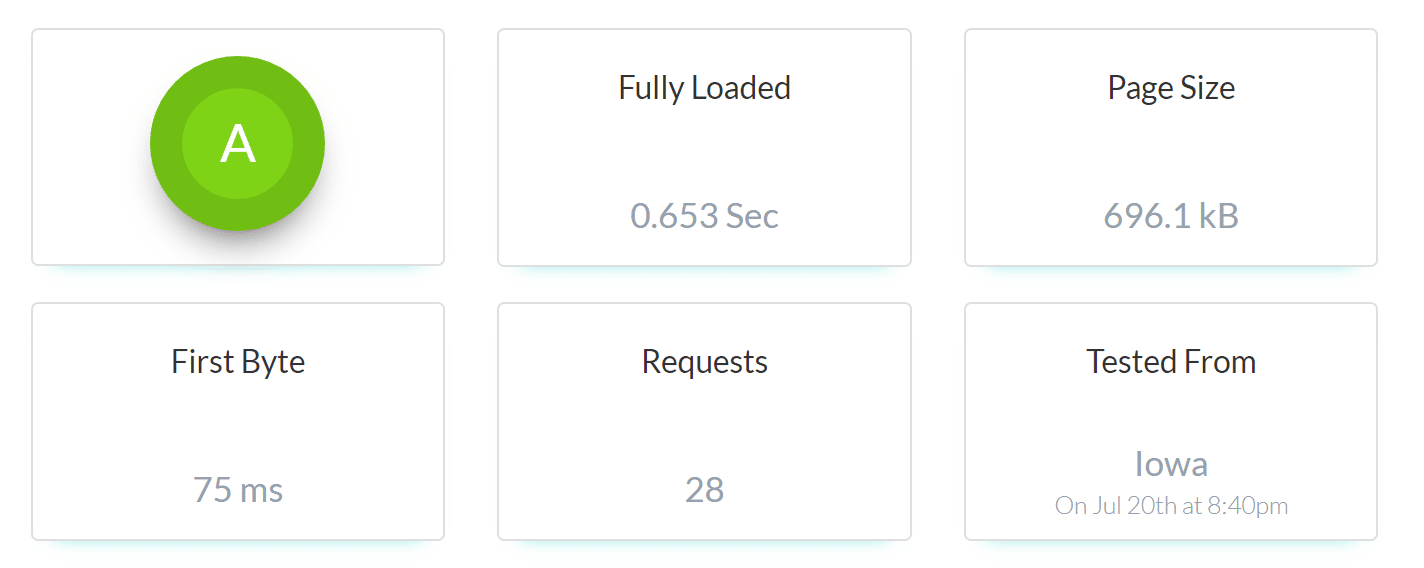
Individual location reports allow you to easily see your fully loaded time, page size, first byte, total number of requests, request counts by type, and request counts by response code. The waterfall report in the tool is also very well designed.
12. dotcom-monitor
dotcom-monitor has a lot of free and useful tools, one of which is their website speed test tool. It allows you to instantly test your website’s speed from 25 locations around the globe. You can choose between different browsers such as Internet Explorer, Firefox, Chrome, iOS, Android, and Windows Phone.
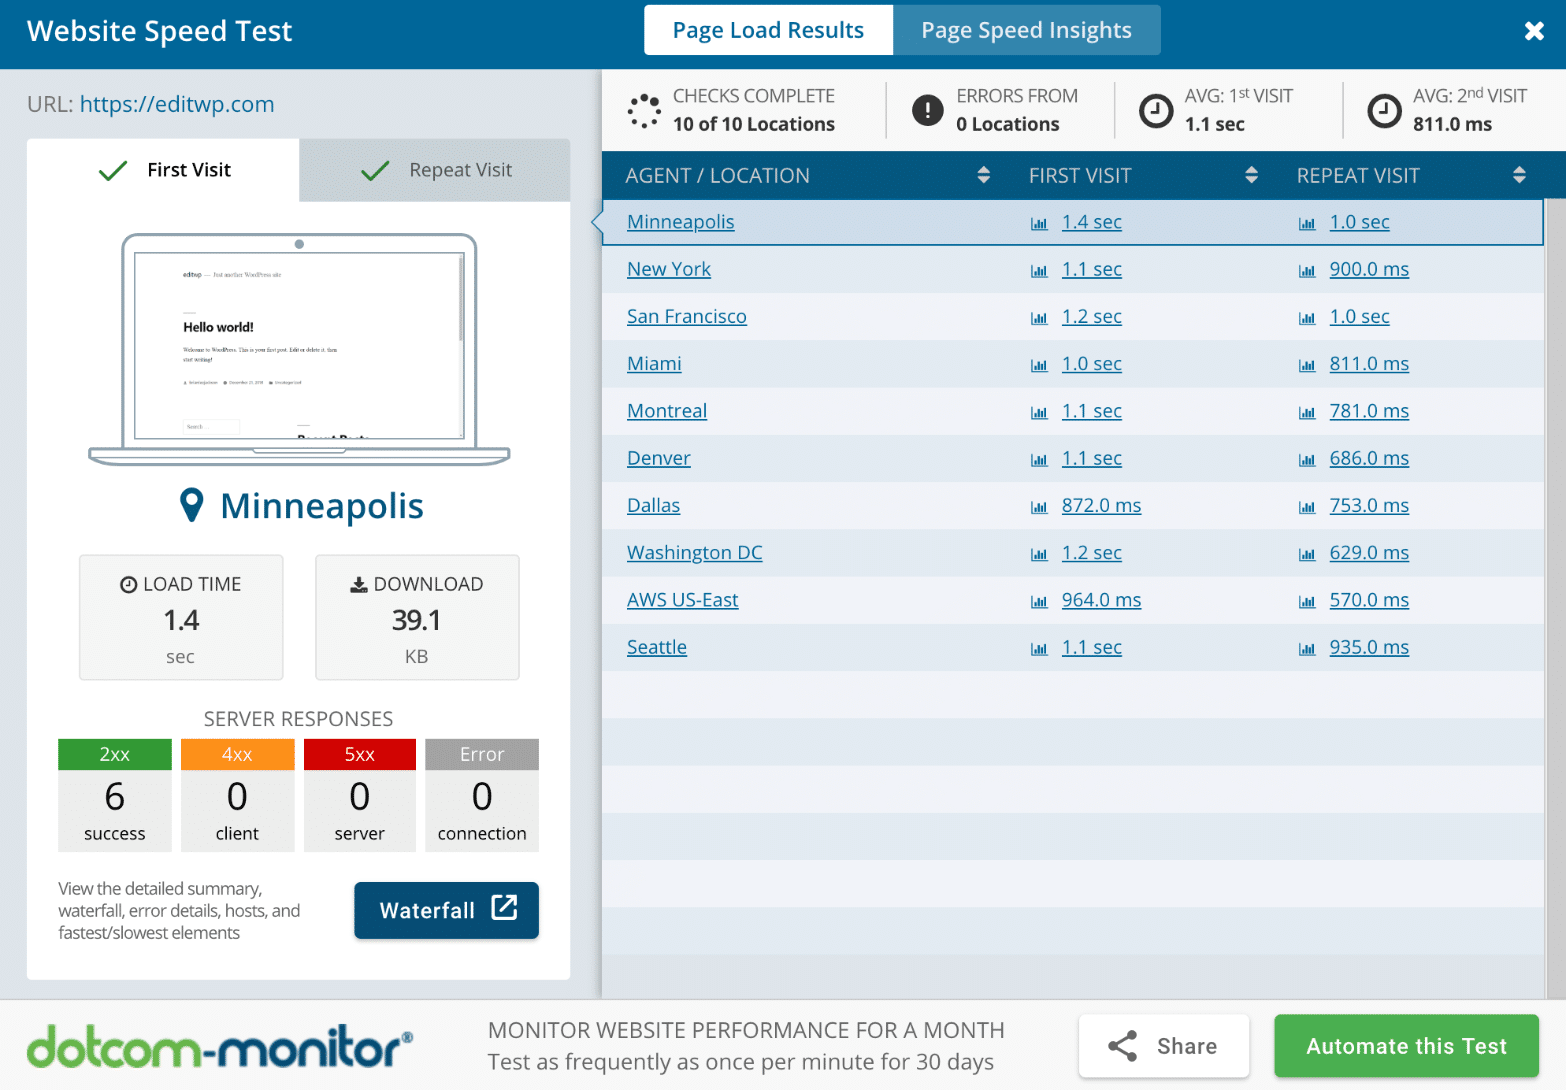
Their web performance report includes:
- Summary by location
- 10% top fastest elements
- 10% top slowest elements
- Comprehensive waterfall chart
- Breakdown by host element, including DNS, Connection, SSL, Request, First packet, and Download
- Error check and diagnostics
13. New Relic
New Relic offers all sorts of services, from application performance monitoring and server monitoring to mobile monitoring and real-time user insights. Technically, this is a premium tool, but if you need more data than the above tools provide, this would be the one to invest in.
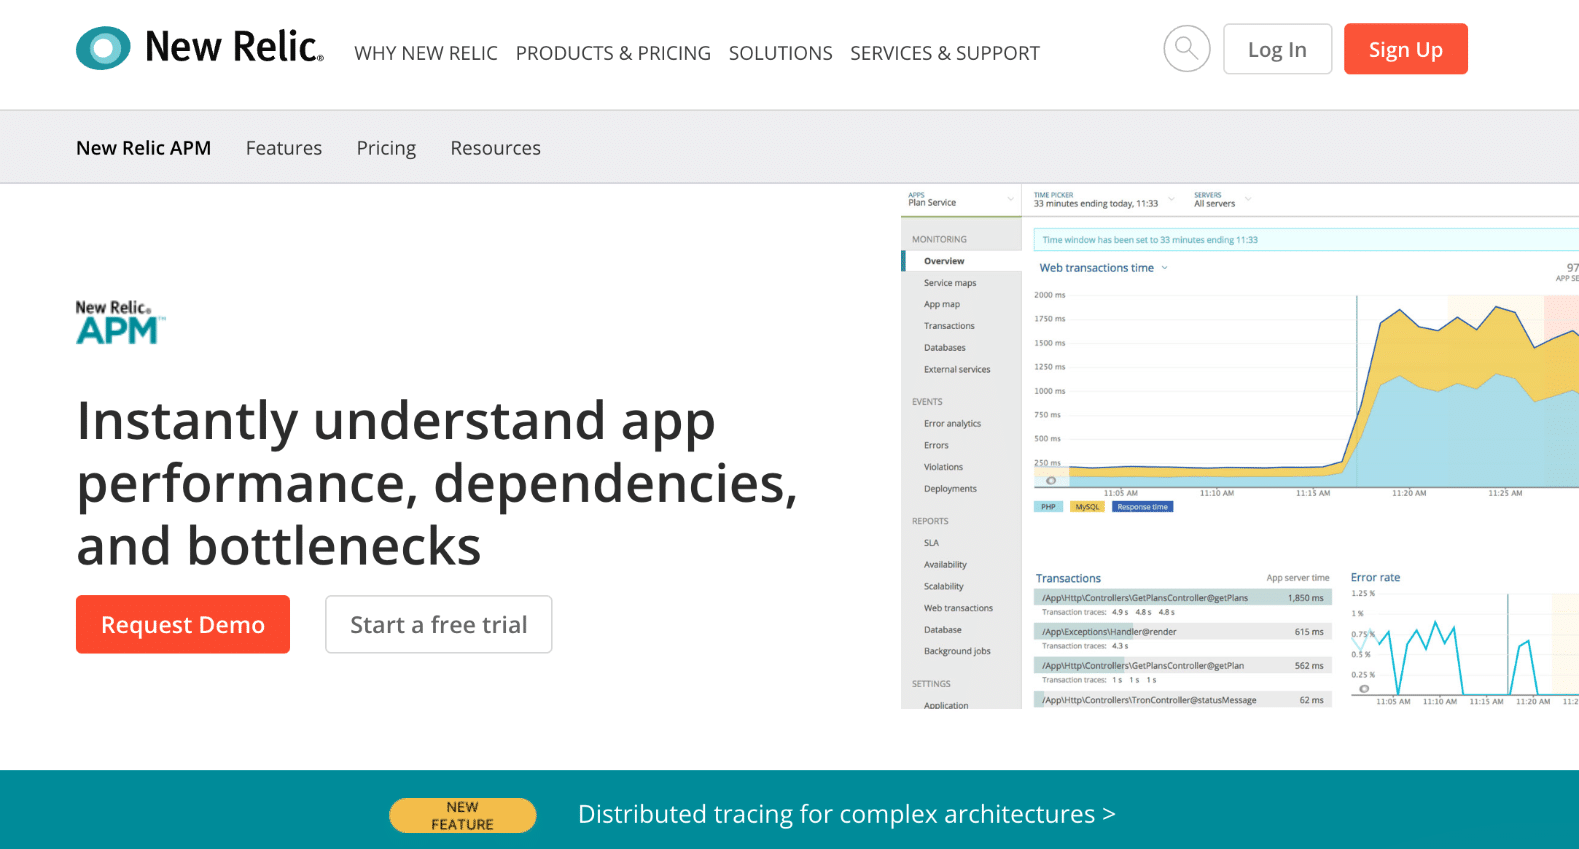
We actually use two of New Relic’s products here at Kinsta to monitor uptime and performance: their application monitoring and synthetics products.
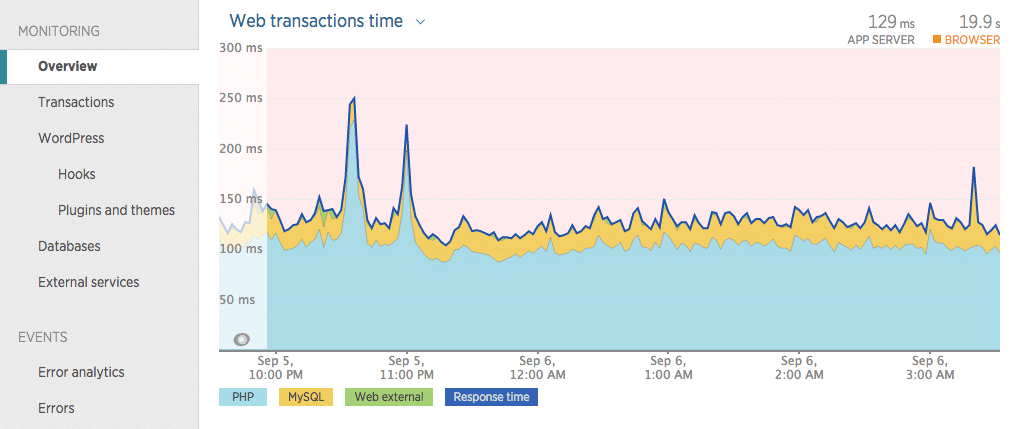
One especially useful feature is the WordPress plugins section. You can instantly see which plugins and themes have the longest response times.
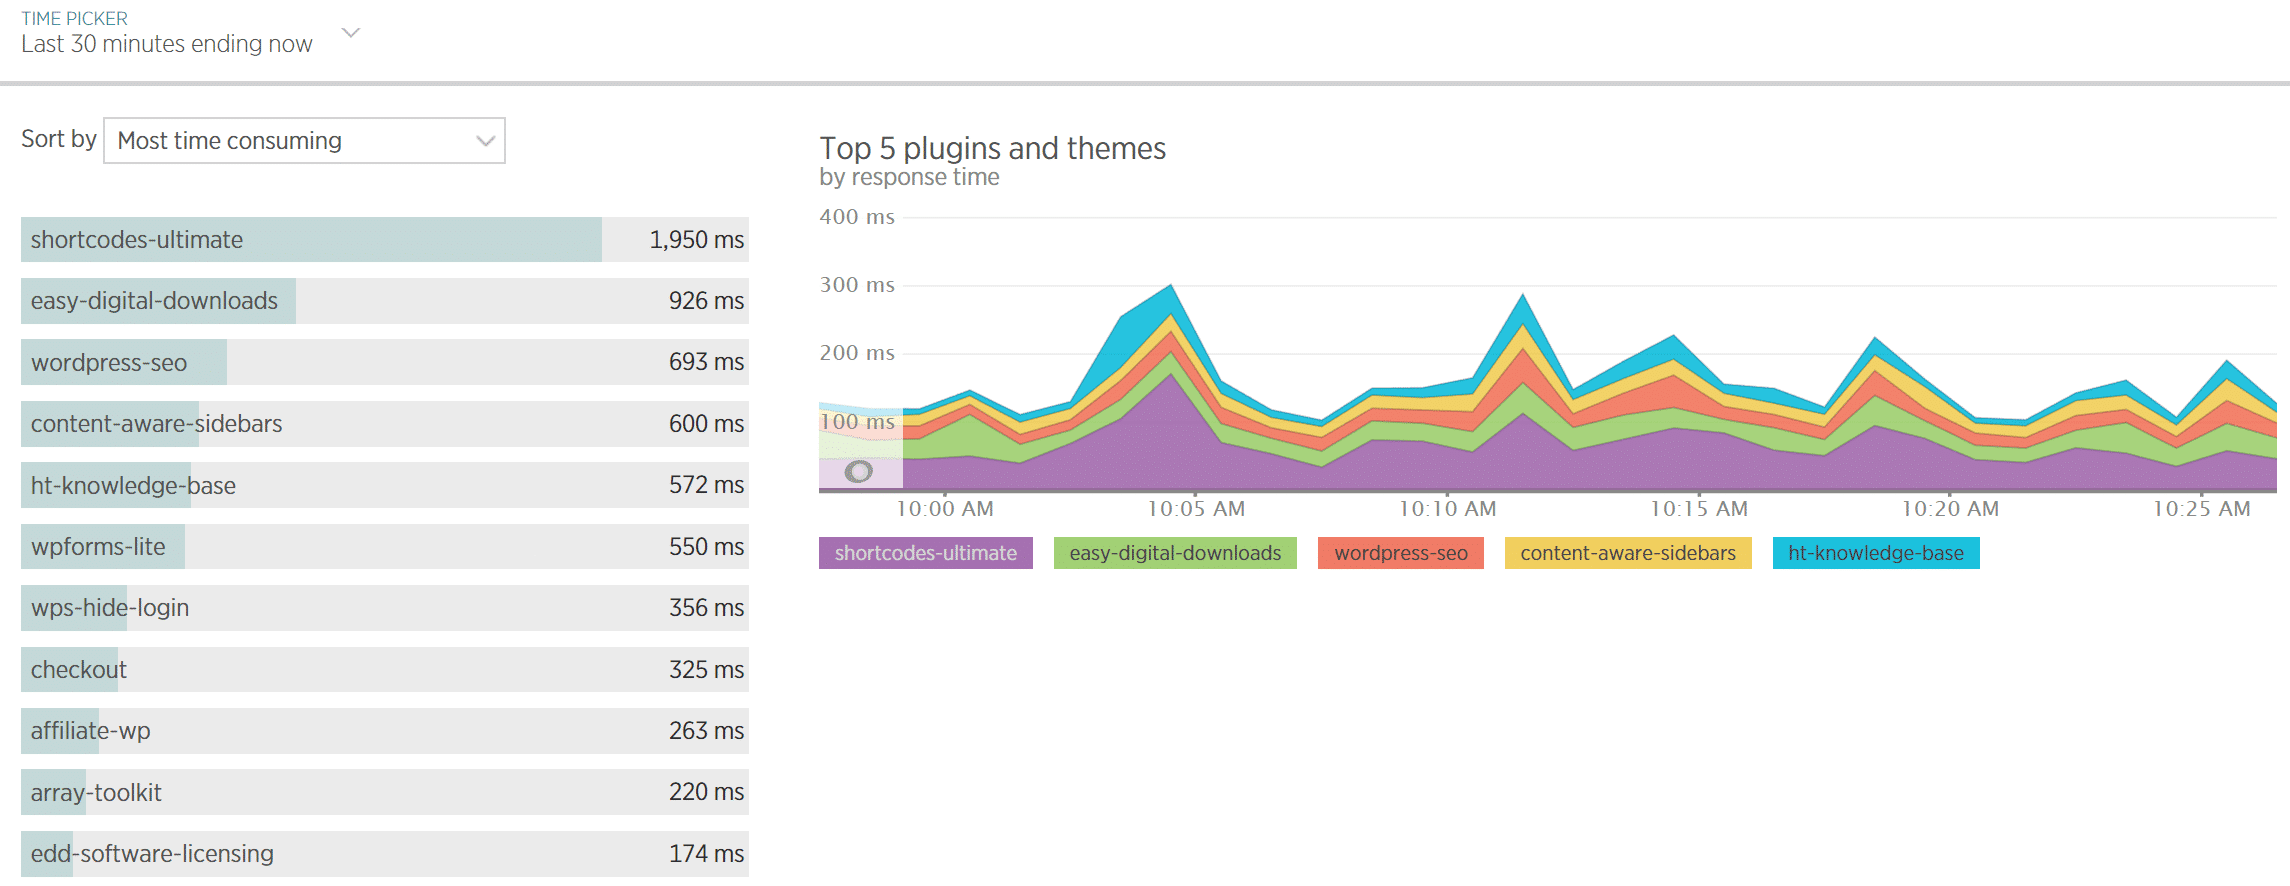
If your website starts to slow down, you can easily spot this with New Relic and get notified so you can take immediate action toward fixing the issue. This also includes viewing external services or ad networks that might be slowing down your site. New Relic has been a great tool for us to ensure we provide the best support for our customers.

Summary
Understanding how to properly speed test your WordPress site will ensure you’re gauging your performance effectively — especially if you’re trying to measure how fast your site is after you migrate to Kinsta. 😉
By now, it should be abundantly clear: Website speed is an important component of any successful website. The faster your website, the better your chances of success. If a lightning-quick website is your priority – and it should be! – make sure you’re using at least one of these tools to quantitatively measure your speed optimization strategy.
What tools do you use for measuring website speed? Share them in the comments below!


