We all love WordPress. Many of us here at Kinsta have different ways we contribute to the WordPress community outside of work. Myself, I run a marketing blog where I share unique ways you can take your WordPress site to the next level. You might think that since I work for a hosting company that my sites would just magically function and never have any issues. However, WordPress isn’t always sunshine and roses. You are bound to run into occasional problems and that’s why it’s so important to have the tools and support team in place for when you do.
Today I’m going to dive into how I debugged a strange (probably one in a million) WordPress performance issue on my site, along with tools and strategies that came to my rescue. While every case like this is fairly unique, the workflow for troubleshooting typically remains the same. So I’m including what I like to call a “Stuff Happens: WP Performance Checklist.” Hopefully, you can use this the next time you find yourself in a jam with WordPress performance problems outside of your understanding or control.
WordPress Performance Checklist (When Stuff Happens)
This performance checklist is a little different. Instead of sharing how you can speed up your WordPress site, this focuses on what to do regarding the next time you find yourself in a pickle. And there will be next time, you can count on it. Perhaps your host has reached out saying your site is overloading the server. Or perhaps you’ve noticed something is dragging your site down, like the ever so popular admin-ajax.php requests.
Before throwing your hands up in the air and calling it quits, follow the recommendations below. There is an answer for everything, but finding it can be tough sometimes.
- Implement Performance Monitoring
- Take Advantage of Tools Like New Relic
- Utilize Staging – It’s There for a Reason
- Invest in Premium WordPress Hosting
- Maintenance Companies Go the Extra Mile
- Don’t Be Afraid to Raise Issue With Developer
- You Can Always Hire a WP Developer
1. Implement Uptime and Performance Monitoring
You can never be too prepared when it comes to these types of issues. One of the best things you can do to make sure you know about your site tanking before your visitors do is to implement uptime and performance monitoring. And in fact, that is just how I originally found out that my site was having problems. Kinsta checks the status of all websites we host every 3 minutes. This translates to 480 checks for each hosted site per day.
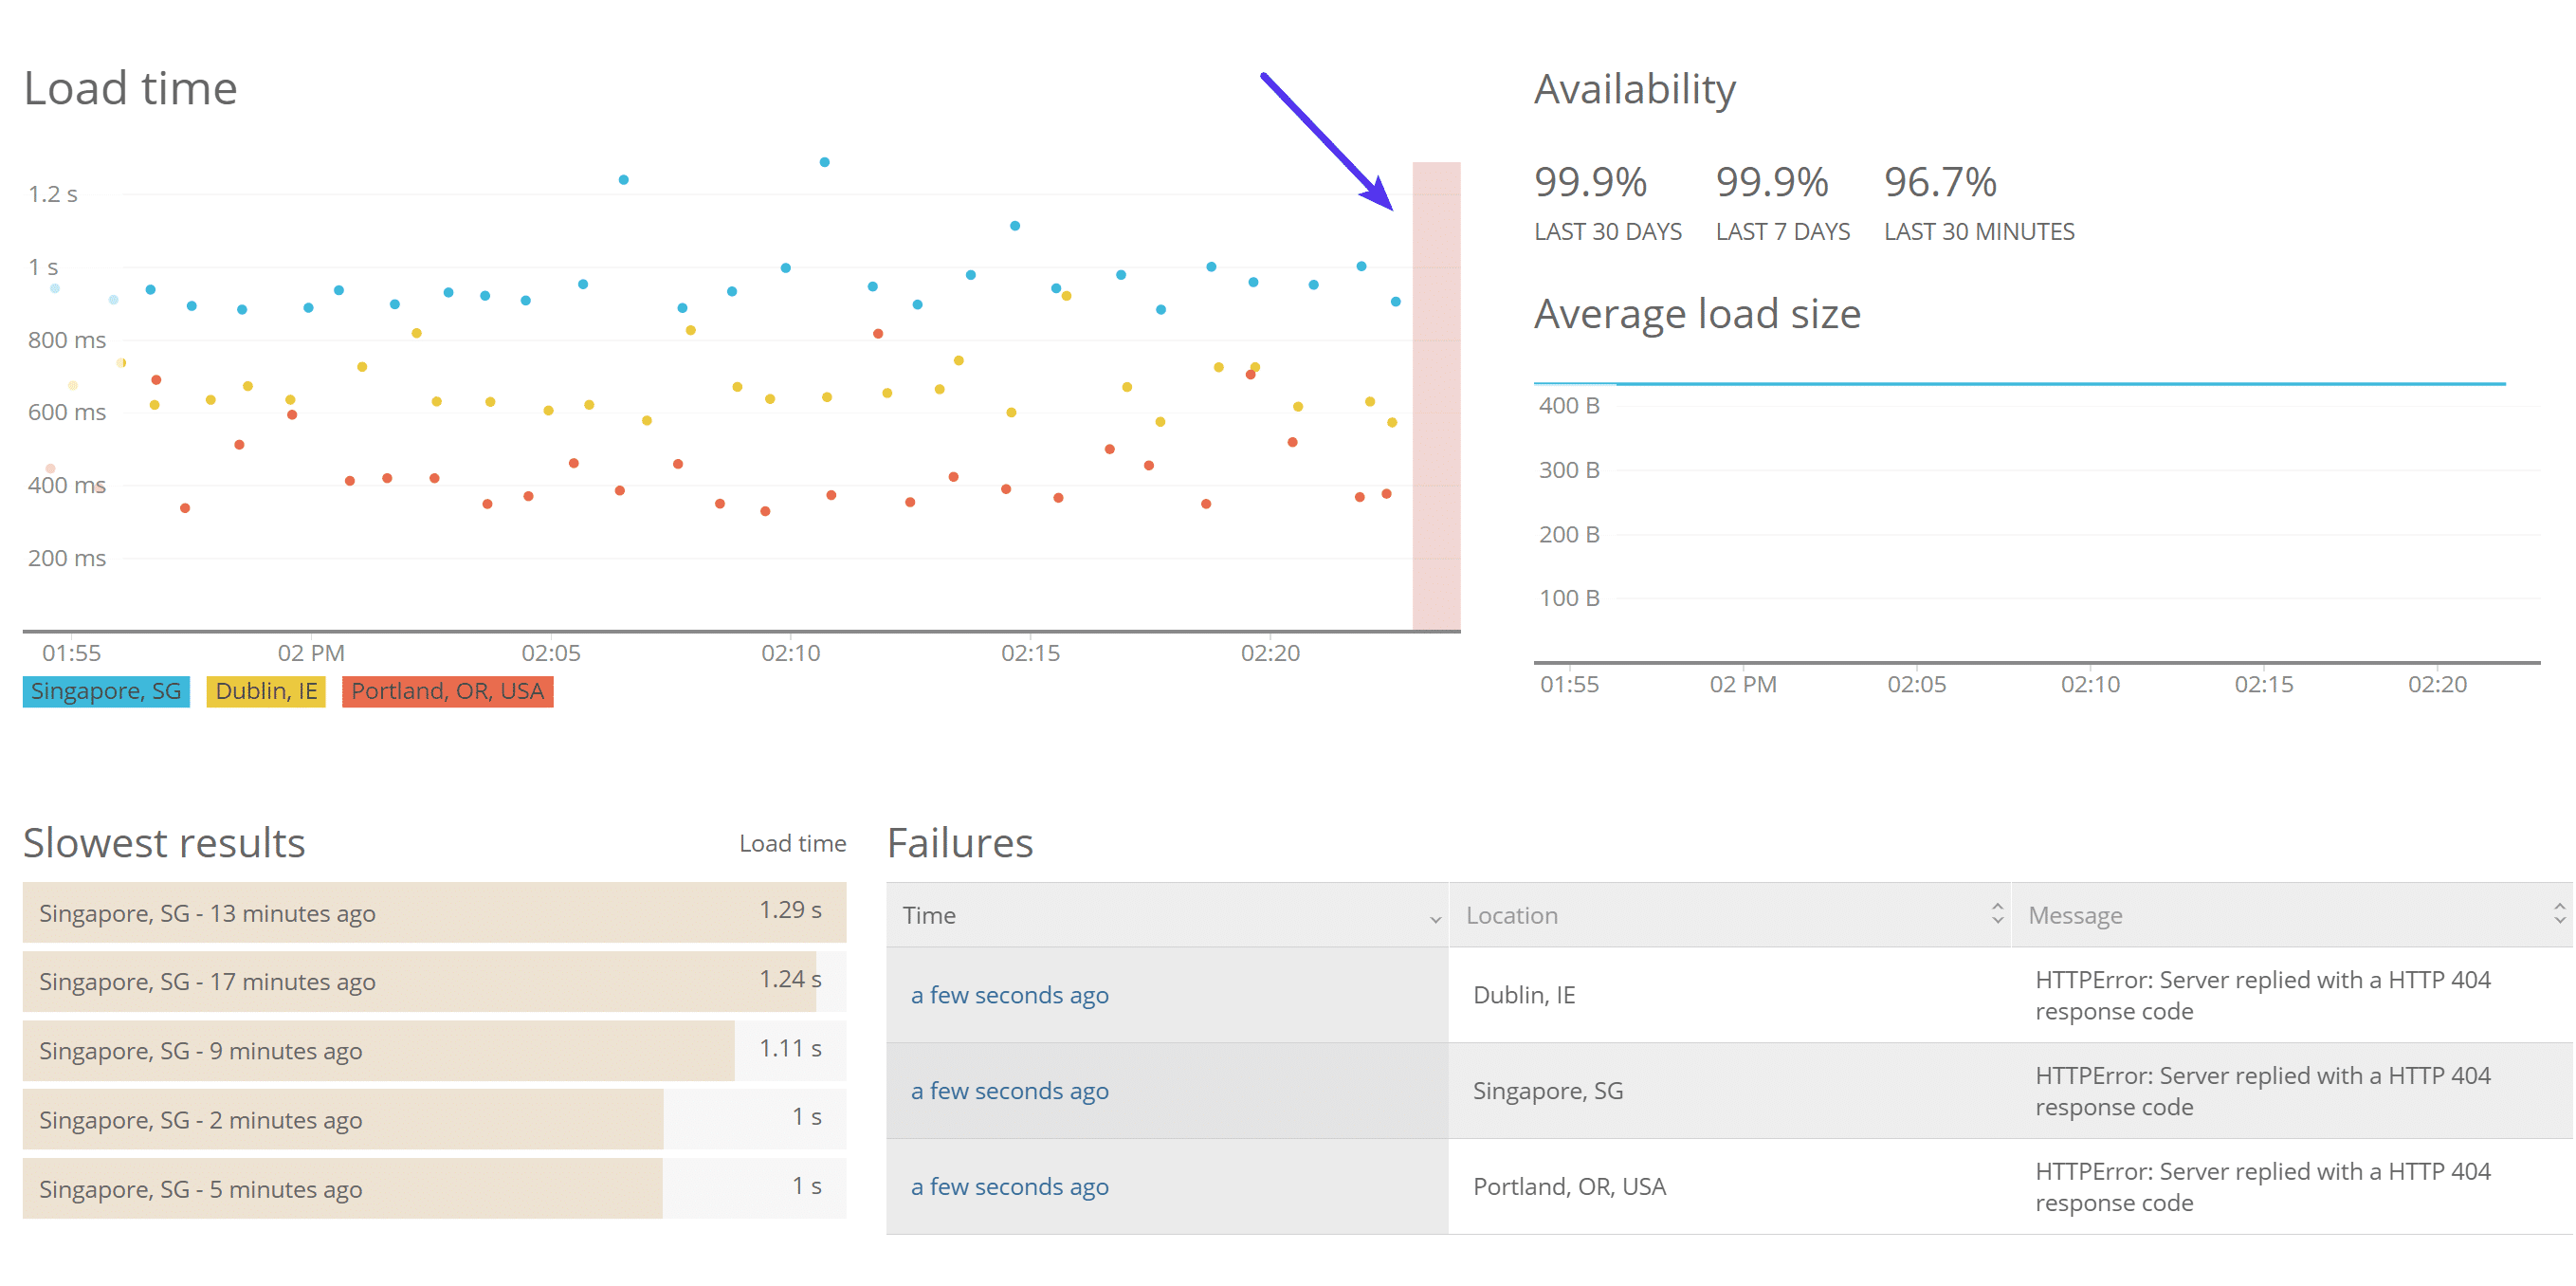
In fact, thanks to New Relic Synthetics and APM, we also have the ability if needed to monitor quite a few different data points regarding WordPress sites:
- End-user load time
- App server load time
- Error rates
- Throughput
- Success rate (uptime)
- Apdex scores
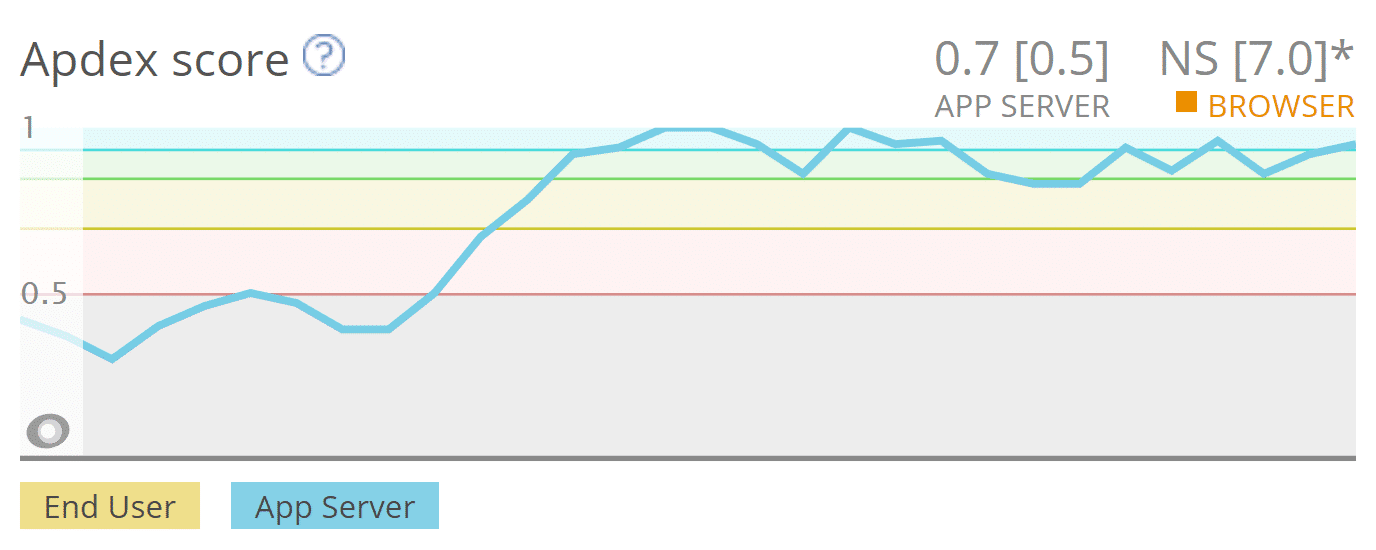
This pertains to both uptime and performance monitoring. If a site goes down the Kinsta team knows about it before you do. If a site we are monitoring goes way over acceptable internal performance thresholds, we will also reach out to you and help troubleshoot the issue with your site.
Sometimes this could involve roping in a third-party developer, especially if bad code is the origin. Or it might mean an increase in PHP threads is needed. Lastly, it might be something that is easily fixable.
We want you to succeed, and having a fast site for your visitors is always one of our biggest priorities. If we can pinpoint that plugin A is causing your site to go down, we want you to know. More often than not, we tend to see a lot of performance issues stem from bad plugin updates, botched code, or not supporting the latest version of PHP, etc.
Uptime and Performance Monitoring Tools
If you aren’t using Kinsta, there are still a lot of third-party tools you can use to alert you both on uptime and performance. Here are some you might want to check out:
- updown.io (uptime monitoring)
- Pingdom (uptime and performance monitoring)
- Uptime Robot (uptime monitoring)
- StatusCake (uptime and performance monitoring)
- ManageWP (uptime and performance monitoring)
2. Take Advantage of Tools Like New Relic (They Are Invaluable)
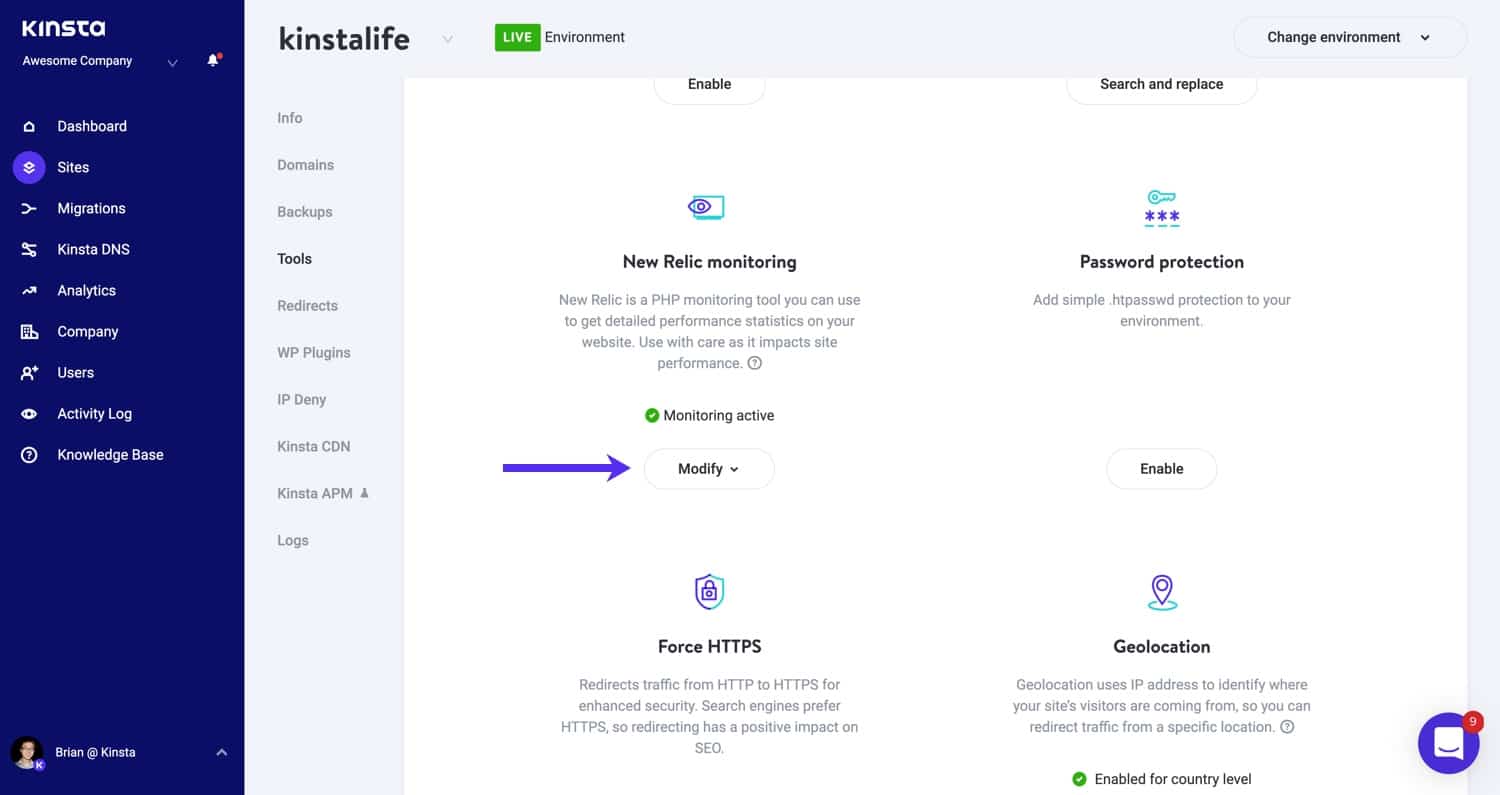
Tools like New Relic aren’t just great for monitoring uptime and performance, they are invaluable when it comes to troubleshooting where the performance issue is originating from. Kinsta has a New Relic integration which allows users to easily utilize their own license keys. While this isn’t included in our hosting, our support team can enable this on our side and help track down issues for you if needed. Or you can use try using a free plugin like Query Monitor.
There are a couple places in New Relic that can help narrow down performance issues fast. The first is the “WordPress → Plugins and themes” tab. On my woorkup site, which I am using as a case study today, I could instantly see that the issue I was encountering was most likely coming from the “gp-premium” plugin I have running. But why? Well, we’ll get to that.
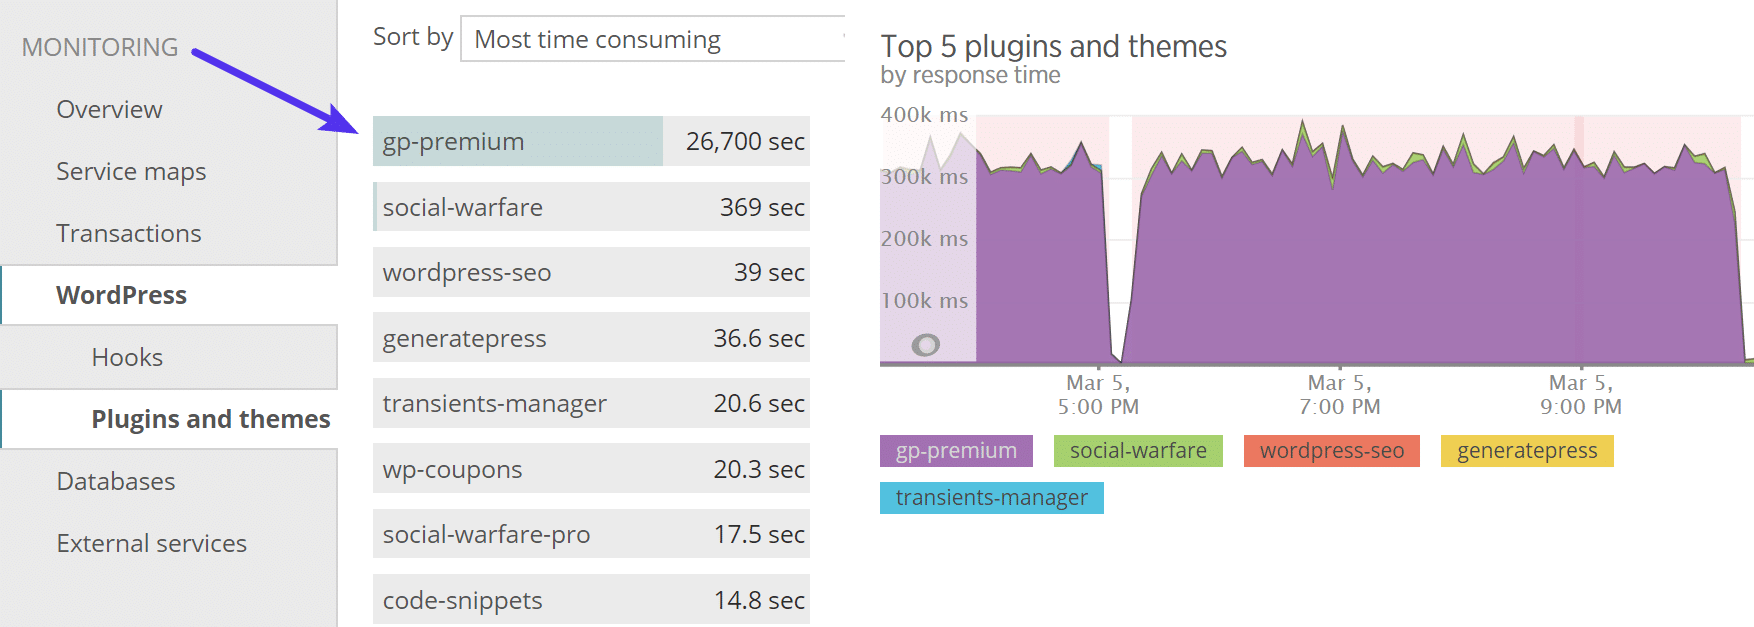
Note: The section above in New Relic isn’t always 100% accurate. In this case, it was. But it’s always recommended to at least check there first.
So after seeing that I had a good feeling or hunch that it’s something in my “gp-premium” plugin (which is an extension of my GeneratePress WordPress theme). Knowing this I then went over to the “Transactions” tab. We can immediately see that the number of admin-ajax.php transactions were through the roof!

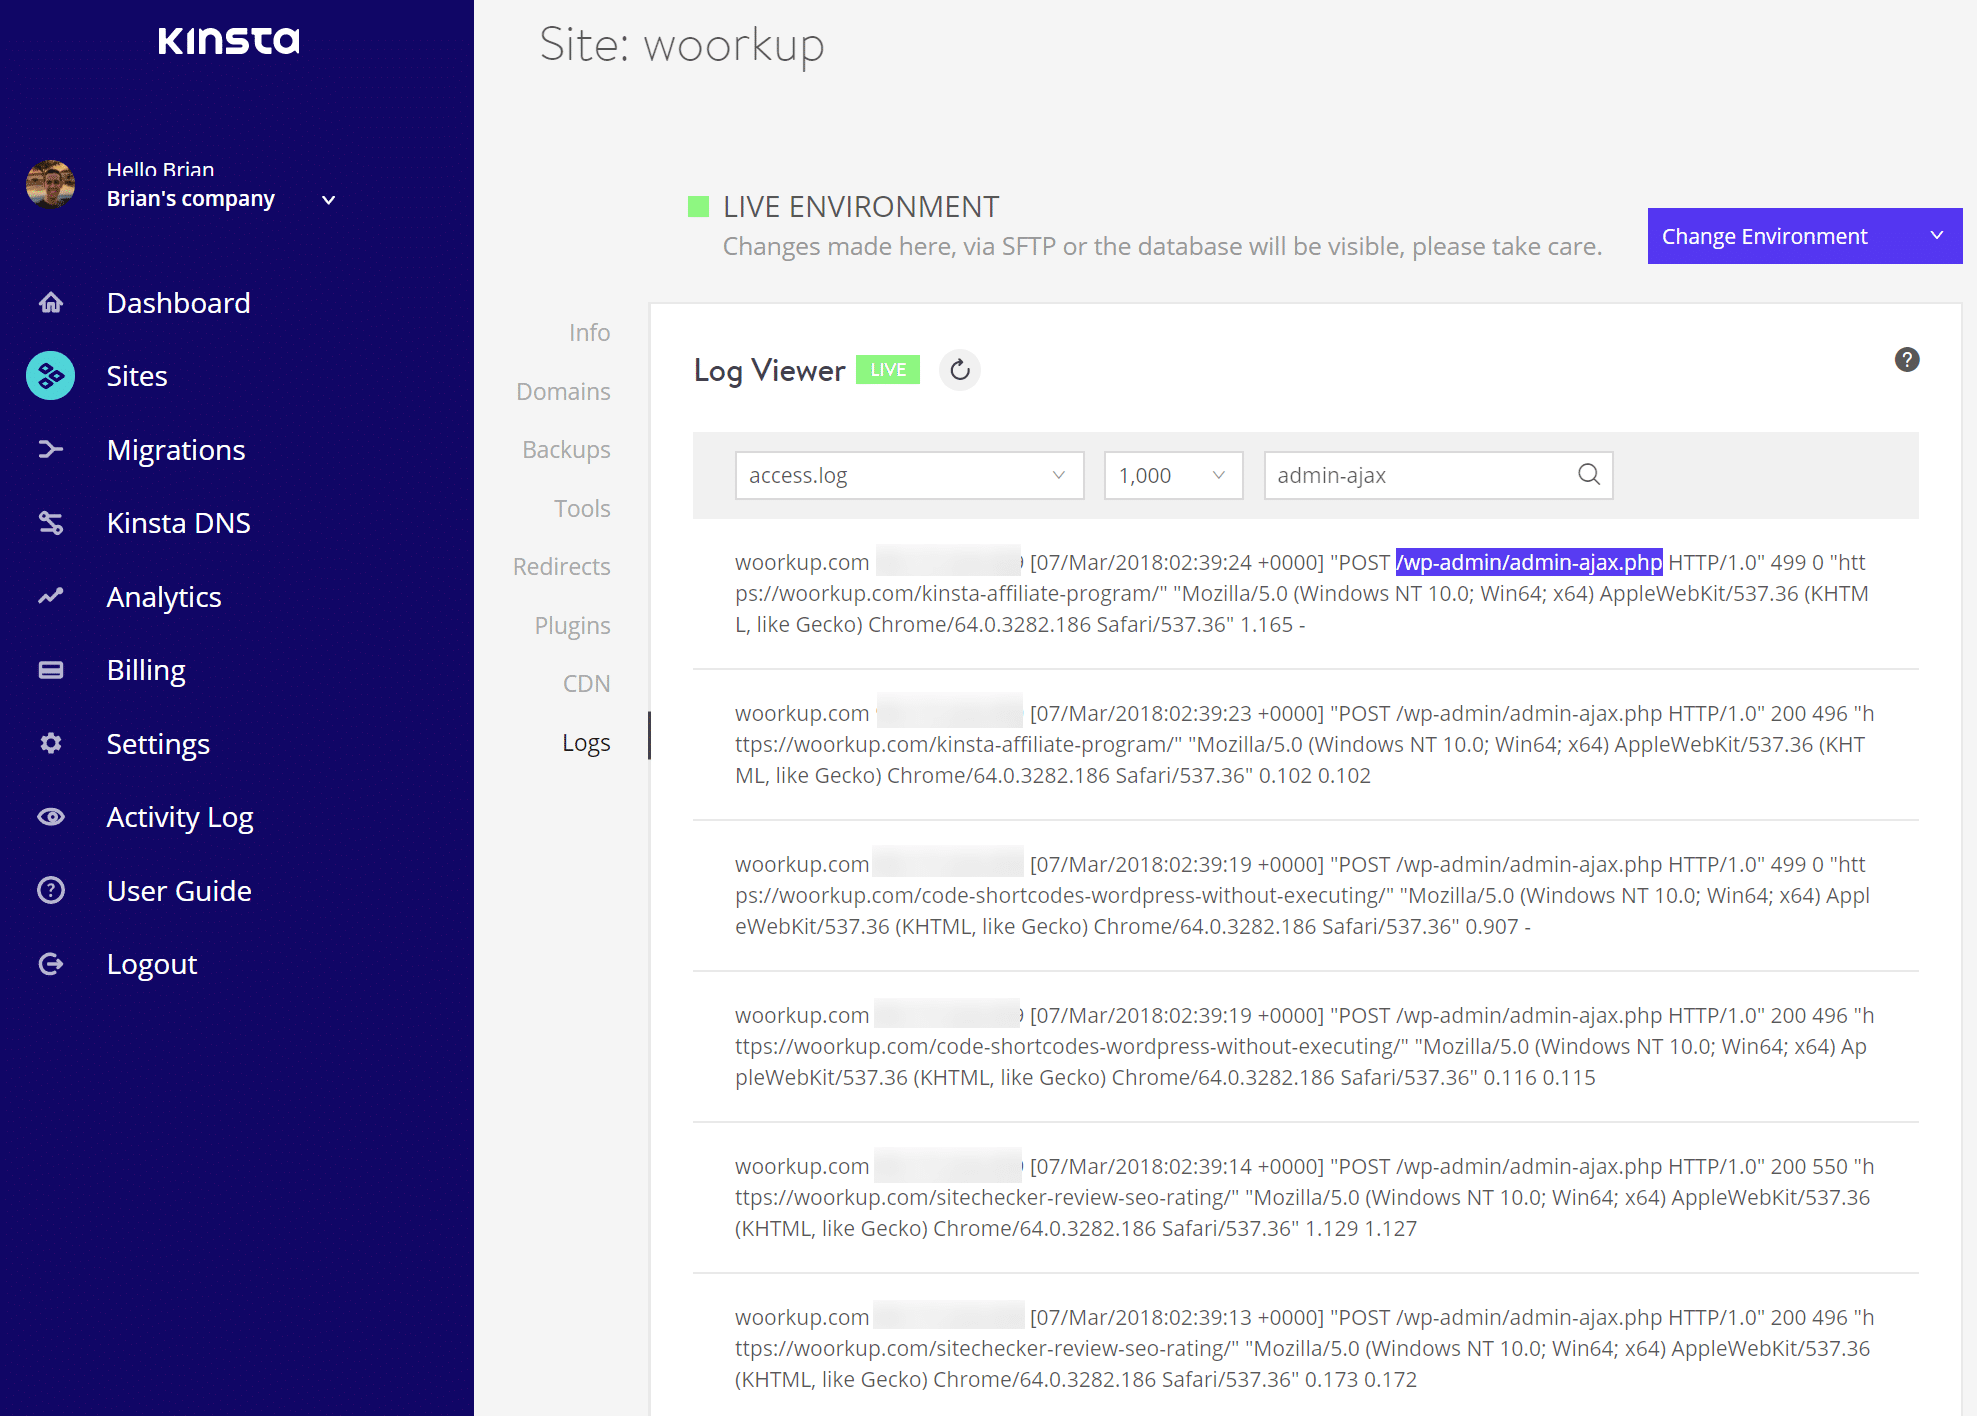
For those of you without New Relic, make sure to check out our great tutorial on how to diagnose high admin-ajax usage on your WordPress site. I could also see constant admin-ajax requests in my WordPress logs. You can also take advantage of our built-in Kinsta APM tool.
The next step was to dig into the admin-ajax.php transactions and look at the database queries consuming the most time. You can click into the “Trace Details or “Database queries” tabs.
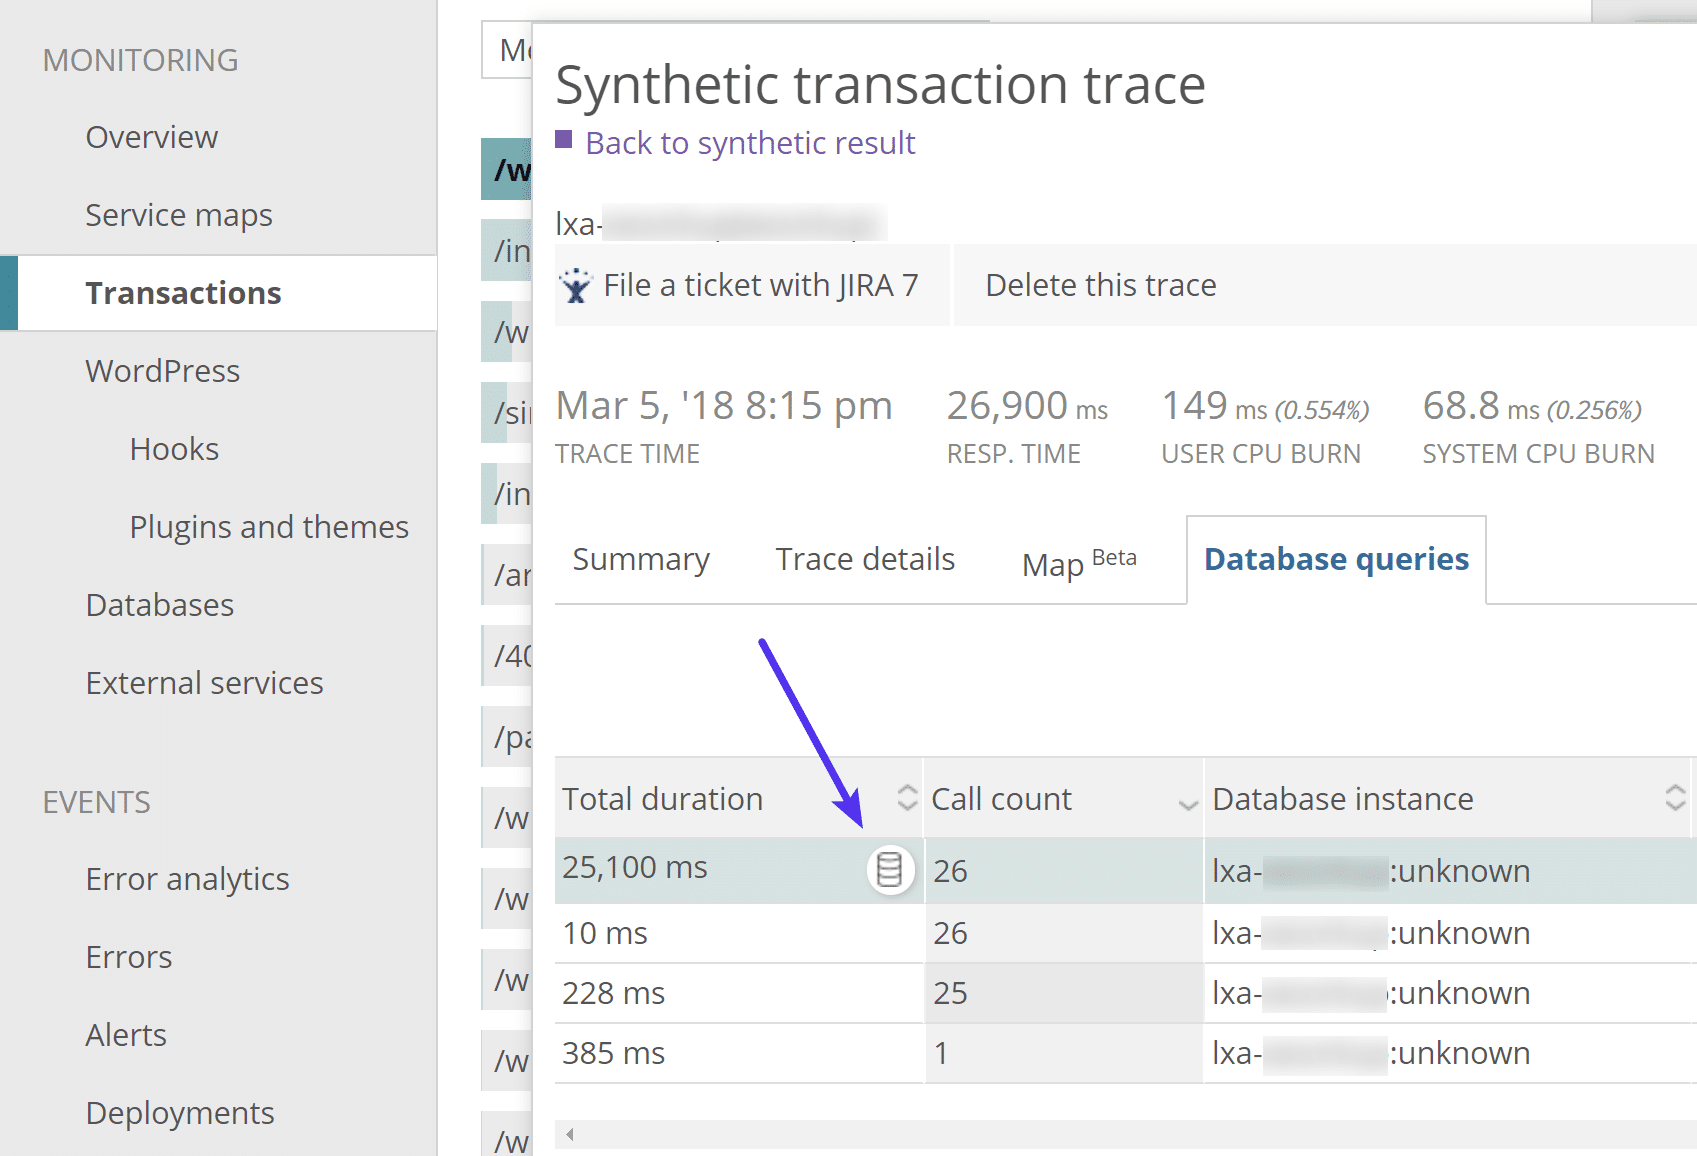
Sometimes the query itself will be an indicator of where the issue is, but in this case, it wasn’t. Something else though immediately something stood out, and that was the /gp-premium/ folder. Remember from above we were seeing that “gp-premium” was supposedly the plugin causing the issue. Usually, if you are seeing it both in the plugin/theme section as well as the trace section, its a good indicator that this is a good place to start.
…s/gp-premium/library/image-processing-queue/includes/wp-background-process.php
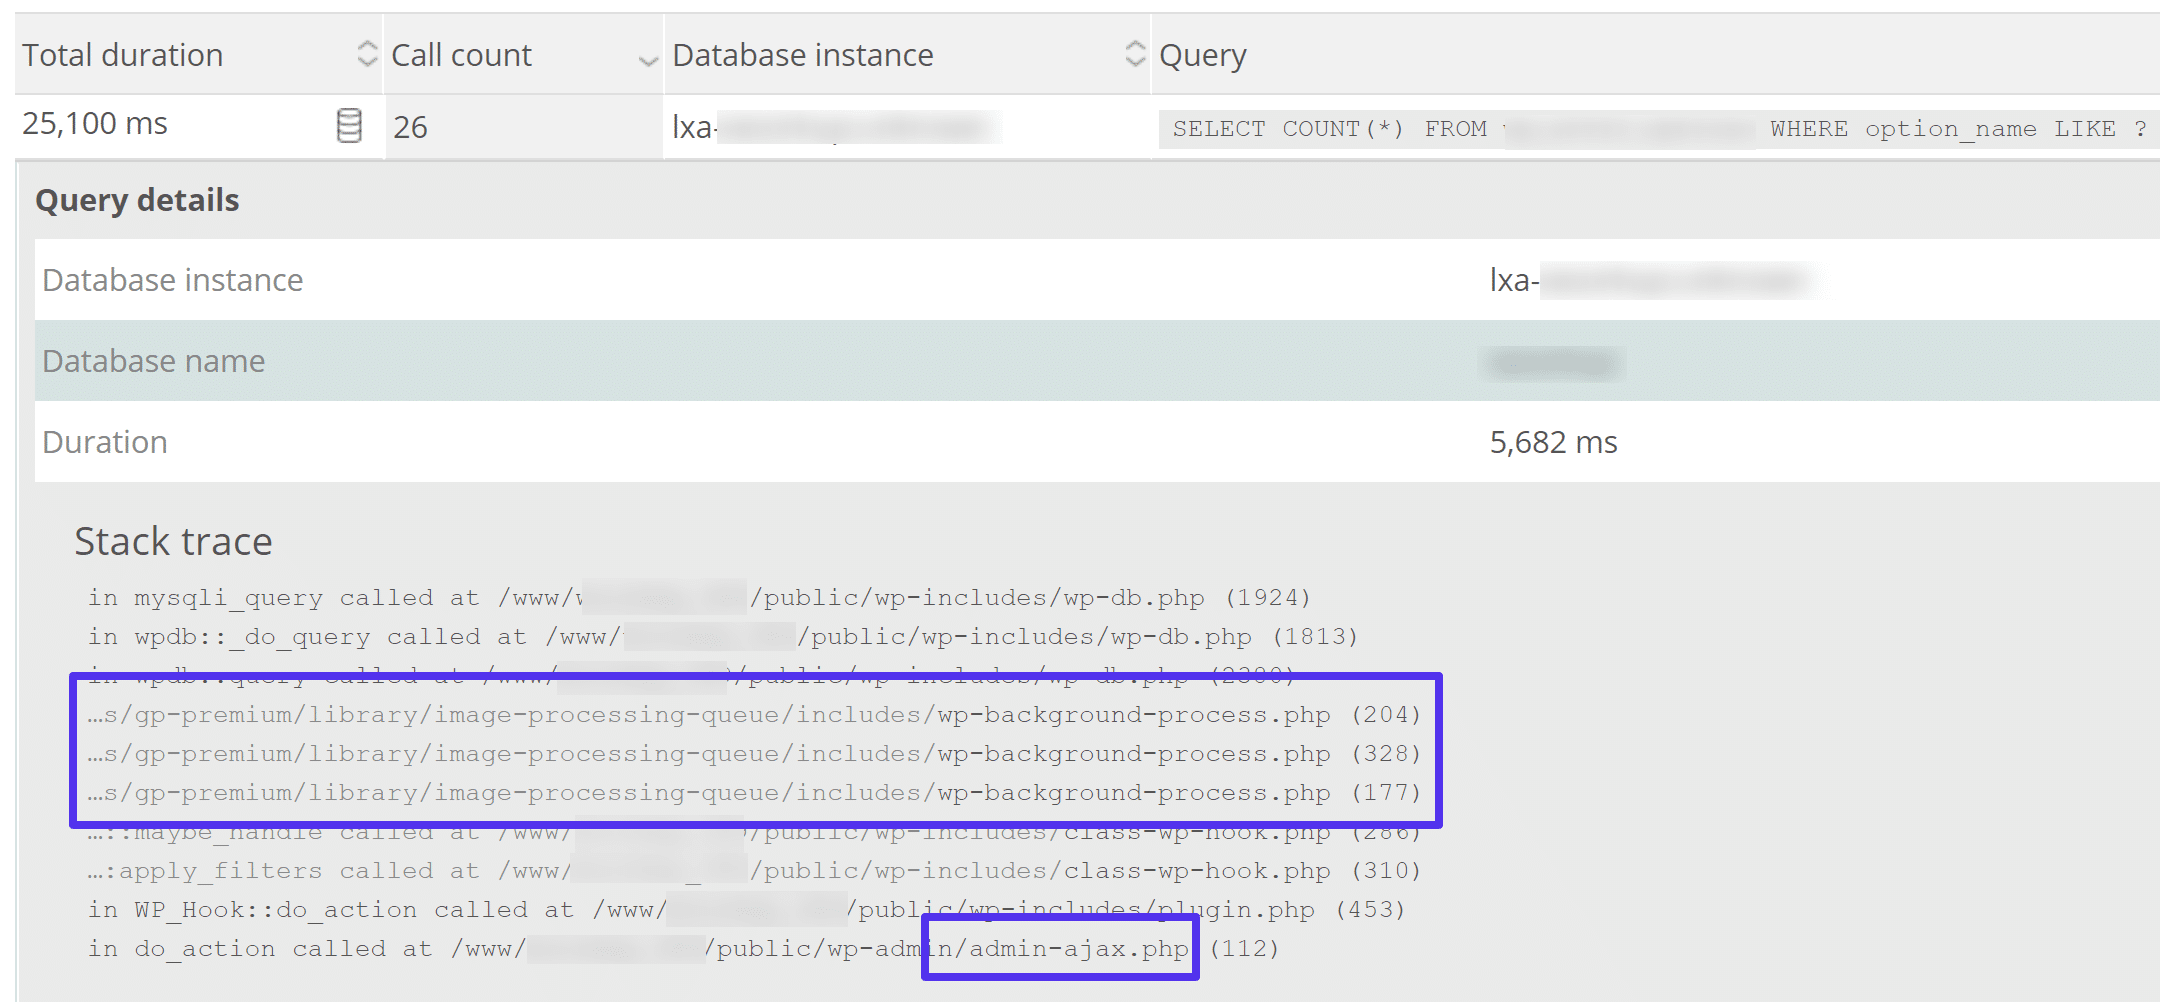
The next step was to head to Google! Yes, Google can actually be quite helpful in cases like these.
So I searched for “Image Processing Queue.” The very first result that came back was Delicious Brain’s Image Processing Queue plugin. Upon reading the description I could see that this was used for image processing for WordPress themes. Essentially image sizes are quietly generated in the background using WP Queue.

A quick search of this same term along with “GeneratePress” resulted in their recent changelog coming up. Tada! Yes, the image resizer had recently be changed in GeneratePress from Aqua Resizer over to Image Processing Queue. This was right around the time I had updated my theme, and nothing much else had changed on my site. This is why changelogs are so important! They can be like breadcrumbs for troubleshooting.

The puzzling thing was that I had other sites running GeneratePress that didn’t have this issue. So while I perhaps had a good clue of what was going on I still wasn’t 100% sure. So the next step was to whip out my staging environment to start debugging WordPress.
3. Utilize Staging Sites Without Touching Production
To be honest, I don’t know what I would do without staging environments. When it comes to troubleshooting issues like these, they come in super handy. Thankfully, Kinsta has easy-to-use staging environments. So I hopped into the MyKinsta dashboard and pushed a copy of my production site to staging. If your WordPress host doesn’t offer staging environments, you could also use a plugin like WP Staging, although it’s not as easy.
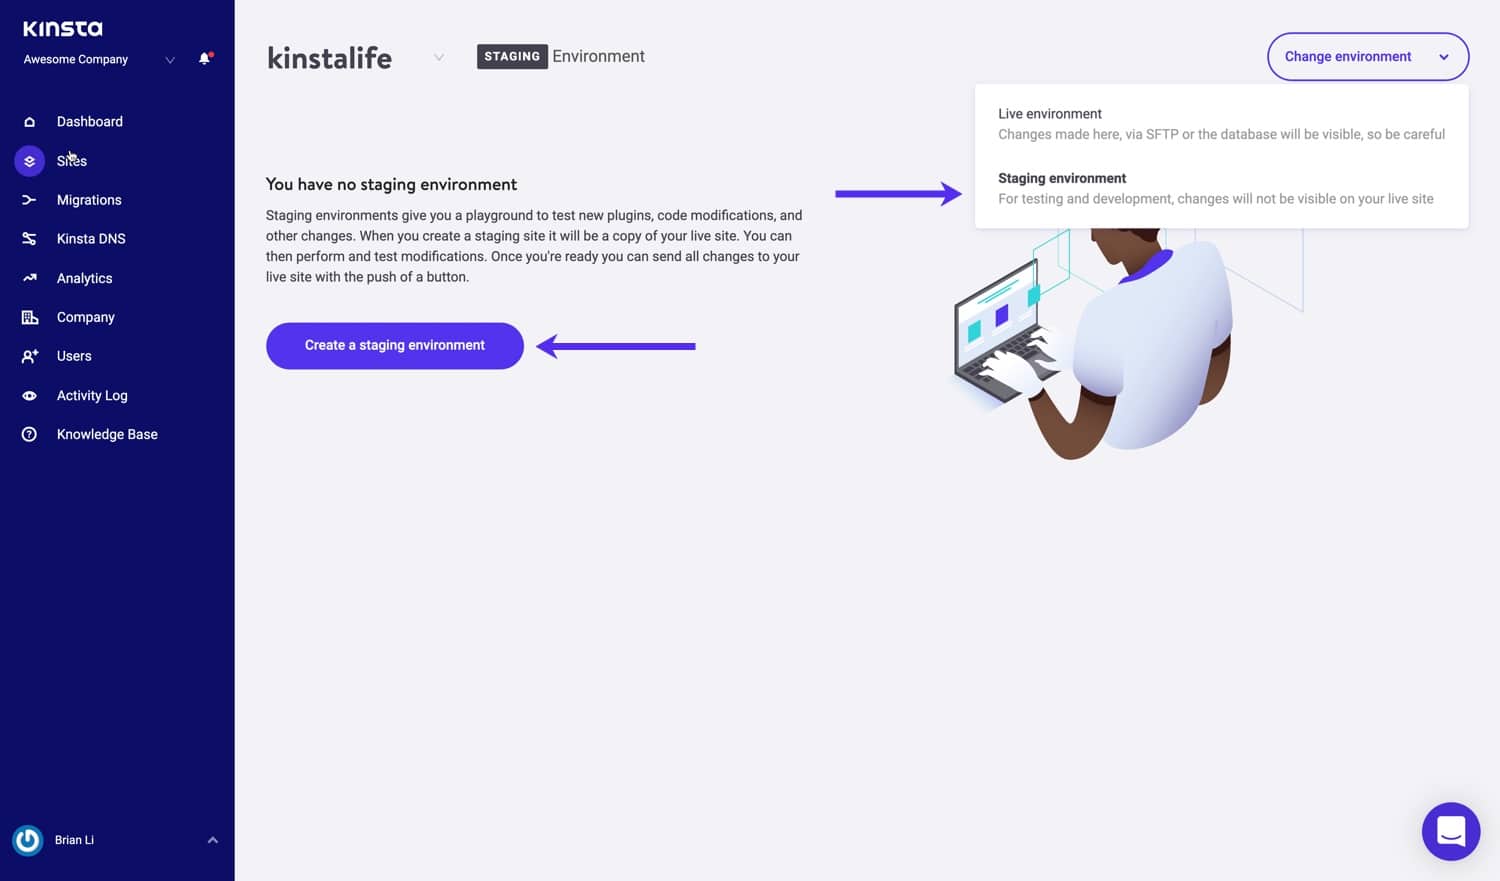
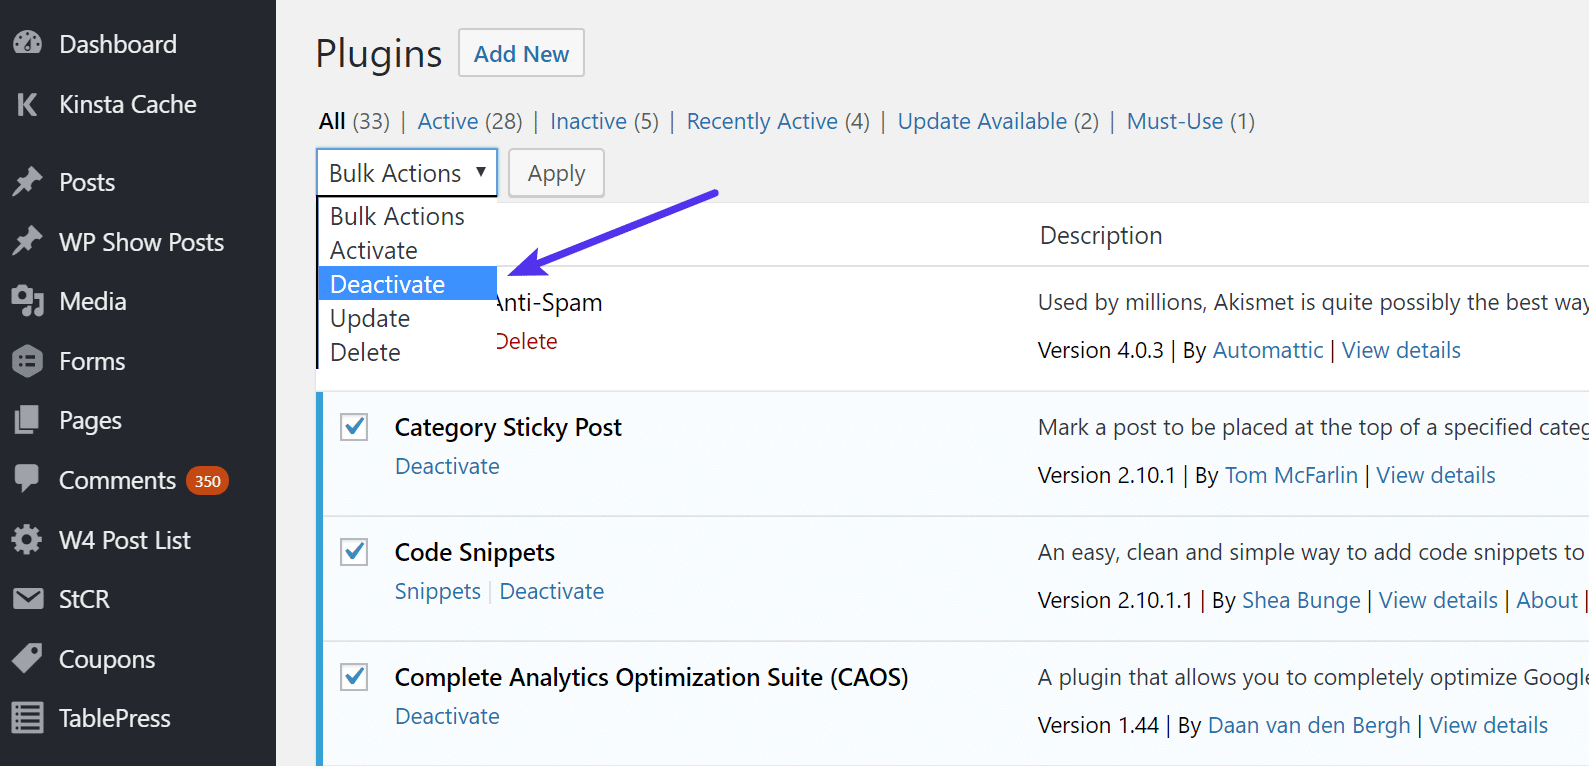
After I had my dev site up and running, the very first thing I did was bulk disable all my plugins. I’ve noticed a lot of people tend to ignore this easy step. It’s almost like thinking rebooting your computer won’t fix an issue. I used to work in computer support, so we won’t go down that rabbit hole. 🐰
The important thing is to always disable all your plugins first. This is by far one of the easiest ways to narrow down issues. Simply go to Plugins, select all of them and choose “Deactivate” from the bulk options.
After doing this response times in New Relic immediately dropped back down to normal on my site. So I knew it was a plugin causing the problem. And due to the fact that I had already done some troubleshooting above, I had a hunch it was still the “gp-premium” plugin.
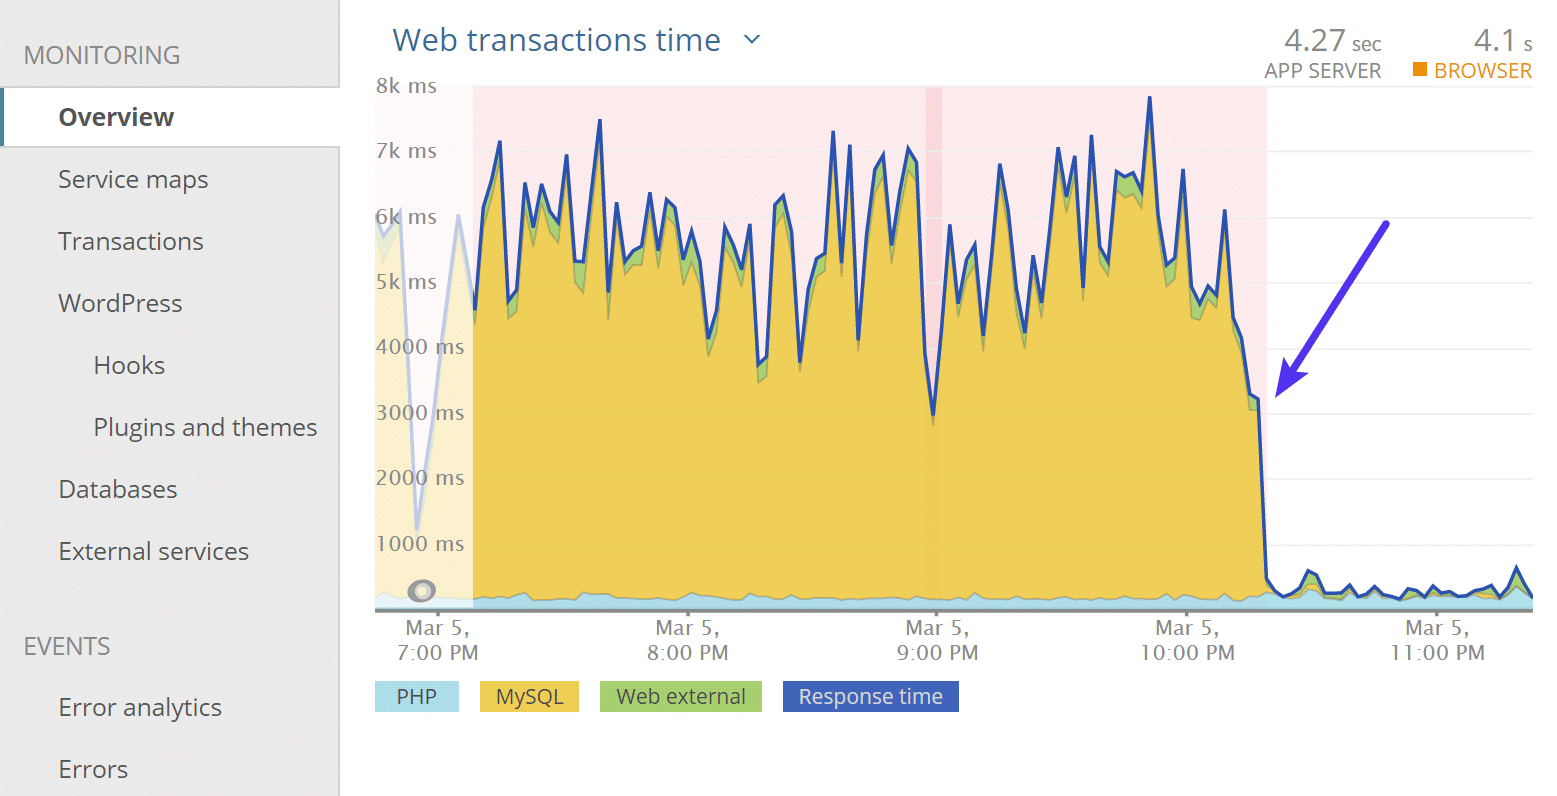
So I re-enabled the “gp-premium” plugin to verify that I could replicate the issue. And yes, load times (web transaction times) immediately went back up.
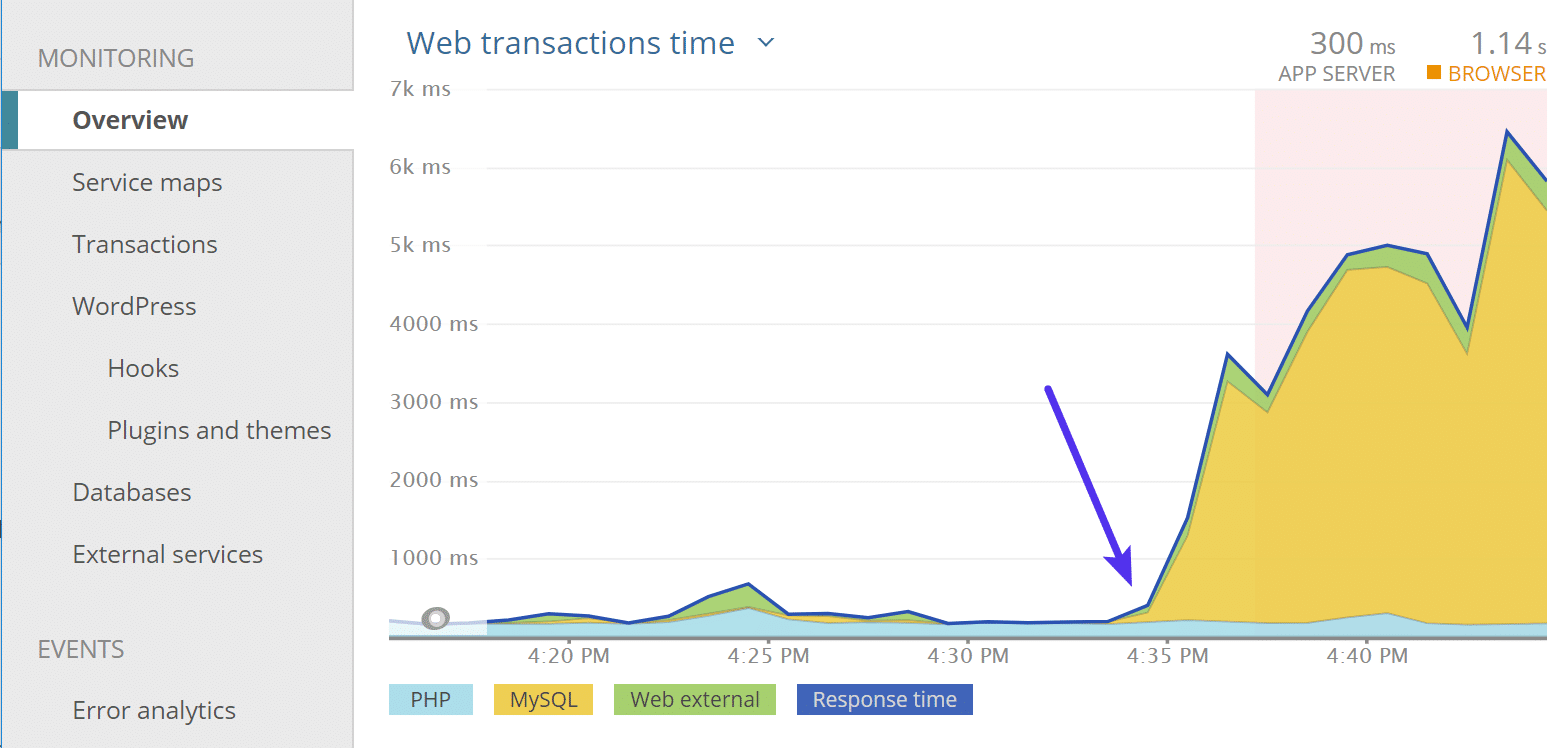
Great! So I can confirm 100% it was the plugin. But now what? That doesn’t help fix my issue. Well, due to the fact that it appeared to be coming from the image processing queue the next hint was to check CRON jobs and transients. Whenever you have queues of any type, always check these areas. In fact, I always recommend checking them. Autoloaded data is another usual culprit as well.
Suggested reading: How To Fix the WordPress Missed Schedule Error (2 Methods).
Transients are a simple form of WordPress caching with expiration times attached. To quickly view my transients, I installed the free Transients Manager plugin from Pippin Williamson. Upon launching it something again immediately caught my eye and that was a transient item called wp_image_processing_queue_process_lock.” Also, it was set to expire in 1 minute and new ones kept popping up.
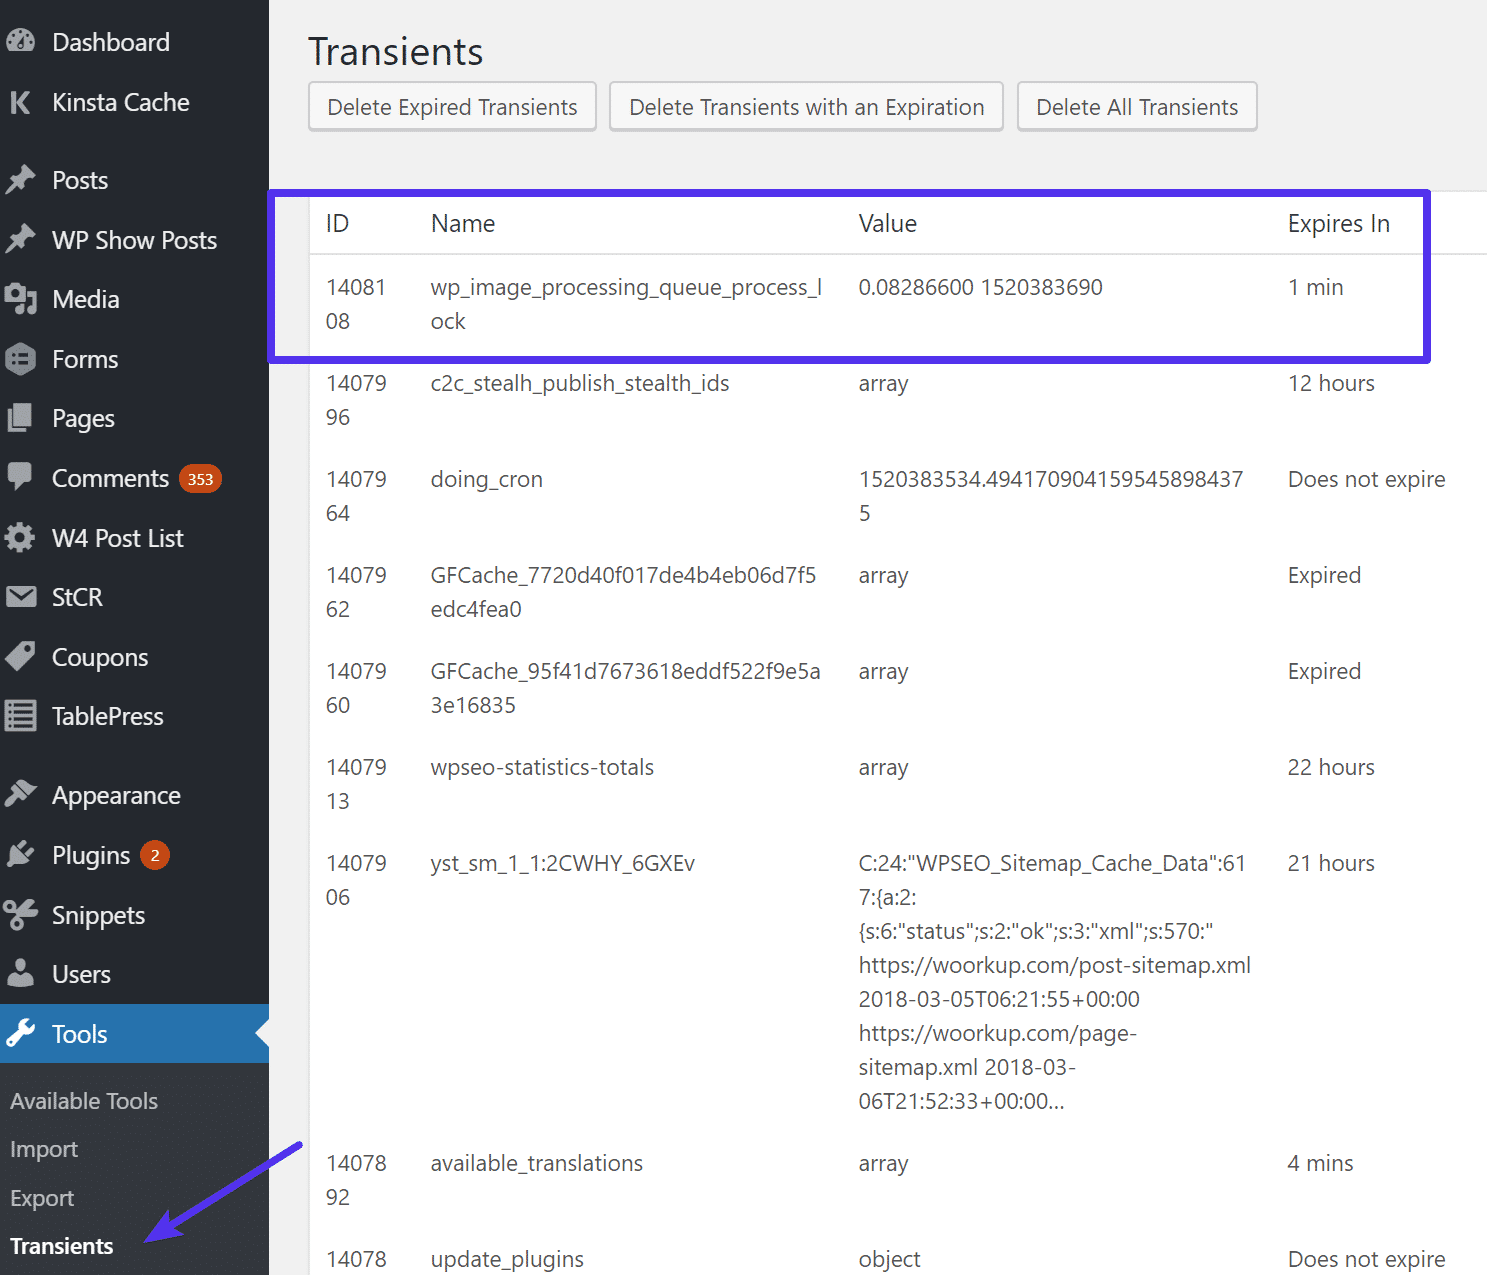
While the plugin itself does have a way to delete transients, it didn’t work. So it was then time to look in the database. So I logged into phpmyadmin. Transients are stored in the wp_options table, so I did a quick query from the “Search” tab to find any rows that contained that option name.
SELECT * FROM wp_options WHERE option_name LIKE '%wp_image_processing%'Yikes! It turns out I had 695,846 rows with %wp_image_processing%. 😲
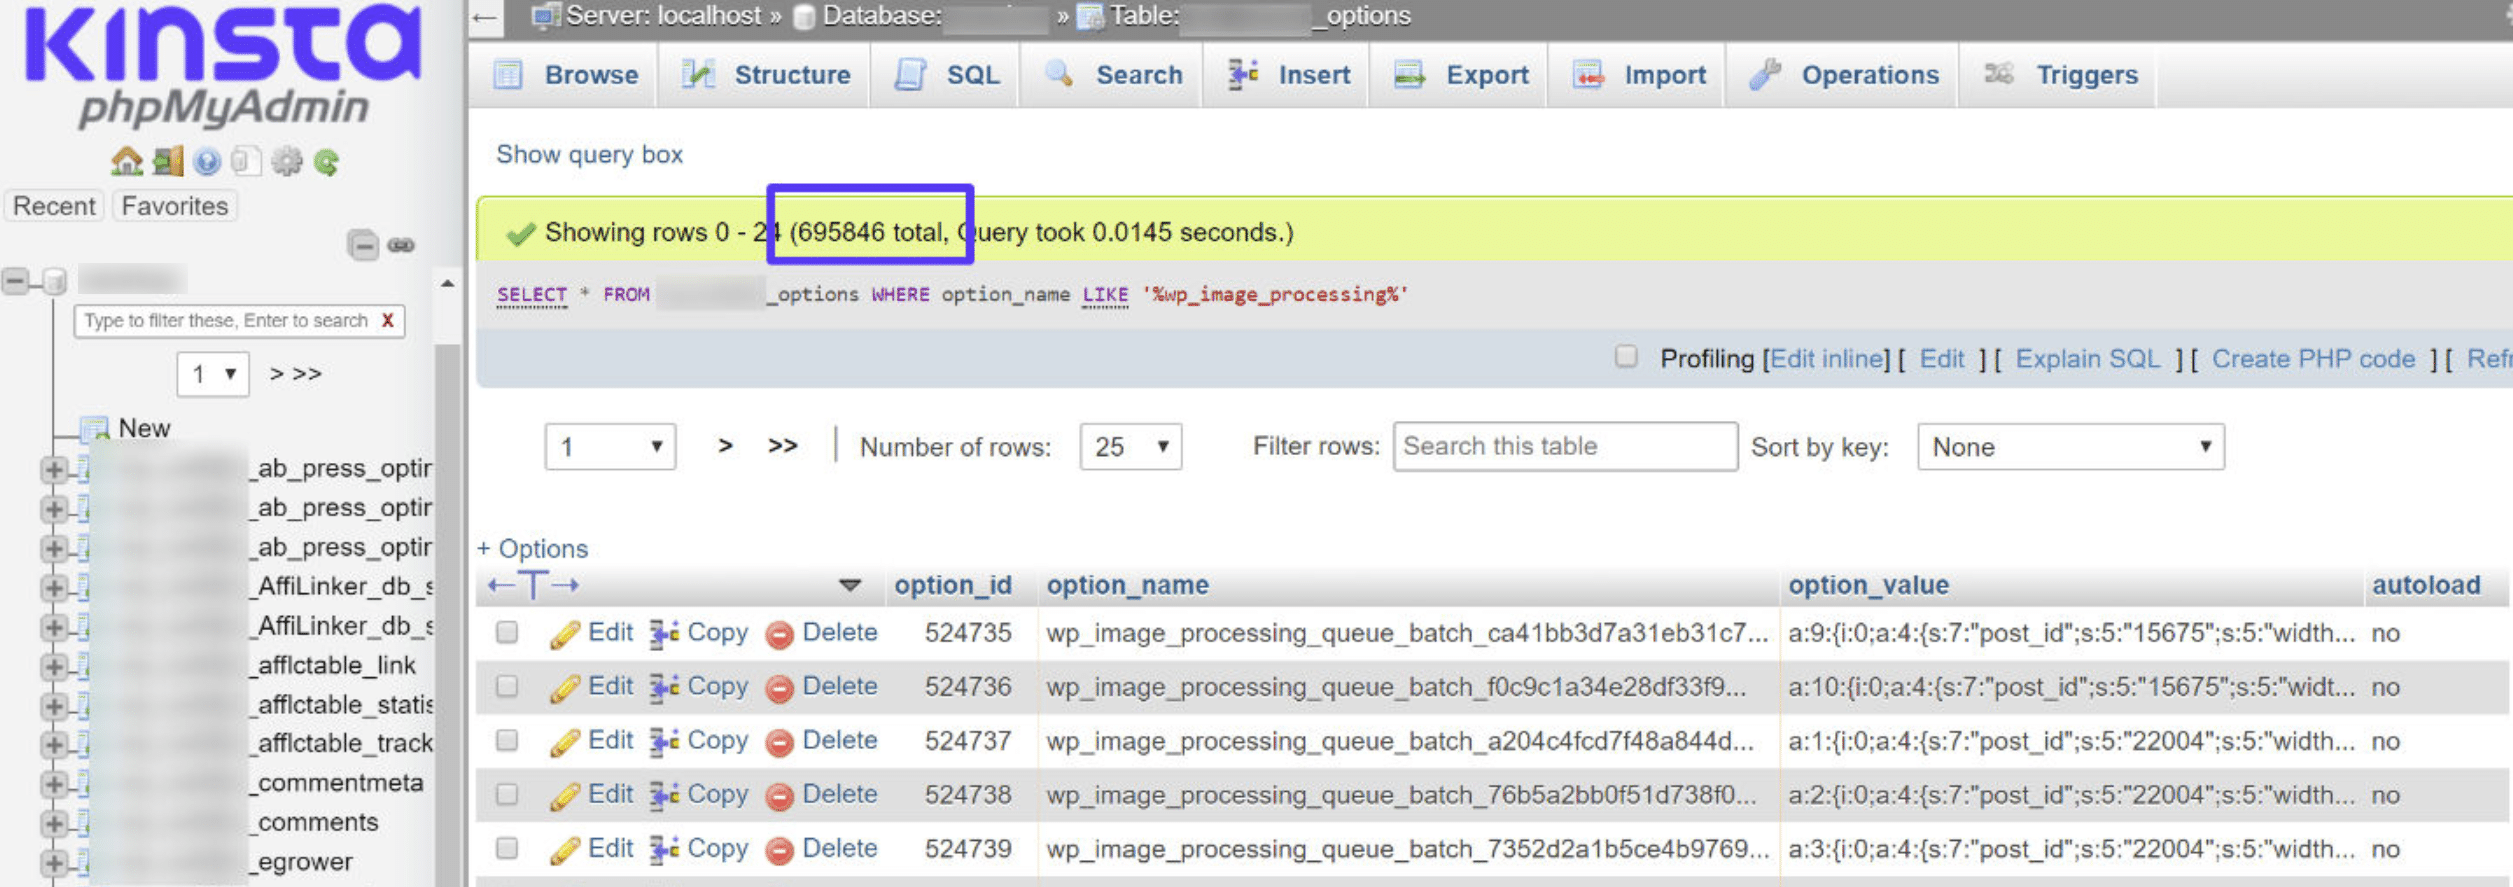
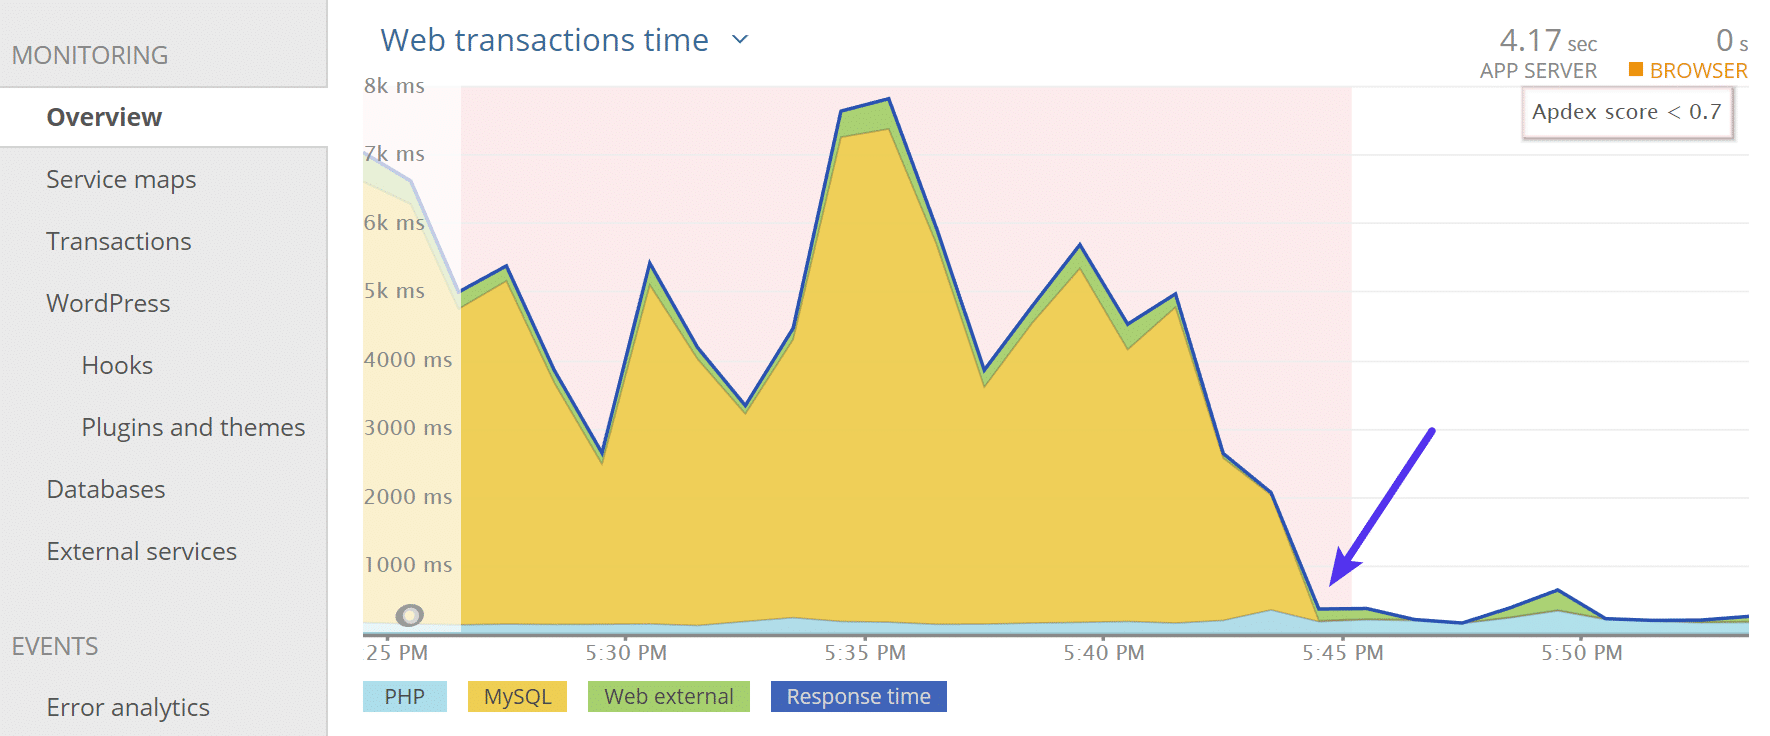
This is where staging comes in handy. Since there was no harm in destroying or testing things, I proceeded to manually delete all of the rows that contained this. I ran the following query from the “SQL” tab to delete all rows containing this option name:
DELETE FROM wp_options WHERE option_name LIKE '%wp_image_processing%'

And like magic, immediately upon deleting the rows the response times for my site went back to normal. 👏
So as I said earlier, this didn’t happen on my other sites that were using GeneratePress. They also didn’t have those extra transient rows in the database. Perhaps upon upgrading something didn’t get deleted as it was supposed to. So it appears that it’s not the developer’s fault but rather probably simply a corruption of the transient cache.
This could have happened with any plugin or theme. GeneratePress is, in fact, one of my favorite WordPress products of all time. Scared yet? Well, these are some of the joys that accompany WordPress!
If you didn’t understand any of the above, well then I highly recommend looking at the rest of the steps below when it comes to troubleshooting issues like these.
4. Invest in Premium Hosting With World-Class Support
Problems like the above are exactly why it’s important to invest in a premium managed WordPress host like Kinsta.
Unlike what some people might lead you to believe, there is no architecture or host that exists that will magically fix bad code. Even though my woorkup site is hosted at Kinsta, little things like a bad plugin update, or in this case, corrupt transients, can bring WordPress to its knees! This is one reason why we have automated backups, staging environments, and a New Relic integration. These features and tools help protect your site and troubleshoot issues fast.
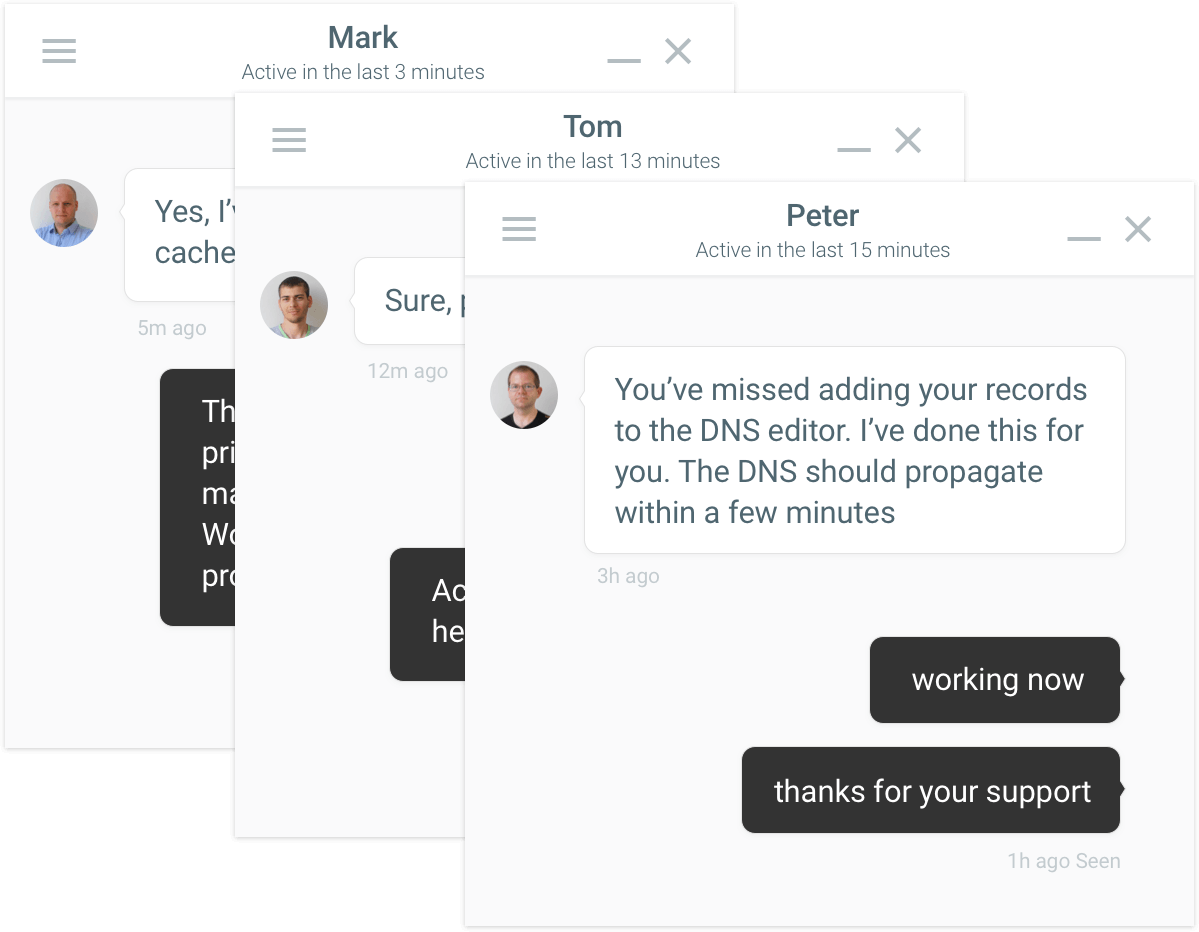
This is also where our expert support team here at Kinsta can help if you run into issues like the crazy one described above. Our support team deals with unique and complex problems like these every day. And even though we can’t fix bad code for you, we can usually at least help point you in the right direction. This might involve a similar process such as enabling New Relic, letting it run for a while, and then letting our team become the WordPress detectives for a moment.
If you aren’t a Kinsta client, we recommend that whatever host you choose to go with, make sure their support team is top-notch! We take this so seriously that we hire less than 1% of applicants who apply to be part of our team.
And of course, infrastructure does matter when it comes to performance and not buckling under the load. Here are a few ways Kinsta helps keep your site running fast so you don’t experience performance issues:
- We utilize isolated LXC software containers meaning no resources are shared.
- We allow customers to choose from 20 data centers around the globe at no extra charge. This decreases latency no matter where you’re located.
- We utilize a powerful cloud infrastructure that ensures lightning-fast network speeds.
- We always implement the latest and greatest versions of PHP. We were the first managed host to deploy PHP 7.2, which 3x faster than PHP 5.6. We also have PHP 7.3 available, which is on average 9% faster than PHP 7.2. PHP 8.1 is also now available. Check out our PHP benchmarks.
- We’ve paired up with a CDN provider that was built from the ground up with a focus on high-performance.
You can check out all the other ways Kinsta is different.
5. Need Even More Help? There Are a Maintenance Companies for That
Over the past five years or so a new type of company has emerged in the industry: WordPress maintenance companies. These companies offer slightly different services than we do at Kinsta and can in some cases take over all your tedious WordPress tasks. Here are just a few examples:
- Google Search Console Setup
- Google Analytics integration
- Weekly keyword ranking reports + analytics reports
- Social media analytics app
- Mobile + tablet optimization
- Plugin development
- Unlimited edits (that’s right, some even will do small tasks such as updating your logo, adding a WooCommerce product, etc)
And yes, a lot of them offer daily or weekly uptime and performance monitoring. Below are some WordPress maintenance companies you should check out. Note: We take our recommendations very seriously!
SkyrocketWP
SkyrocketWP offers WordPress maintenance service, support, and a hosting solution built to handle WordPress for people who’d rather be growing their businesses. We even did a case study with them make sure you take a look!

WP-Tonic
WP-Tonic offers a truly boutique concierge support and maintenance service for busy business owners. Don’t have any time to fix your WordPress problems? Let WP-Tonic take care of it for you. They also run a popular podcast in which they interview WordPress businesses owners and developers to get the inside scoop into what is happening in the industry. Make sure to also check out our interview with their founder.

WP Buffs
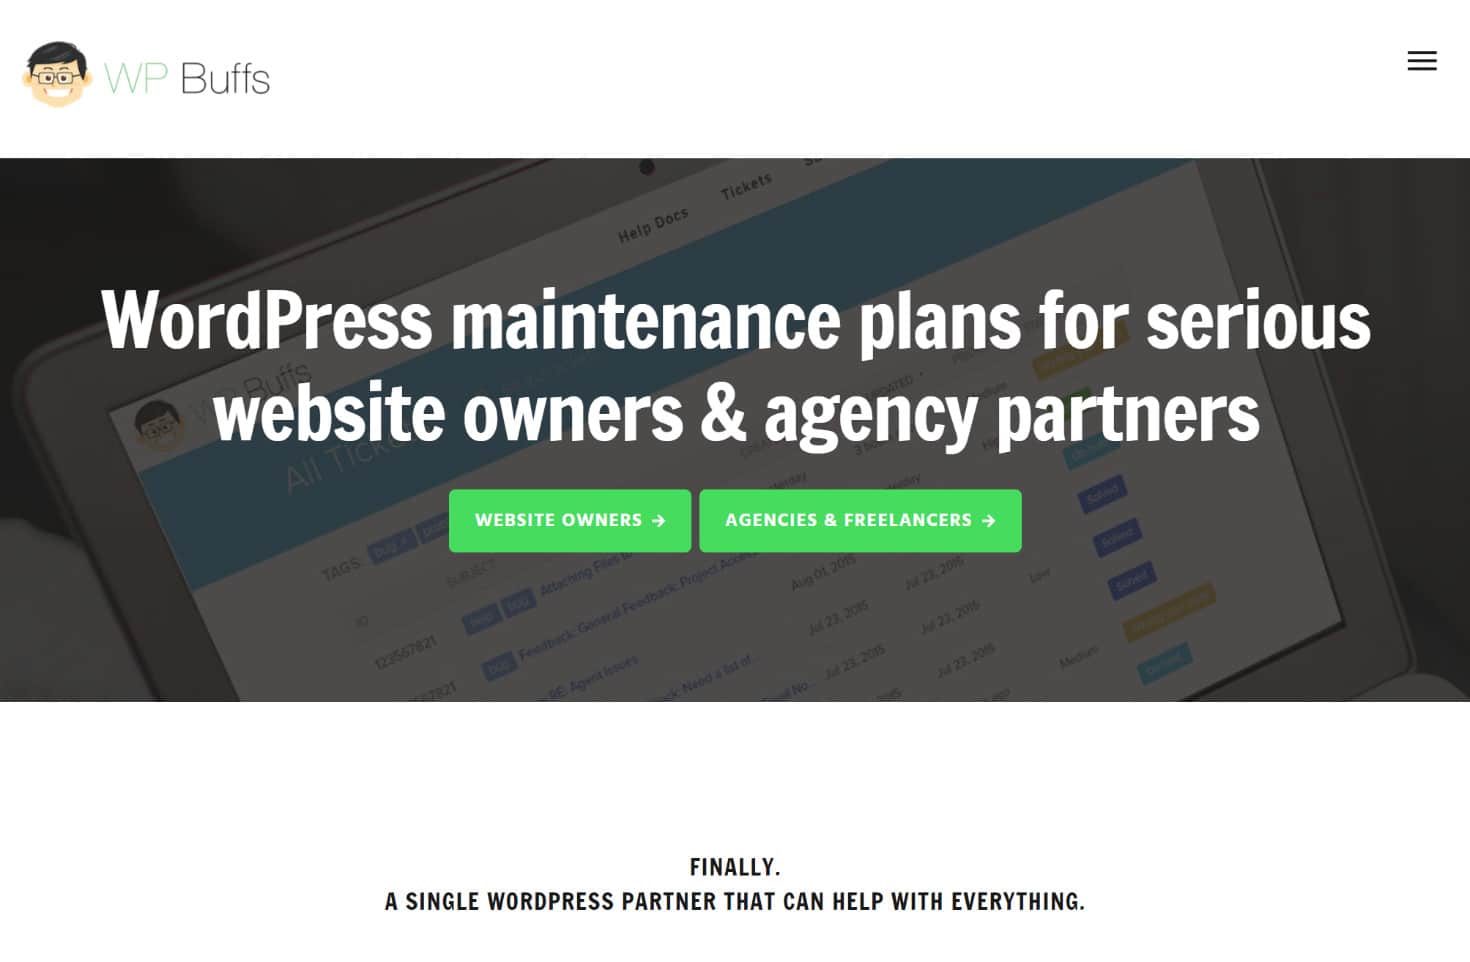
WP Buffs offers WordPress care plans for serious website owners and white-label agency partners. As they say on their page: “Say hello to your new WP CTO!” Btw. WP Buffs is proudly hosted by Kinsta.
6. Don’t Be Afraid to Raise Issue With Developer
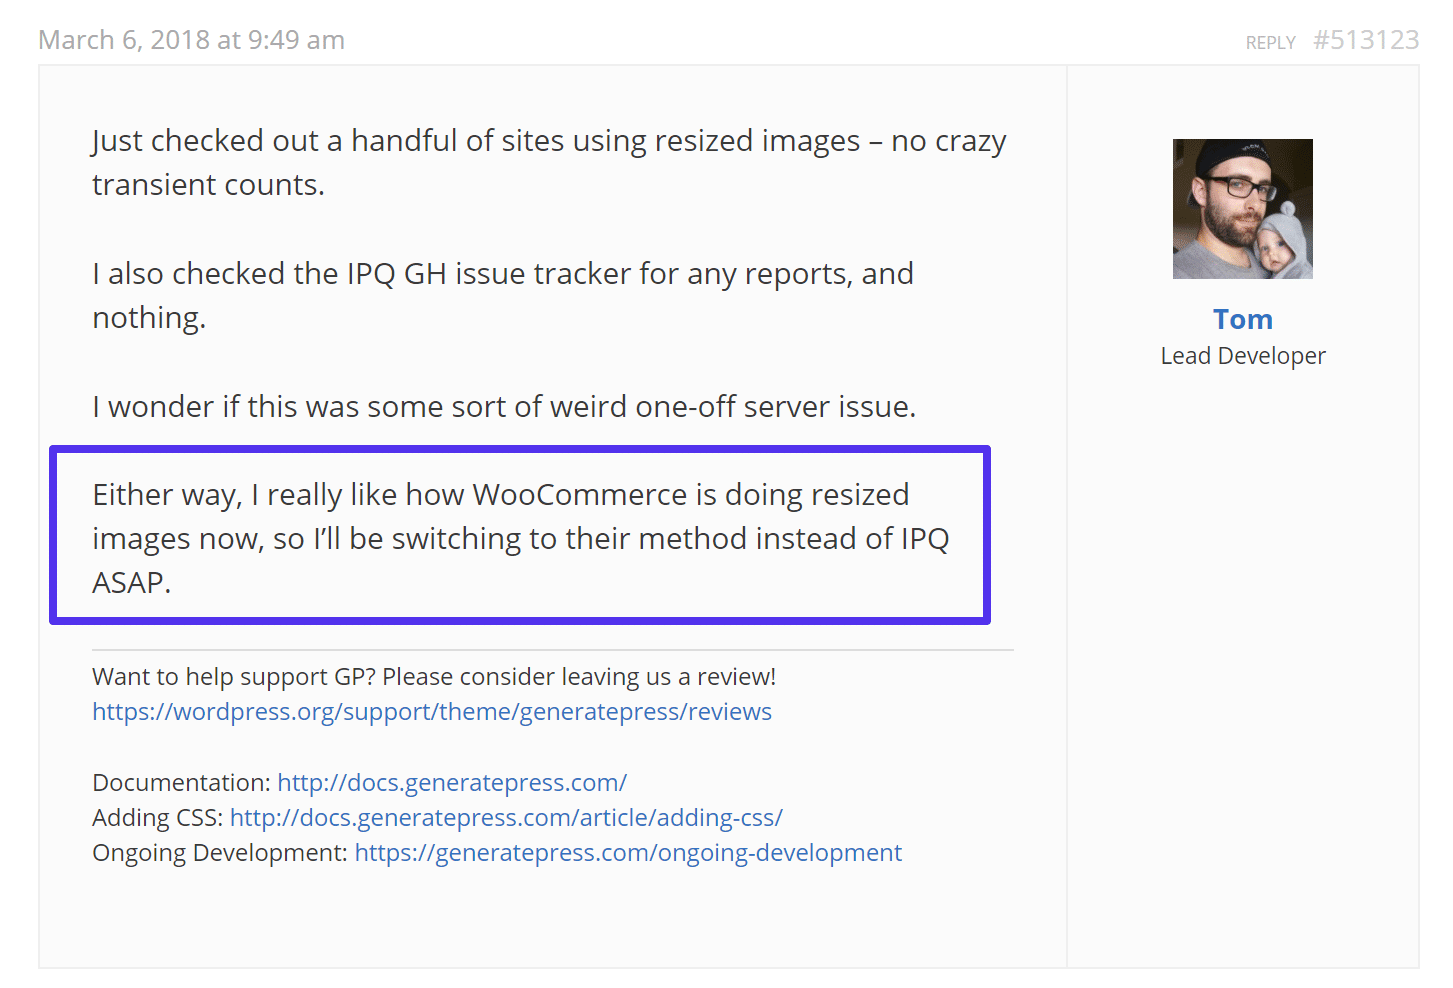
After you narrow down what might be the cause of your WordPress performance issue, don’t be afraid to raise the issue with the developer! A lot of times developers are more than happy to help, and in fact, want to know about things when they break so that they can roll out fixes for everyone.
I reached out to Tom, the developer of GeneratePress and he responded right away, as he always does. We are tossing up the problem to corrupt transients, but as you can see he is actually going to be switching up their image queueing method (partially because of this). So your feedback as a user can definitely help developers make higher-level decisions regarding what might be best to implement or change in their plugins or themes.
7. You Can Always Hire a WordPress Developer
If worst comes to worst you can always hire a WordPress developer to fix your problem. Perhaps you discovered that the plugin you’re using does have some bad code and the creator can’t or won’t fix it. Or perhaps you need additional performance optimizations beyond the scope of our support team here at Kinsta.
The tough part about hiring a developer is how do you find someone that is reputable and great at what they do?
We highly recommend Codeable as they align similarly with the same selective process we use for our team here at Kinsta. Their developers are all pre-screened before being allowed to join the service with Codeable staff personally reviewing portfolios and CVs. They have over 25,000 clients and only 300 WordPress experts. Only 2% of applicants are accepted. They only want the best of the best, which in turn can save you a lot of time and frustration as a customer.
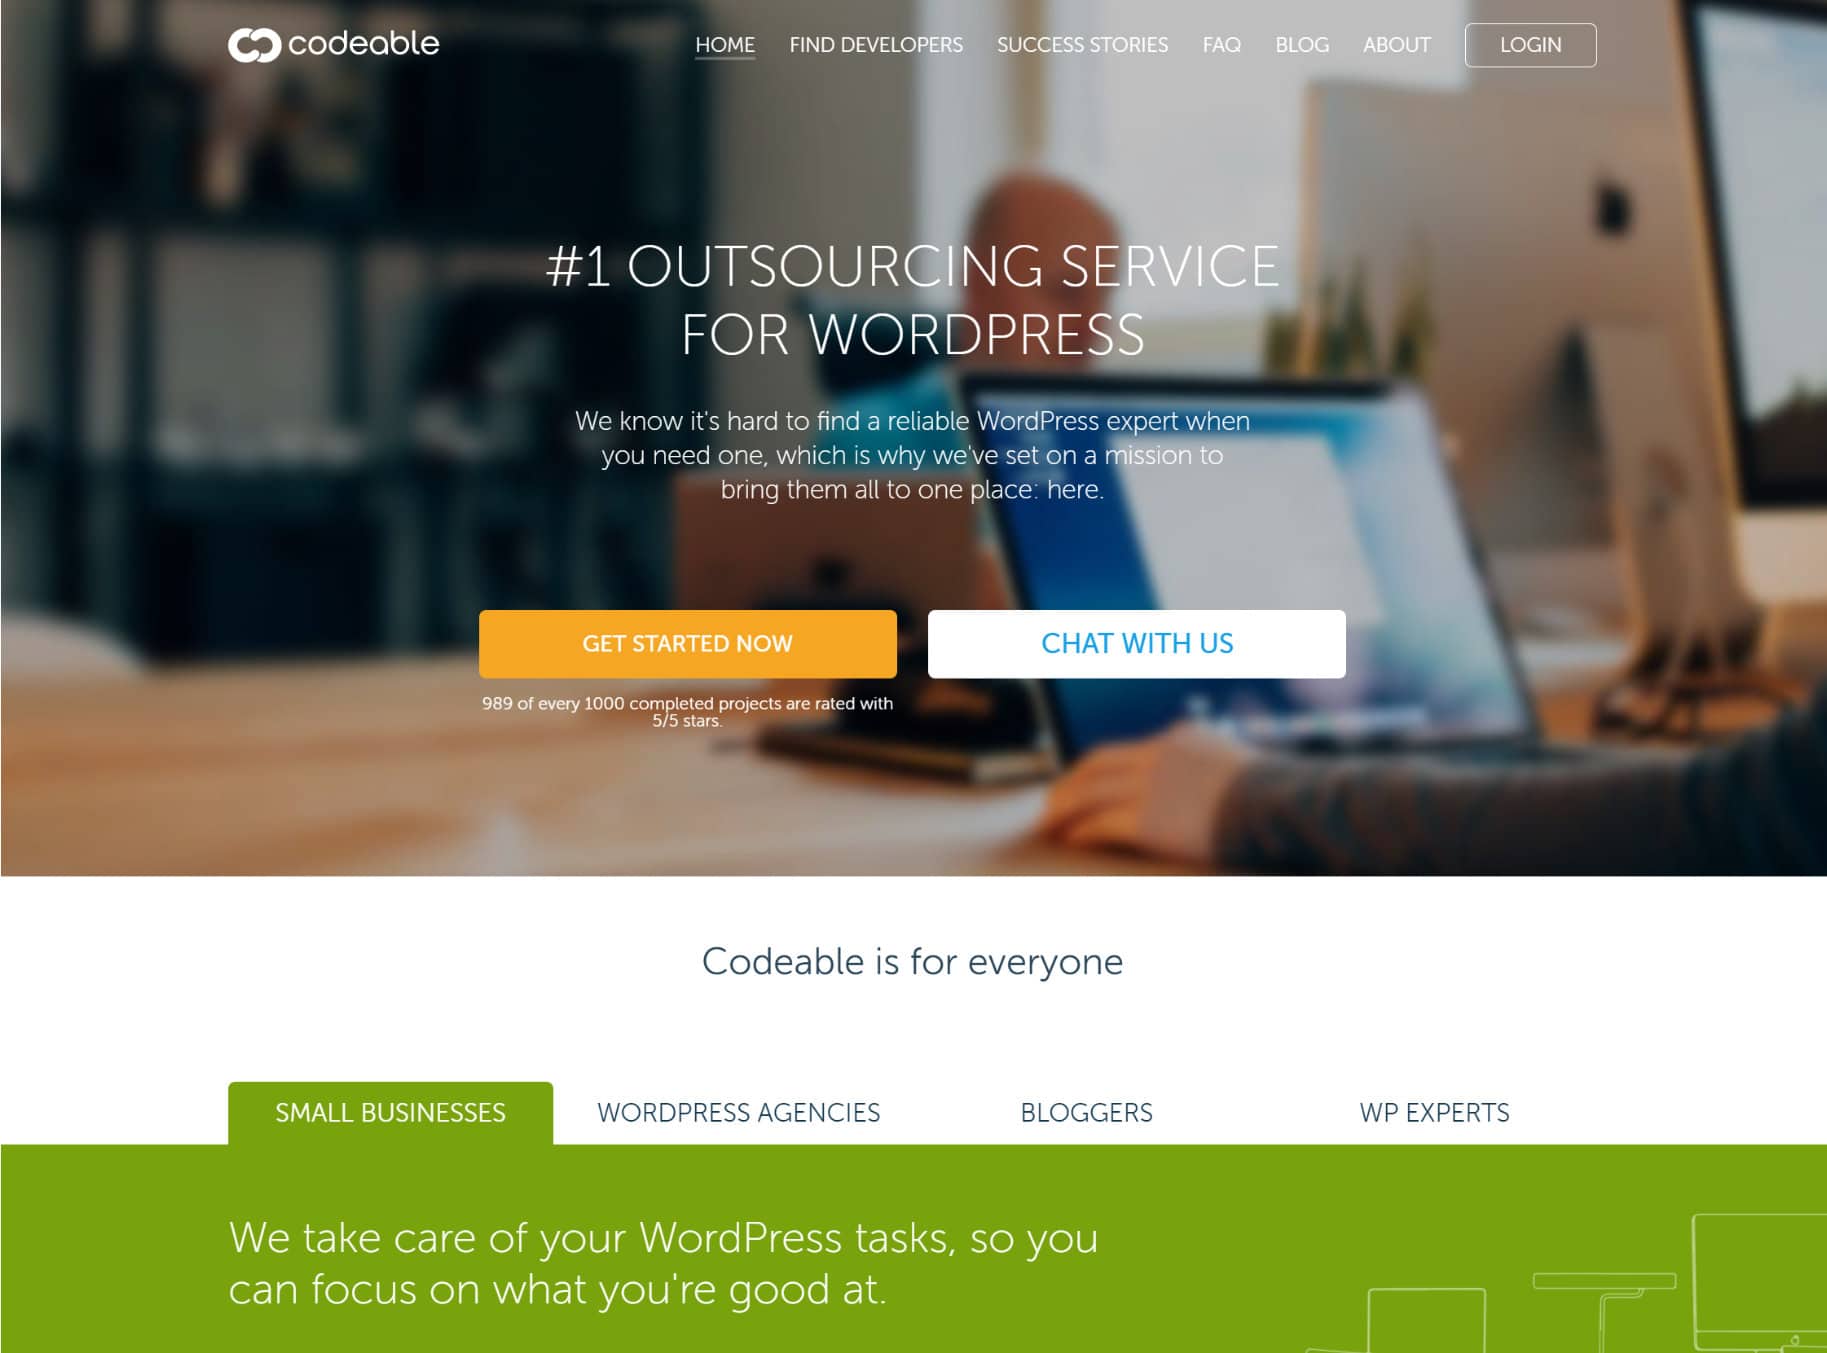
They are dedicated to providing WordPress outsourcing services and focuses entirely on matching talented developers with clients. We had the pleasure of interviewing Per Esbensen, the CEO of Codeable, and it’s refreshing to see their dedication to building a community of WordPress developers.
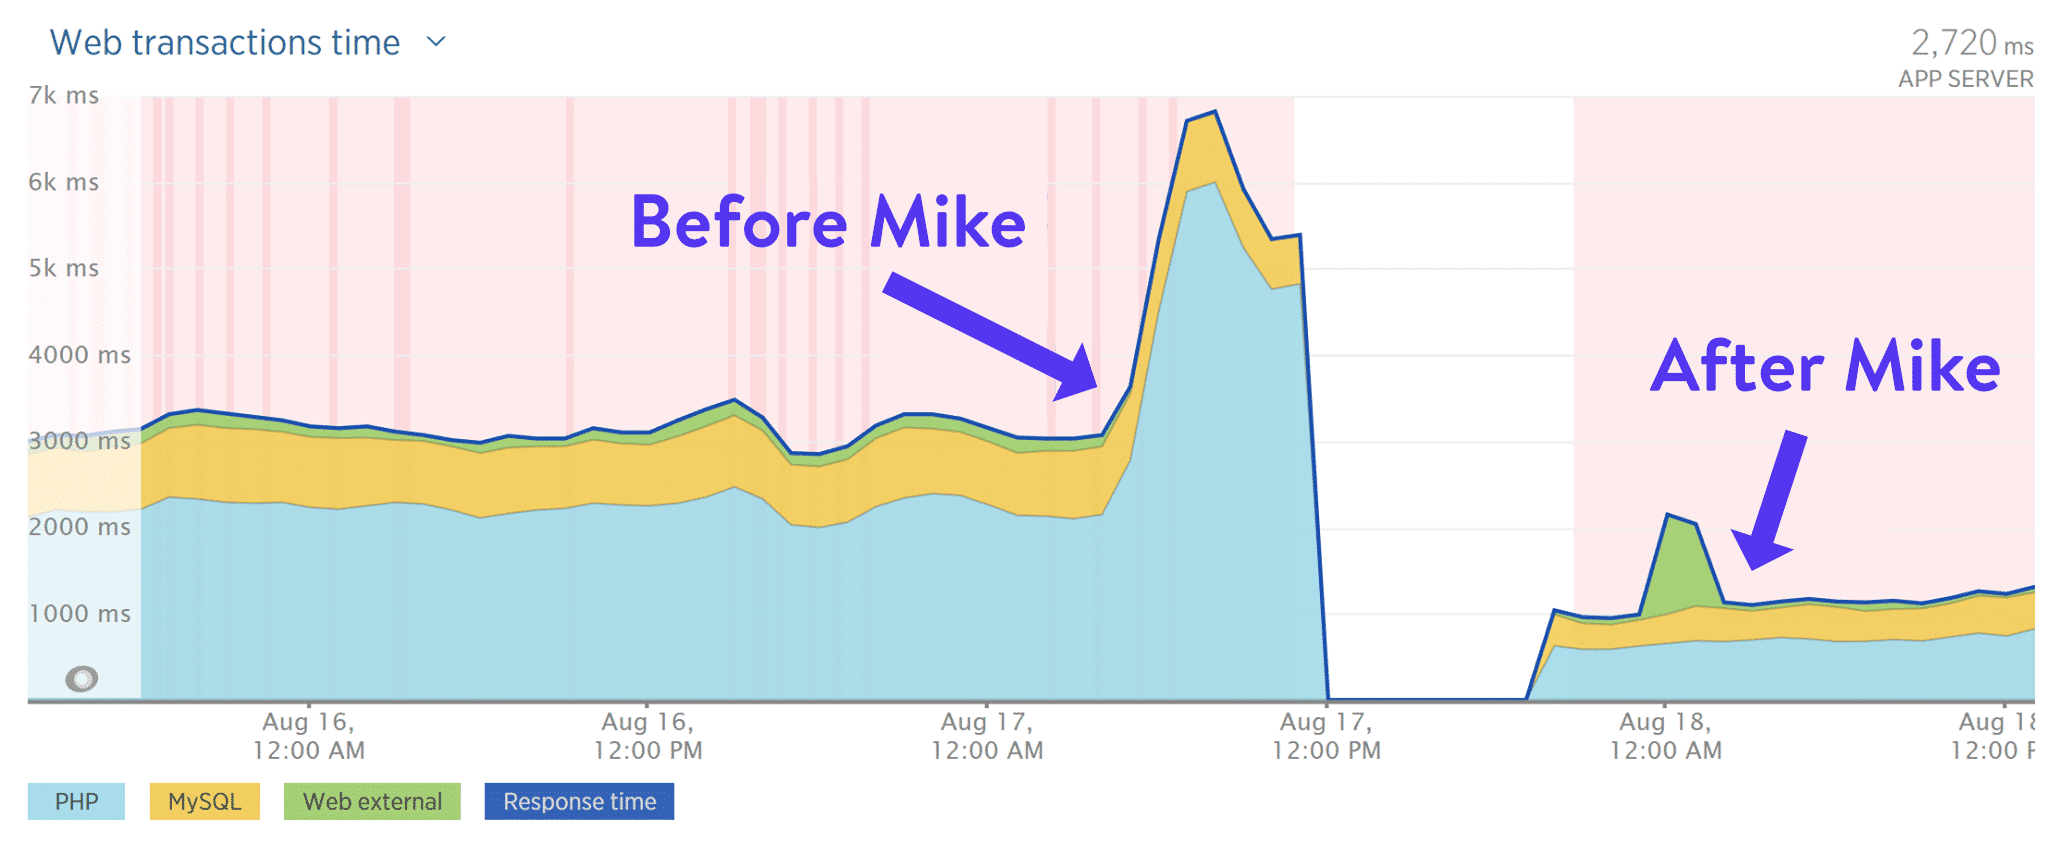
We also have to give a personal shout-out to Mike Andreasen, a full-time Codeable developer specializing in performance optimization, who has helped many clients here at Kinsta with complex installations take their site to the next level.
Additional Resources
We are probably a little more obsessed than most when it comes to performance here at Kinsta. Because of that, here are some additional resources we’ve written up to help resolve some of your WordPress debugging performance woes:
- Finding WordPress Performance Bottlenecks with New Relic
- How To Use Query Monitor
- How To Eliminate Render-Blocking JavaScript and CSS
- How To Fix the Leverage Browser Caching Warning
- How To Fix a 500 Internal Server Error
- How To Fix a 504 Gateway Timeout Error
- How To Fix a 502 Bad Gateway Error
Summary
Whether you’re tech-savvy or not, there are always solutions available to you when it comes to solving WordPress performance issues. The first obvious recommendation is set yourself up for success by choosing a hosting provider that has not only a rock-solid infrastructure but also a world-class support team to back it up. The last thing you want to happen is your WordPress site goes down or starts to crawl simply because you didn’t know which steps to take next.
Take advantage of the amazing tools out there like New Relic which will simply save you time when debugging issues. And when it comes down to it, there are tons of talented WordPress developers in the community. Don’t be afraid to hire one.
Have you experienced any performance issues where you just felt like throwing in the towel? If so, let us know below in the comments!

