
There are a lot of options you have as a website owner when it comes to running speed tests to check performance. Previously we took an in-depth look at the Pingdom tool. Today we want to dive into how to better use and understand the data from the popular website speed test tool GTmetrix.
Tools like this rely on grading systems and scores, along with warnings of what might be wrong on your site. Sometimes these can be downright confusing, and so taking some time to interpret what they actually mean, can help you not just increase your scores, but also the performance of your site, which is what really matters.
GTmetrix was developed by GT.net, a company based out of Canada, as a tool for their hosting customers to easily determine the performance of their site. Besides Pingdom, it is probably one of the most well known and used speed testing tools on the web today!
In fact, the reason we are writing this is that we have a lot of Kinsta customers that are always asking us how to follow the advice they see on their GTmetrix reports. Compared to other developer tools, GTmetrix is pretty easy to use and the beginner can pick it up pretty quickly. It uses a combination of Google PageSpeed Insights and YSlow to generate scores and recommendations.
GTmetrix Analysis Options
The basic version of GTmetrix is completely free and you can gain access to a number of options simply by signing up for an account. They also have premium plans, but in today’s post, we will be using the free version. If you have an account you can use specify a number of additional analysis options.
The first is the ability to choose the location in which you want to test your URL. The physical location you choose is actually very important as it relates to where your website is actually hosted. The less latency, the faster your load times. Currently available locations include:
- Dallas, USA
- Hong Kong, China
- London, UK
- Mumbai, India
- Sydney, Australia
- São Paulo, Brazil
- Vancouver, Canada
You can choose which browser you want to use. You can test with Chrome (Desktop) and Firefox (Desktop). Mobile versions are available in their premium plans. They also allow you to change the connection speed, which means you can simulate various connection types to see how they affect your page loads.

Additional options include the ability to create a video. This can help you debug issues as you can see how the page renders. The AdBlock Plus is a nice feature. If you are running a 3rd party ad network such as Google Adsense, you can enable this option to see the full impact ads have on your load times.
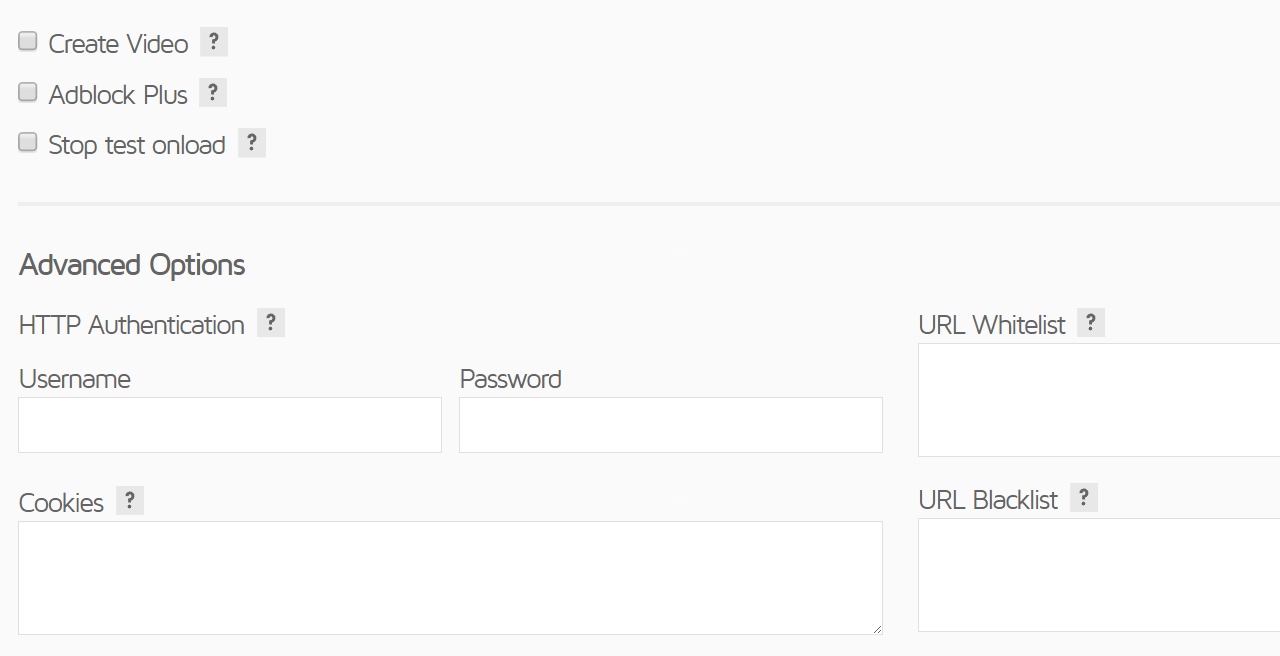
Additional options include stopping the test onload (which we will dive into later), being able to send a cookie along with your request, use HTTP authentication, the ability to whitelist and blacklist URLs, screen resolution and device pixel ratio, and user agent override.
Analysis with the GTmetrix Speed Test Tool
A web page is made up of different assets, such as HTML, JavaScript, CSS, and images. Each of these generates requests to render what you see on your website. Typically the more requests you have, the slower your website will load. That is not always the case, but it is true most of the time.
Below we are going to break up each GTmetrix section and explain in more detail what the information means as it pertains to the overall performance of your website and what to do about the recommendations. Remember not to obsess too much on the scores, but rather on making actual speed improvements on your site.
GTmetrix Summary (Performance Scores and Details)
When you run your WordPress website through GTmetrix it generates a performance report which includes your “GTmetrix Grade” and “Web Vitals”.
The GTmetrix Grade is calculated from two metrics – Performance and Structure.
- GTmetrix Performance is the performance score from the Lighthouse site audit tool
- GTmetrix Structure is a proprietary performance metric that measures the overall performance of a page.
In 2020, Google introduced a standardized set of web performance and user experience metrics called Web Vitals. Web Vitals consists of a variety of metrics, but the ones that GTmetrix takes into account are Largest Contentful Paint (LCP), Total Blocking Time (TBT), and Cumulative Layout Shift (CLS).
- Largest Contentful Paint (LCP) is the amount of time it takes for the largest part of your page to load. For some sites, the LCP can be a large hero image, while on other sites, LCP may refer to the body text.
- Total Blocking Time (TBT) is the amount of time a page is blocked before a user can interact with it. Render-blocking CSS and JS can have a huge impact on TBT.
- Cumulative Layout Shift (CLS) refers to the shifting of elements while a page is loading. For example, the layout of a page containing embedded tweets can shift dramatically as the page loads.
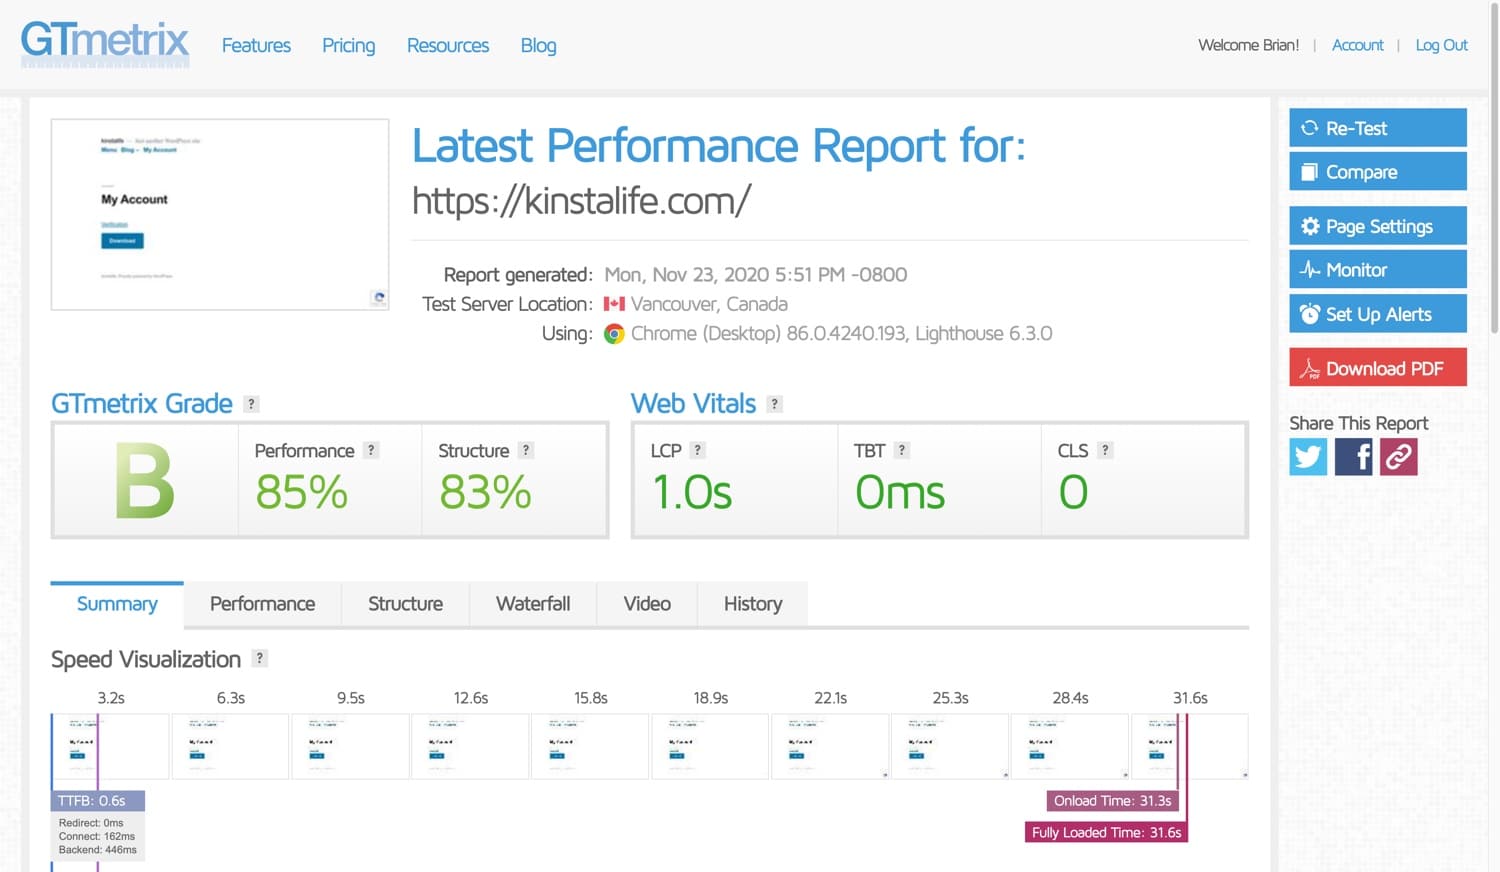
In our example, we are using our case study domain kinstalife.com, which is hosted on Kinsta. In our first speed test, our site registered the following stats.
- GTmetrix Grade – B
- GTmetrix Performance – 85%
- GTmetrix Structure – 83%
- LCP – 1.0s
- TBT – 0ms
- CLS – 0
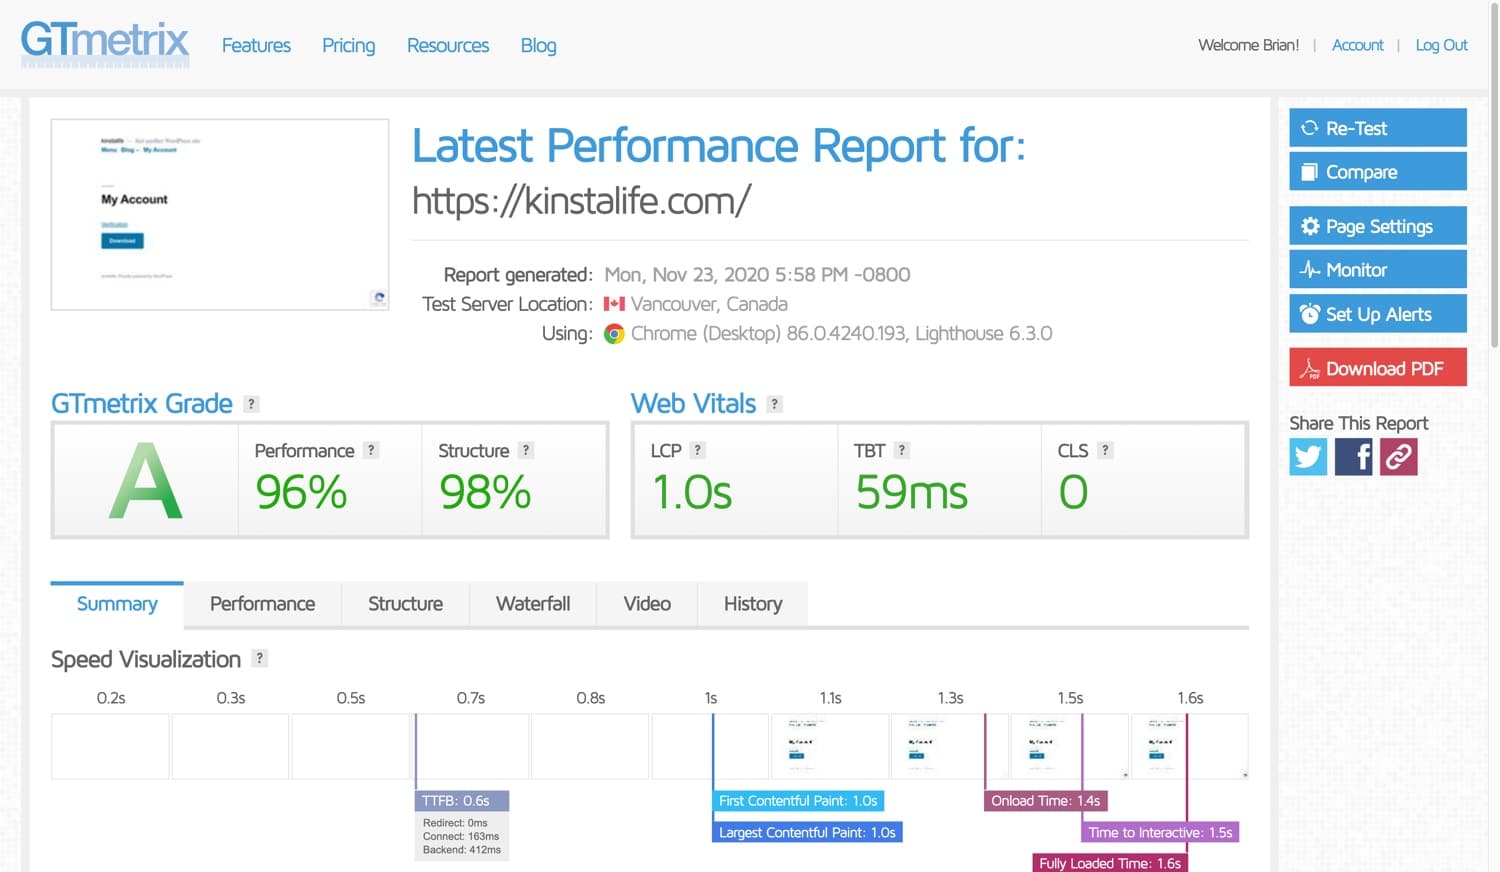
We then ran an additional test and now our GTmetrix Grade is “A”! What is that all about? You might notice this as well if you are running your website through the GTmetrix speed test tool multiple times. One of the reasons this happens is because of caching, both DNS caching and server caching. Find out why further below in our waterfall analysis.
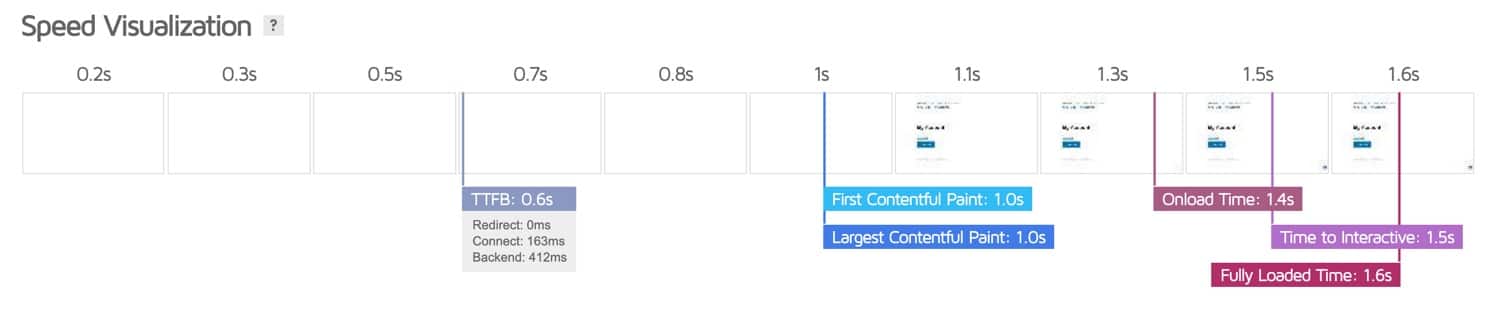
The GTmetrix summary page also contains a speed visualization, which shows a timeline of key events during a page load. In the screenshot below, you can see TTFB, FCP, LCP, onload time, time to interactive, and fully loaded time for kinstalife.com.
Performance
Next up is the GTmetrix “Performance” tab, which shows a number of useful metrics sourced from Lighthouse performance data. In addition to the LCP, TBT, and CLS shown on the summary page, the “Performance Metrics” section also shows Speed Index (SI), Time to Interactive (TTI), and First Contentful Paint (FCP).
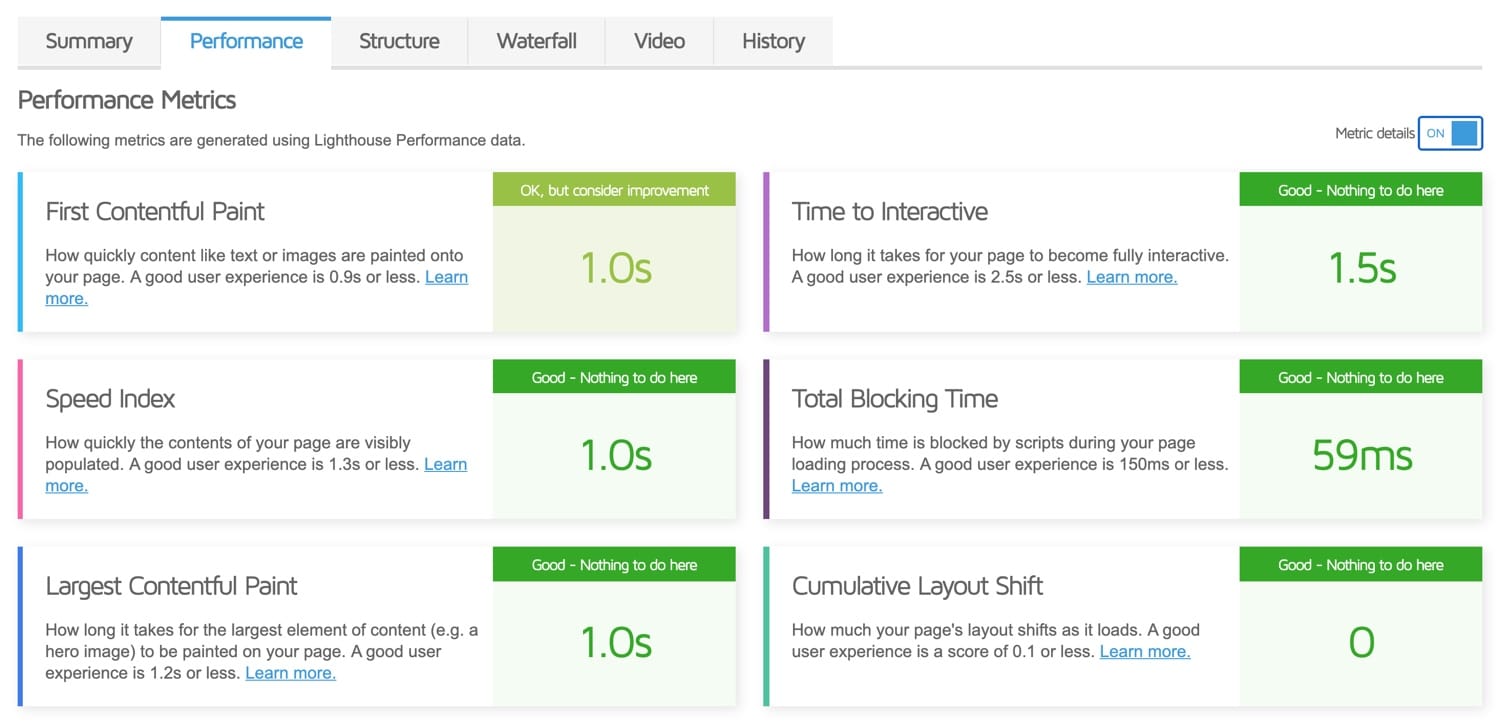
While the “Performance Metrics” section doesn’t show you exactly what you need to fix, it does give a nice overview about which key user experience metrics you can improve on.
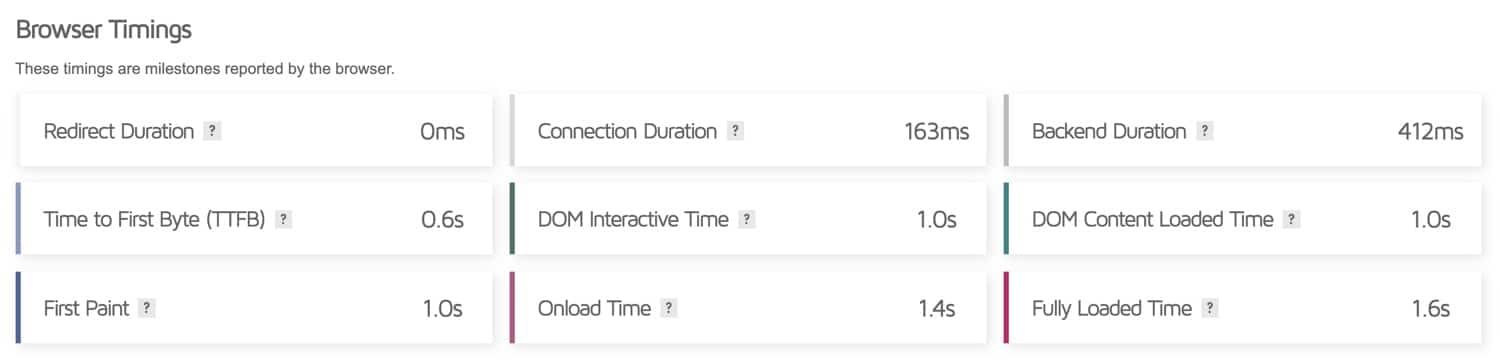
Further down the page, GTmetrix also shows a few more traditional “Browser Timing” stats including Onload Time, Time to First Byte, Fully Loaded Time, and more. In the past, these traditional metrics were very important. However, with Google paving the way with standardized metrics with Web Vitals, we recommend optimizing for those instead. In most cases, you’ll find that optimizing for Web Vitals will also result in good browser timing metrics.
Structure
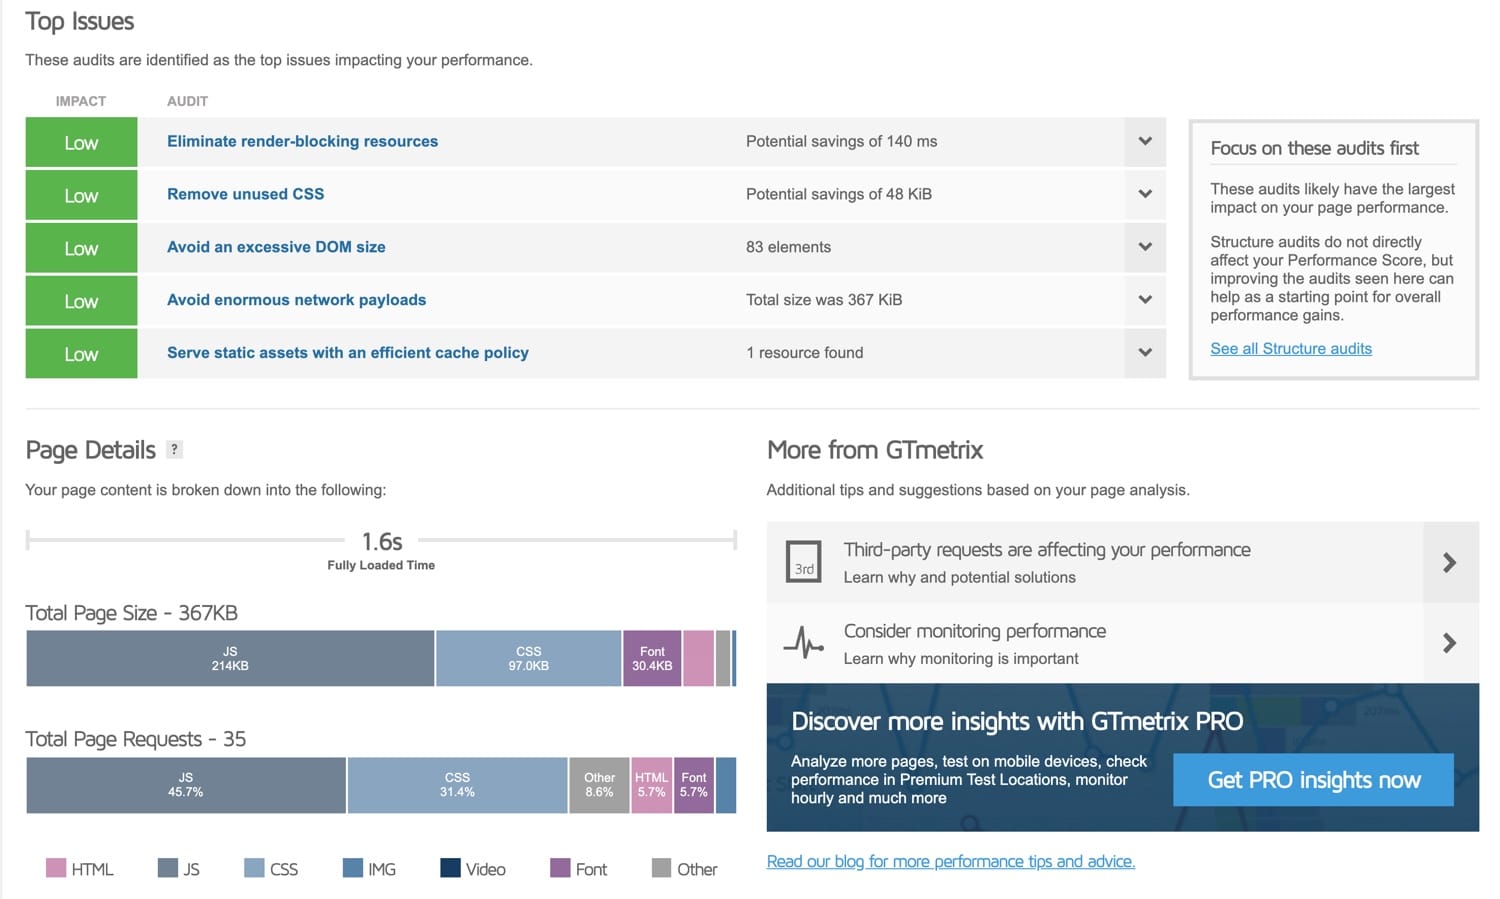
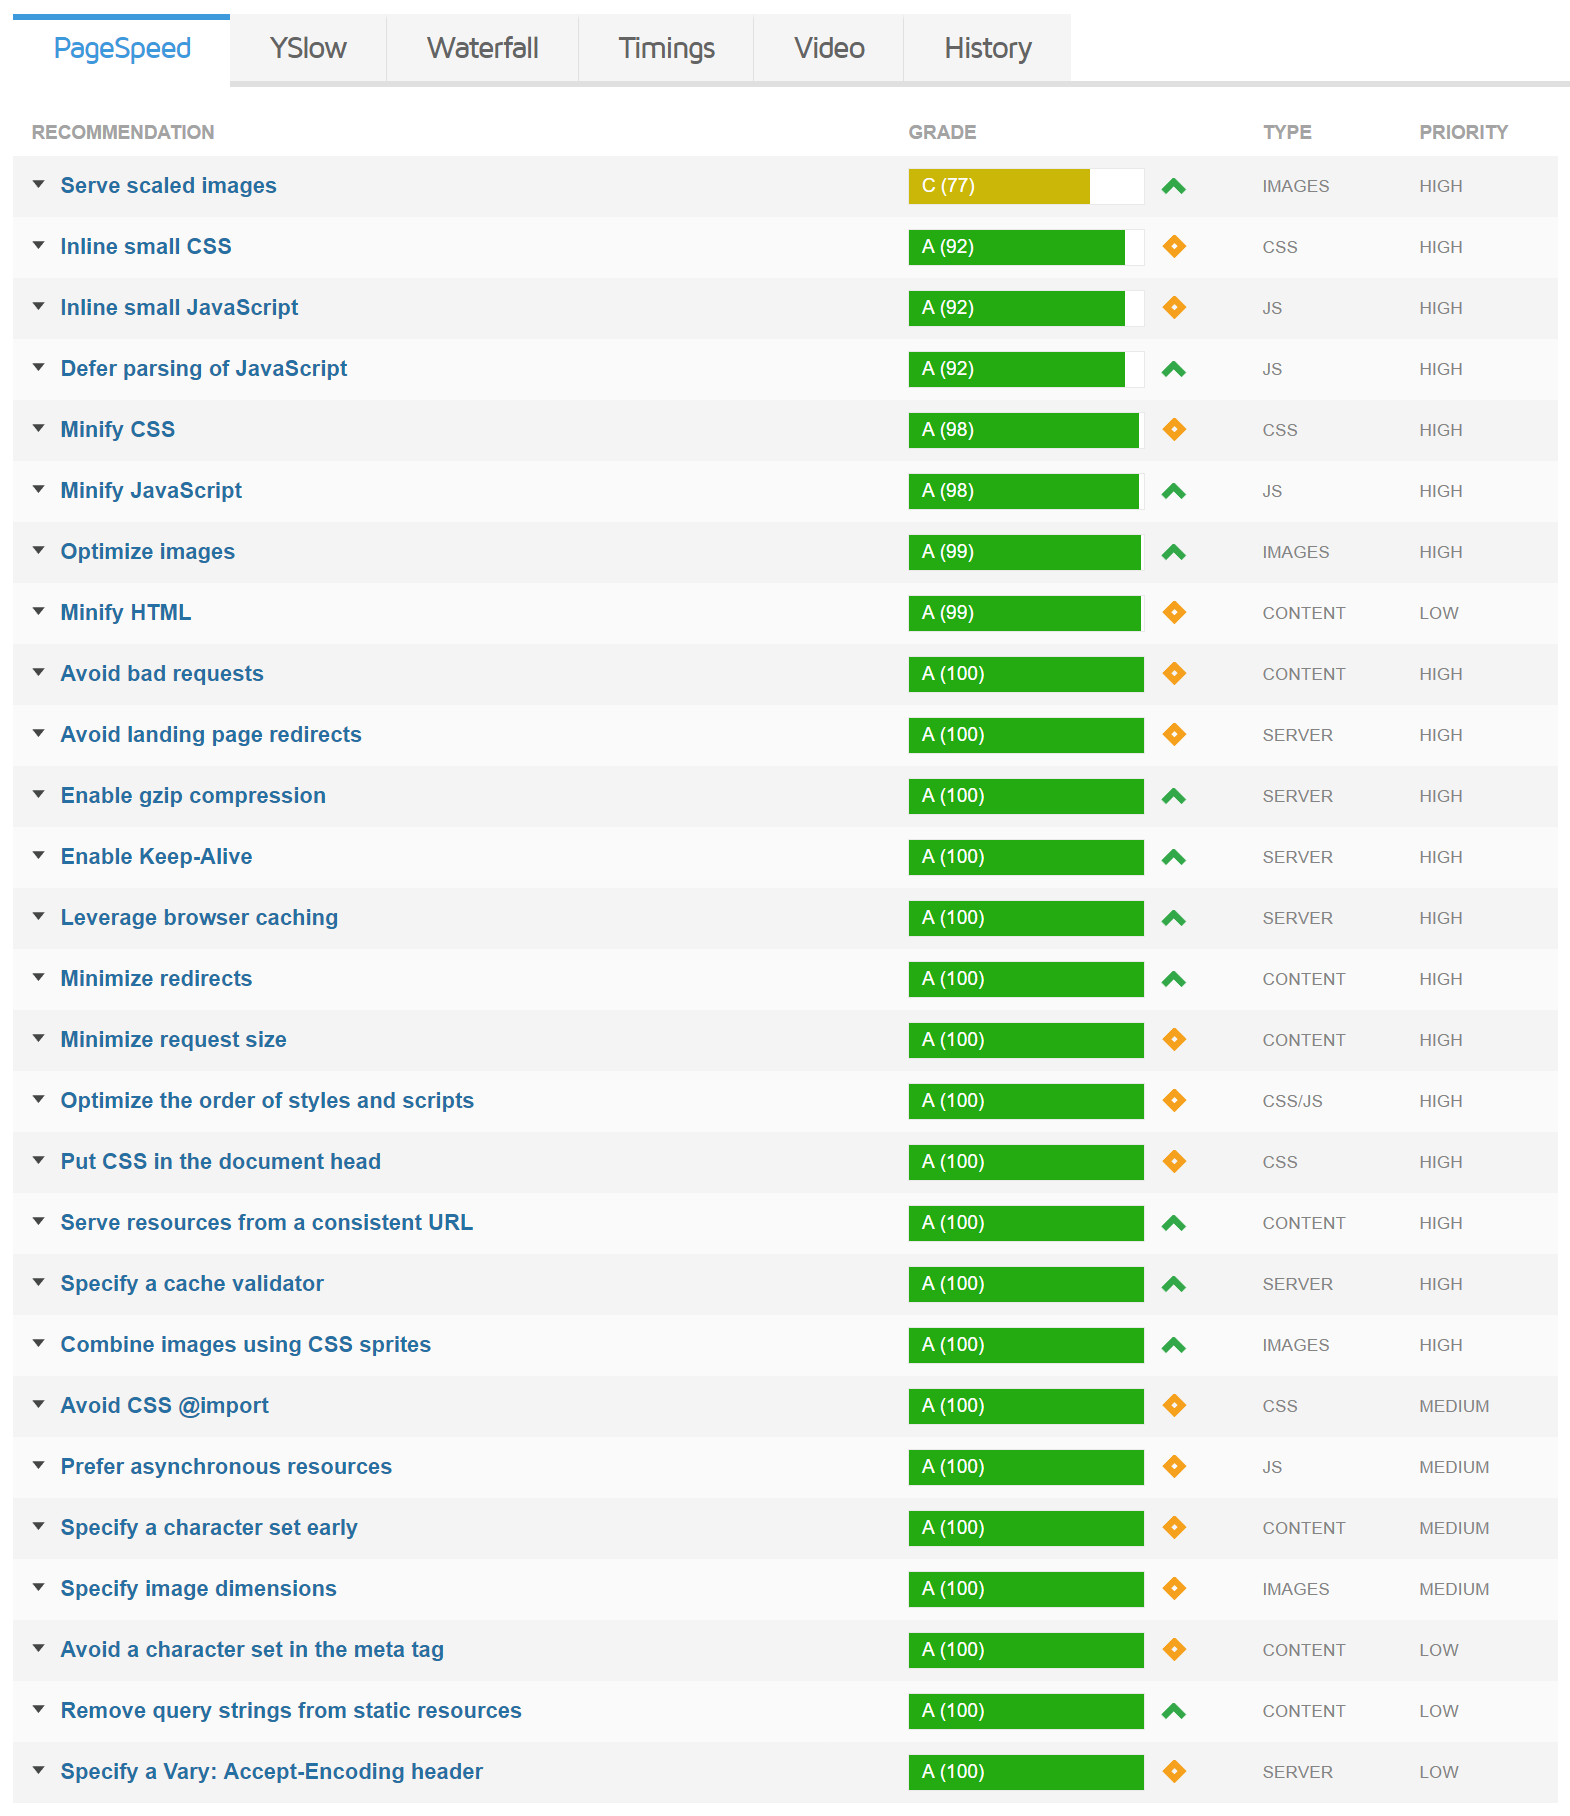
The GTmetrix “Structure” tab is where you can view specific issues affecting the performance of your site. This page is very useful because it provides you with actionable information like “eliminate render-blocking resources” and “minify CSS” to start optimizing your site.
We will try to cover the most common and popular ones we see WordPress site owners struggling with. Make sure to also bookmark this post as we will be constantly updating it. Generally, if you improve these on your site, you should see an increase in performance.
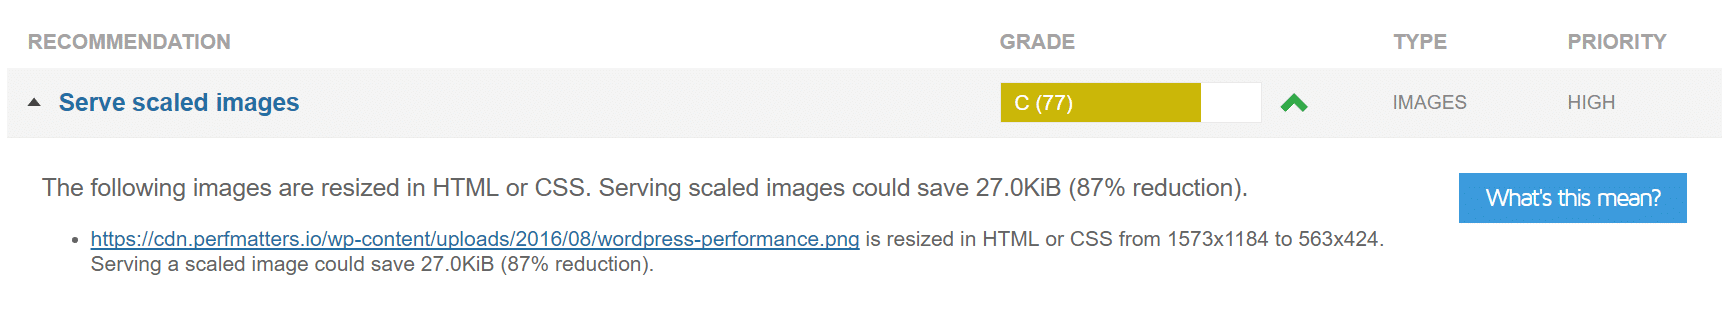
Serve Scaled Images
When it comes to working with images on your website, you should always try and upload them to scale, and not let CSS resize them. If you don’t, you will end up with the serve scaled images recommendation. If you are using WordPress, by default, it resizes your images when uploading them to the media library. These settings can be found under “Settings > Media.” You will want to ensure that the max width is close to the width of your site. This way CSS is not trying to resize your image down to fit inside. You could also automatically resize them with an image optimization plugin.
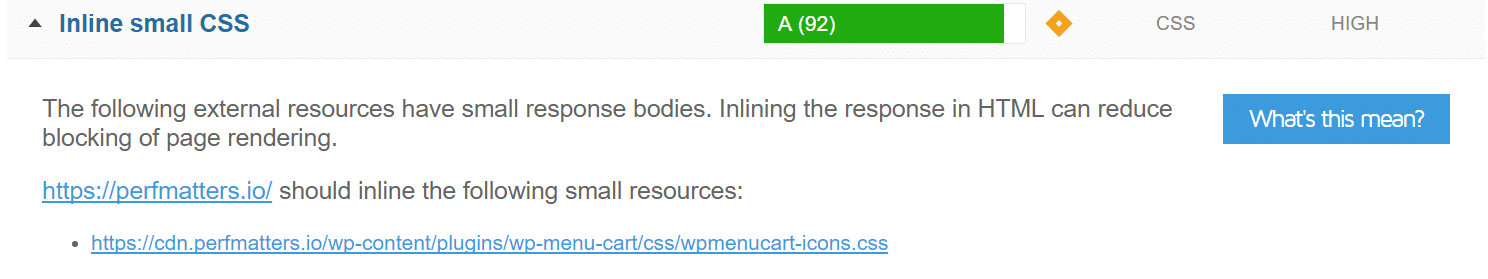
Inline Small CSS
Inlining your CSS is usually not recommended as it will increase the overall download size of your page request. However, if your site is small, with minimal requests, it could improve your performance.
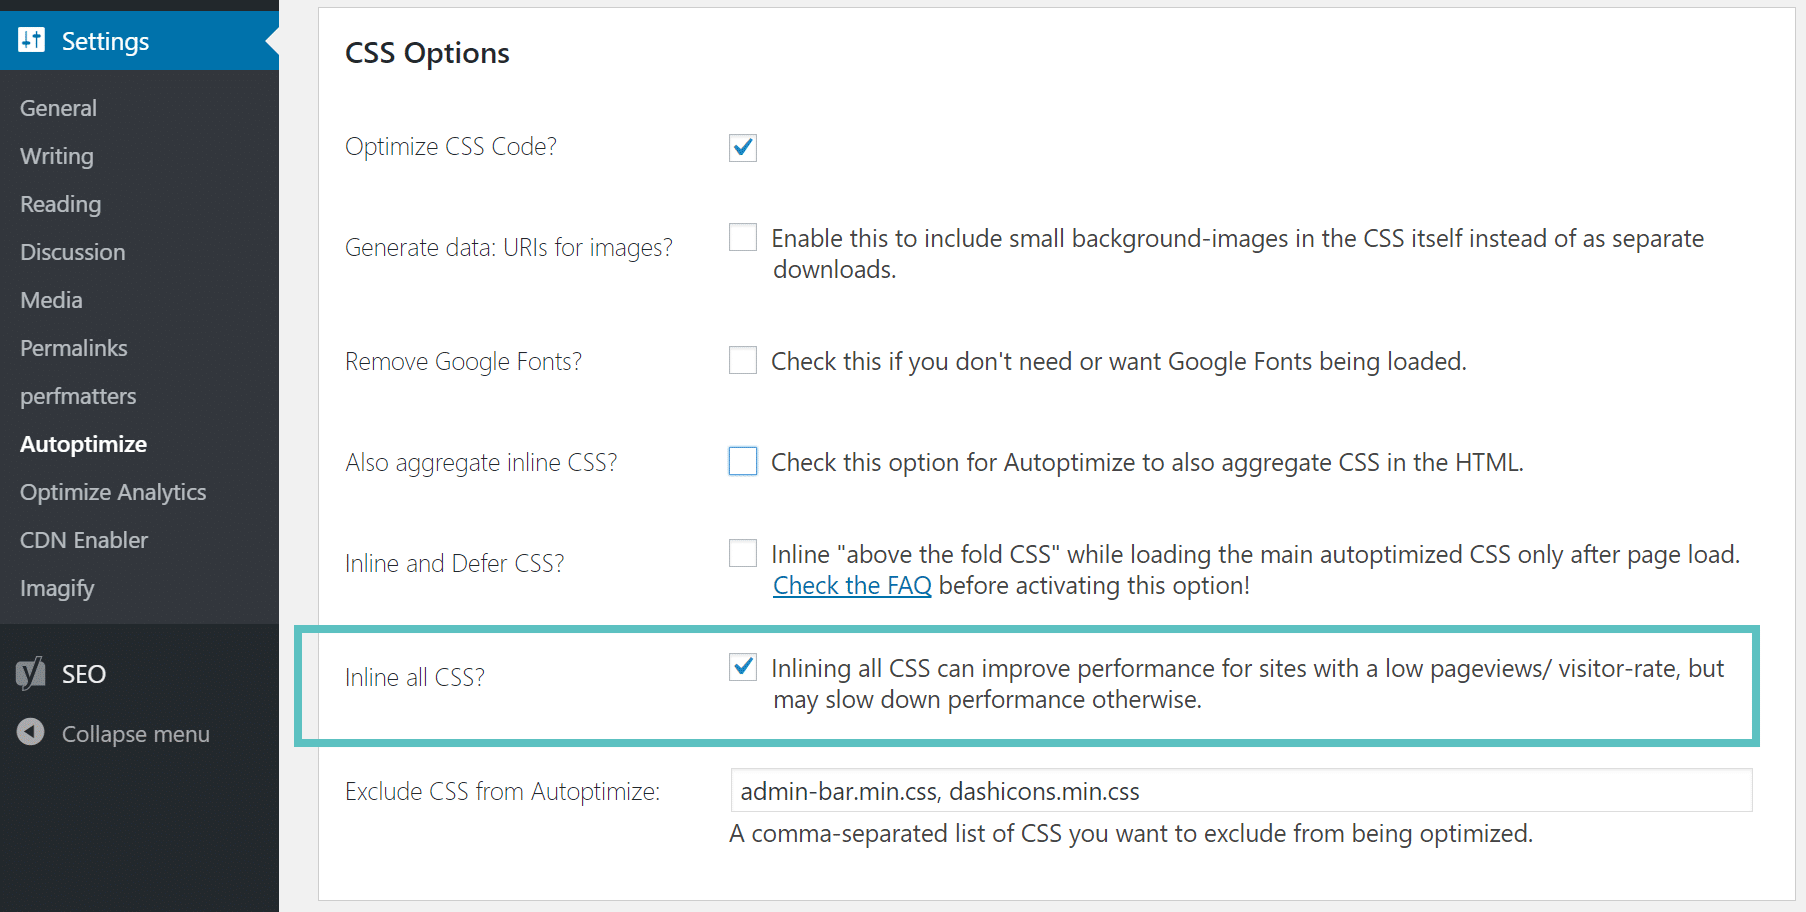
To easily inline your CSS you can use a free plugin like Autoptimize. Simply check the “Inline all CSS?” option and then ensure you have excluded the additional CSS files you don’t inline.
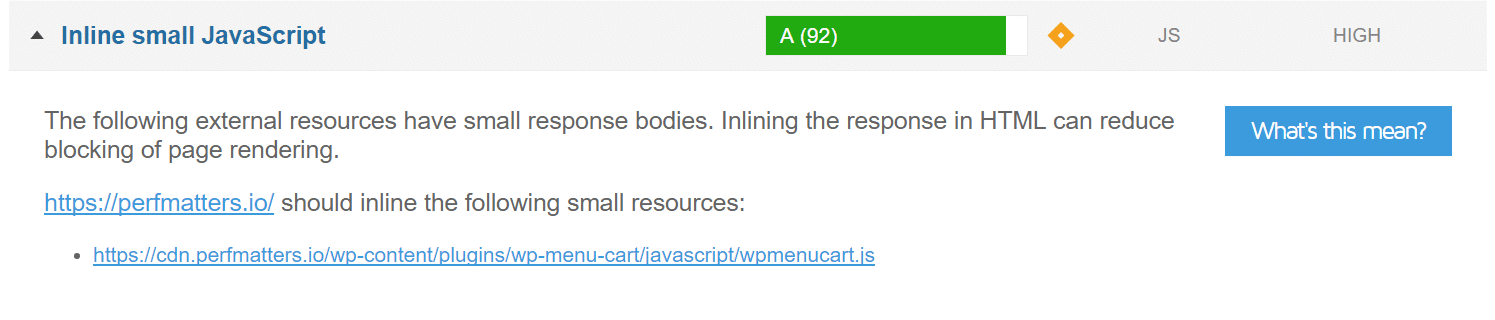
Inline Small JavaScript
Just like with inlining small CSS, the same thing applies for inlining small JavaScript. It is usually not recommended as it will increase the overall download size of your page request. However, if your site is small, with minimal requests, it could improve your performance. Again, you can use the JavaScript settings of Autoptimize.
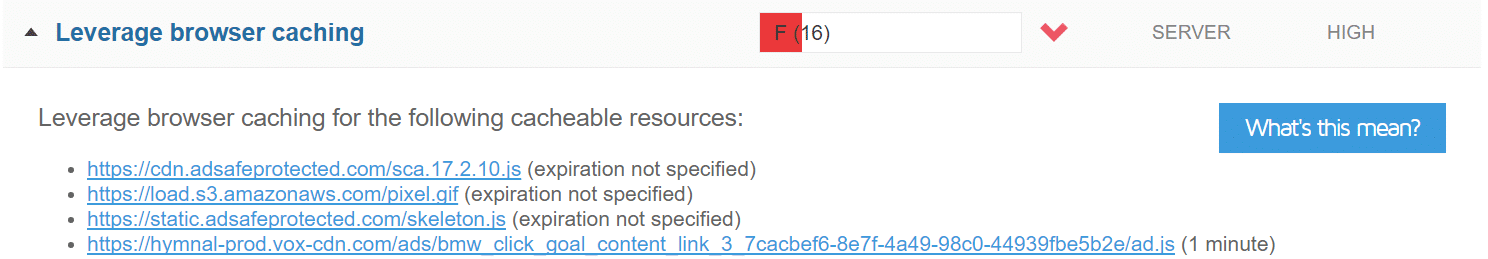
Leverage Browser Caching
Leverage browser caching is a very common recommendation that people struggle with. This is generated due to not having the correct HTTP cache headers on your web server. See our in-depth post on how to fix the leverage browser caching warning. You can only fix this on resources you control. For example, if you are seeing this on third-party ad networks, there is nothing you can do.
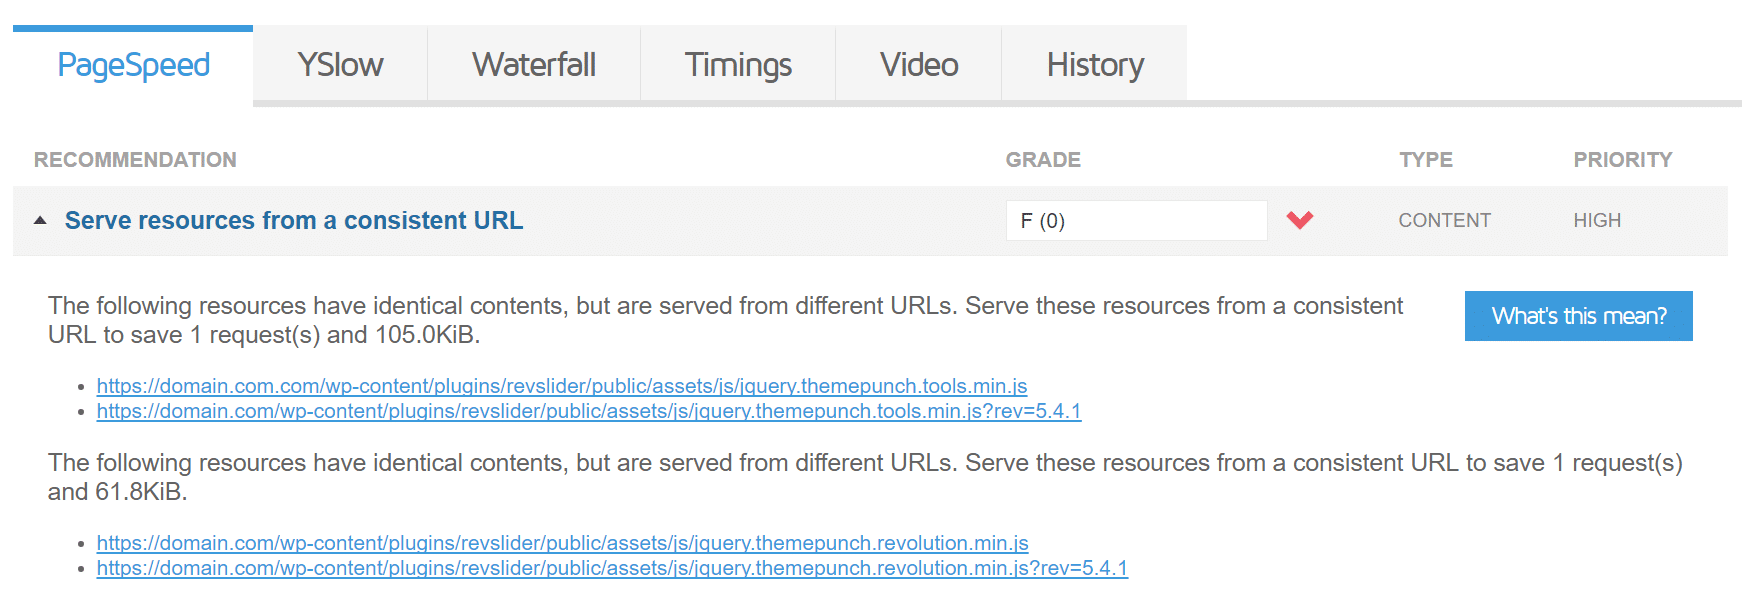
Serve Resources From a Consistent URL
If you are are seeing the serve resources from a consistent URL it is most likely that you have identical resources being served from the same URL. A lot of times this can happen when there are query strings involved. Check out how to remove query strings from static resources. Once they are gone, it should no longer have to load it twice.
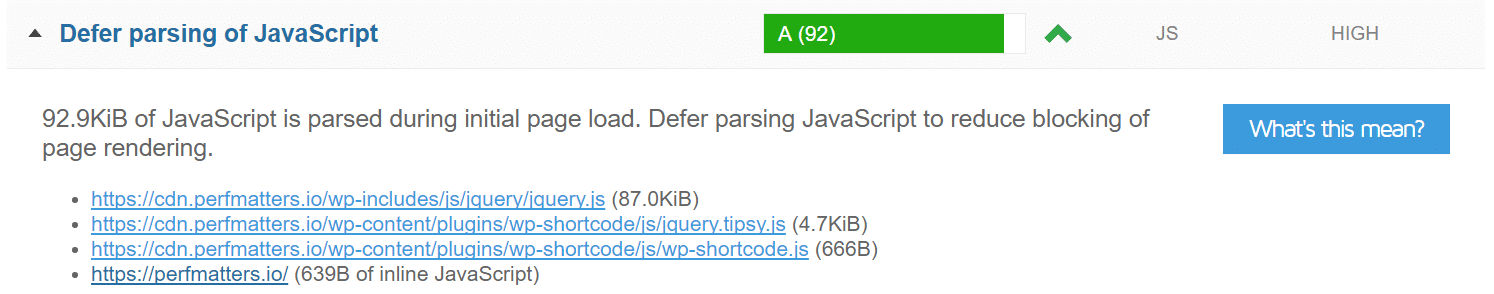
Defer Parsing of JavaScript
JavaScript and CSS are by default render-blocking. This means they can prevent the web page from being displayed until they are downloaded and processed by the browser. The defer attribute tells the browser to hold off on downloading the resource until HTML parsing is complete. A few easy ways to fix this is to utilize the free Autoptimize or Async JavaScript plugins. Make sure to check out our in-depth post on how to eliminate render-blocking JavaScript and CSS.
For an in-depth explanation, read: How to Defer Parsing of Javascript Warning in WordPress (4 Methods).
Minify CSS and JavaScript
Minification is essentially removing all unnecessary characters from source code without changing its functionality. This could include line breaks, empty space, indents, etc. By doing this it can save bytes of data and speed up downloading, parsing, and execution time.
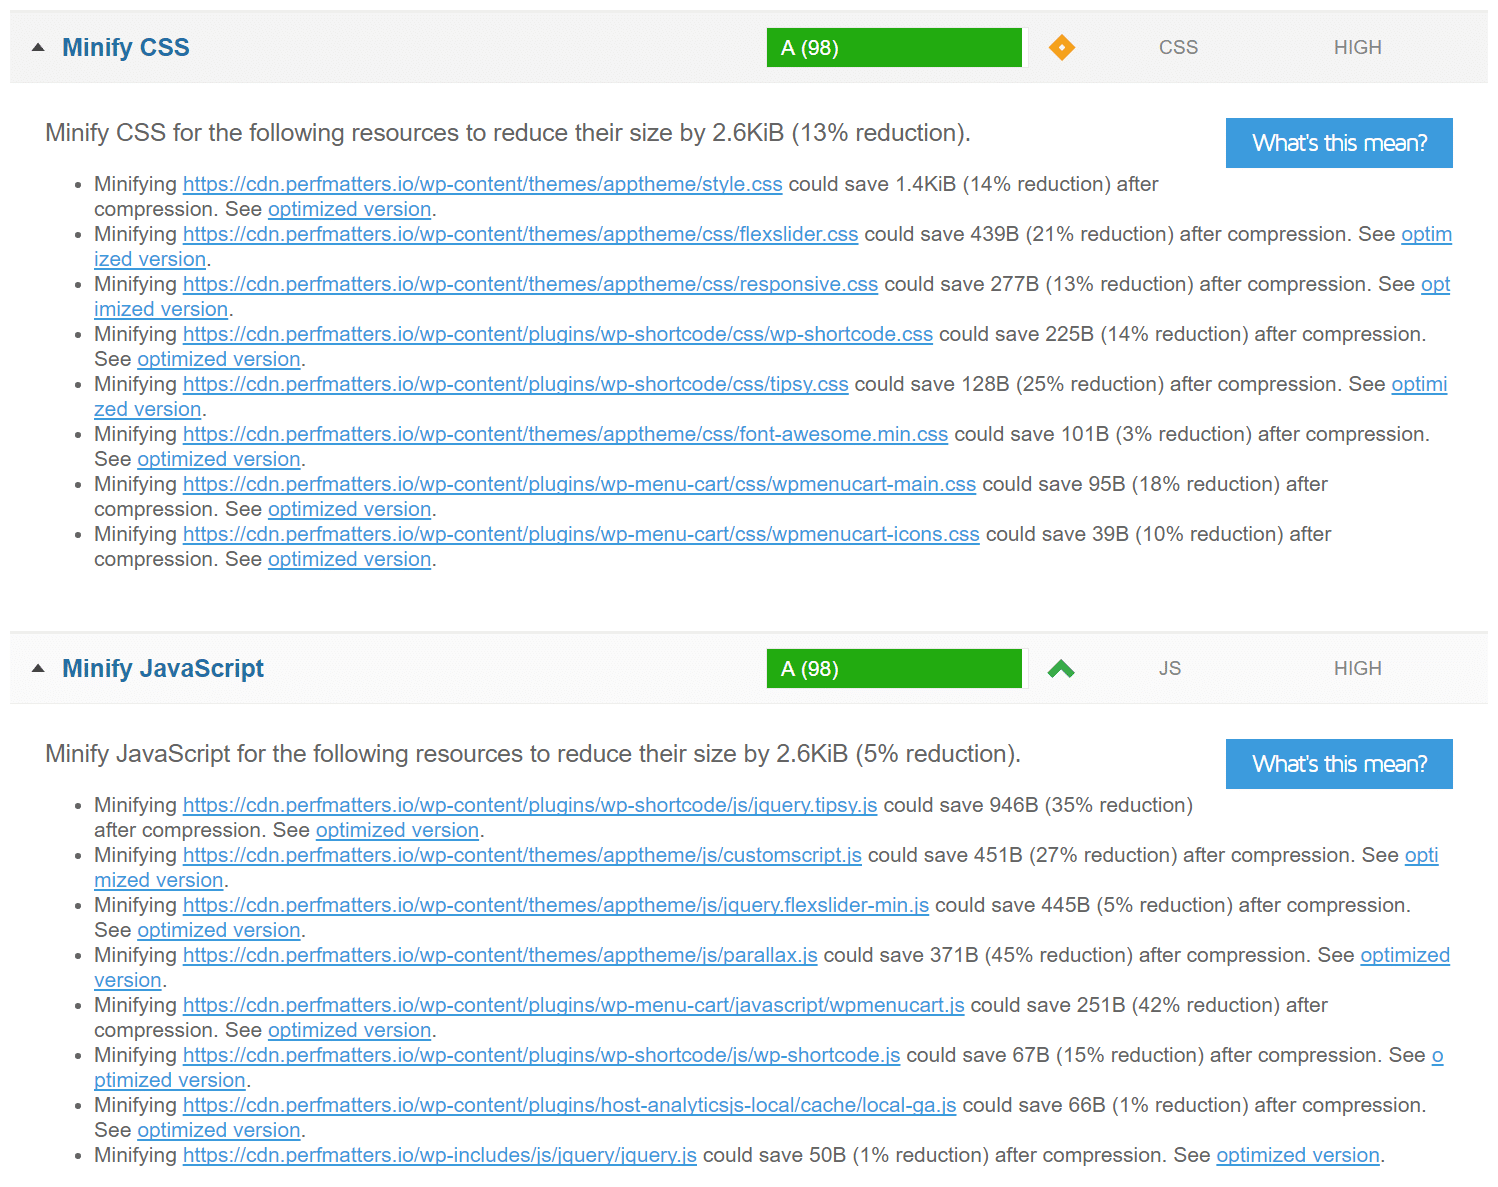
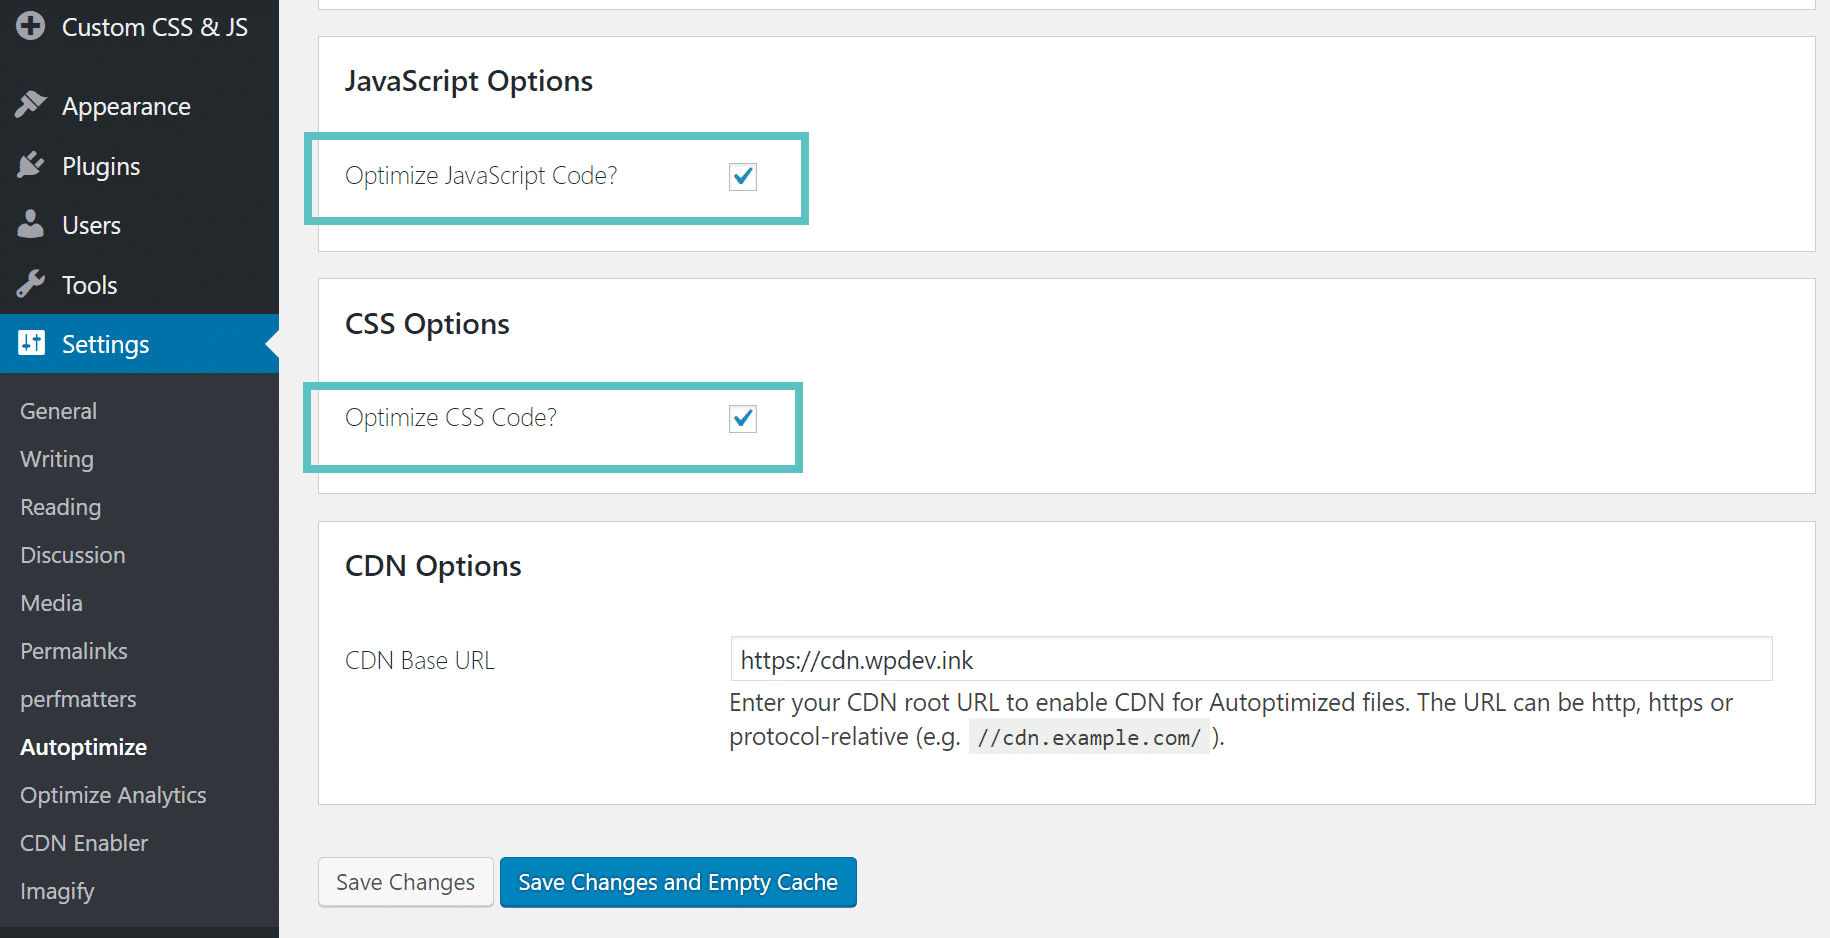
Again, the free Autoptimize plugin is great for this. Simply ensure that the “Optimize JavaScript Code” and “Optimize CSS Code” are both checked. If you have a large site, you might also want to play with the advanced settings underneath, as some could harm the performance on your site. Inlining or combining CSS and JavaScript on large sites is usually not recommended. This is where the power of HTTP/2 comes into play.
Optimize Images
According to HTTP Archive, images make up on average 66% of a total webpage’s weight. So when it comes to optimizing your WordPress site, images is by far the first place you should start! It’s more important than scripts and fonts.
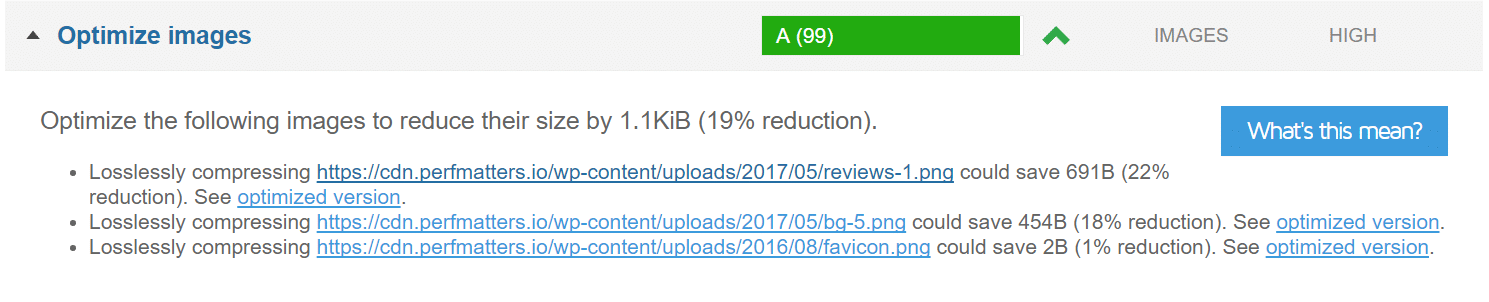
In a perfect world, every image should be compressed and optimized before uploading to WordPress. But unfortunately, that just isn’t realistic. Because of this, we recommend using a good image optimization plugin. This will help automatically compress your images, resize them, and ensure they are lightweight and fast loading on your site. Check out our in-depth post on how to optimize images for web.
Reduce Initial Server Response Time
For WordPress, the main culprit for slow initial server response times is the lack of page caching. Without page caching, WordPress uses PHP to dynamically build pages for each individual request, which means it can get overwhelmed with requests quickly. With page caching enabled, your site can server pre-generated HTML files, which is much faster and more scalable than using PHP to fulfill each page request.
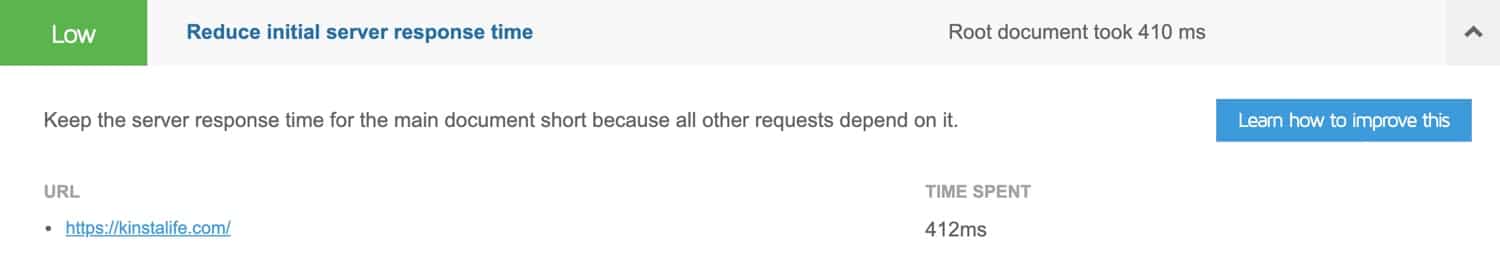
If you’re hosted on Kinsta, you don’t have to worry about page caching because we take care of that for you with our Nginx configuration. If your WordPress host doesn’t support page caching, you can install a caching plugin like WP Rocket or W3 Total Cache. To reduce server response time even further, we recommend integrating Cloudflare APO with your WordPress site. This innovative optimization service from Cloudflare distributes your site’s HTML pages around the world, which can reduce server response time globally.
Minify HTML
Just like CSS and JavaScript, HTML can also be minified to strip out unnecessary characters and save you bytes of data to speed up execution time.
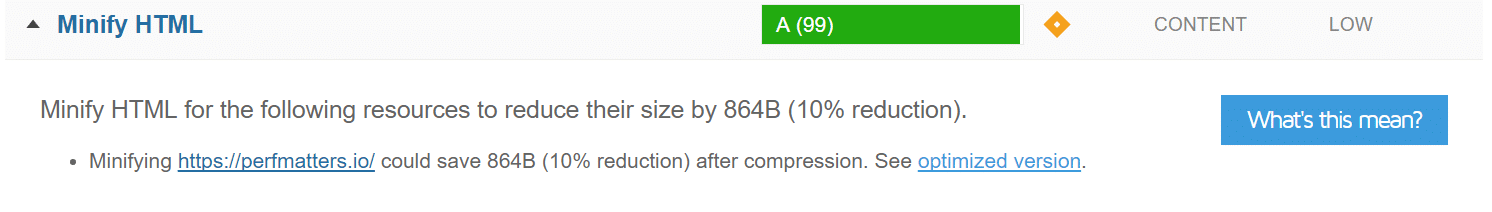
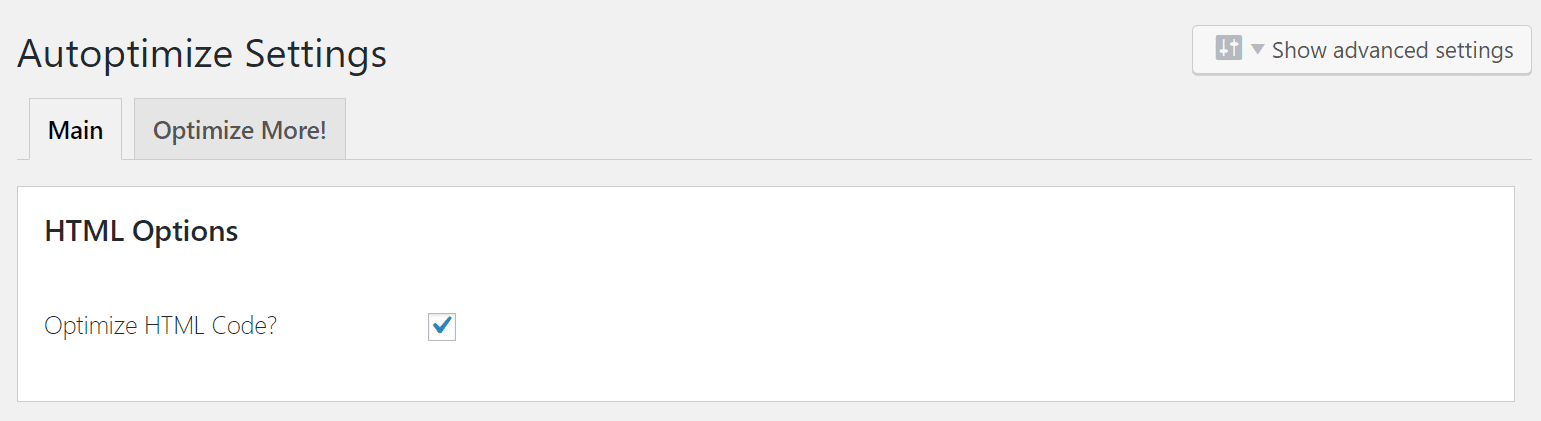
The free Autoptimize plugin is also great for this. Simply enable the “Optimize HTML Code” option.
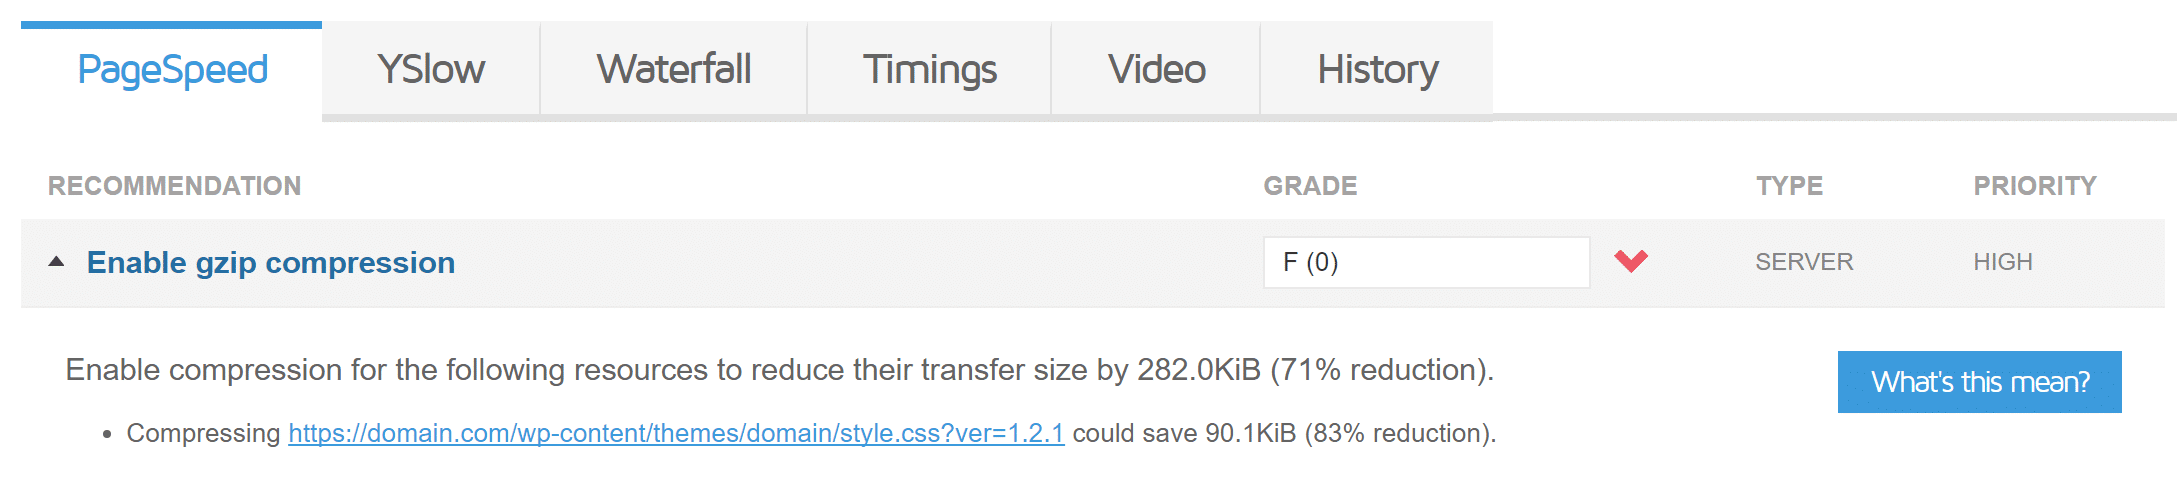
Enable GZIP Compression
GZIP is a file format and a software application used for file compression and decompression. GZIP compression is enabled server-side, and allows for further reduction in the size of your HTML, stylesheets, and JavaScript files. It will not work on images as these are already compressed in a different way. Some have seen up to 70% reductions due to compression. It is probably one of the easiest optimizations you could make when it comes to WordPress. Note: GZIP compression is enabled by default on all Kinsta servers.
To enable GZIP compression in Apache, simply add the following code to your .htaccess file.
<IfModule mod_deflate.c>
# Compress HTML, CSS, JavaScript, Text, XML and fonts
AddOutputFilterByType DEFLATE application/javascript
AddOutputFilterByType DEFLATE application/rss+xml
AddOutputFilterByType DEFLATE application/vnd.ms-fontobject
AddOutputFilterByType DEFLATE application/x-font
AddOutputFilterByType DEFLATE application/x-font-opentype
AddOutputFilterByType DEFLATE application/x-font-otf
AddOutputFilterByType DEFLATE application/x-font-truetype
AddOutputFilterByType DEFLATE application/x-font-ttf
AddOutputFilterByType DEFLATE application/x-javascript
AddOutputFilterByType DEFLATE application/xhtml+xml
AddOutputFilterByType DEFLATE application/xml
AddOutputFilterByType DEFLATE font/opentype
AddOutputFilterByType DEFLATE font/otf
AddOutputFilterByType DEFLATE font/ttf
AddOutputFilterByType DEFLATE image/svg+xml
AddOutputFilterByType DEFLATE image/x-icon
AddOutputFilterByType DEFLATE text/css
AddOutputFilterByType DEFLATE text/html
AddOutputFilterByType DEFLATE text/javascript
AddOutputFilterByType DEFLATE text/plain
AddOutputFilterByType DEFLATE text/xml

# Remove browser bugs (only needed for really old browsers)
BrowserMatch ^Mozilla/4 gzip-only-text/html
BrowserMatch ^Mozilla/4\.0[678] no-gzip
BrowserMatch \bMSIE !no-gzip !gzip-only-text/html
Header append Vary User-Agent
</IfModule>
If you are running on NGINX, simply add the following to your nginx.conf file.
gzip on;
gzip_disable "MSIE [1-6]\.(?!.*SV1)";
gzip_vary on;
gzip_types text/plain text/css text/javascript image/svg+xml image/x-icon application/javascript application/x-javascript;
Make sure to also check out our in-depth post on how to enable GZIP compression.
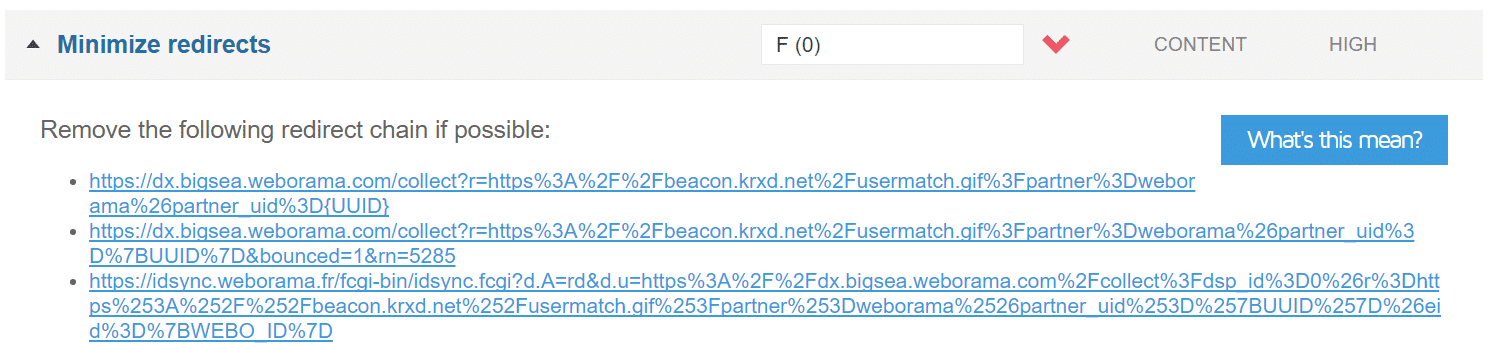
Minimize Redirects
Minimizing HTTP redirects from one URL to another cuts out additional RTTs and wait time for users. Check out our post on WordPress redirects in which we discovered that 2 bad redirects increased the site load times by 58%! Plain and simple, WordPress redirects slow down your site. That’s why it’s worth taking the time to minimize the number of redirects visitors to your site experience.
Specify a Cache Validator
The specify a cache validator recommendation appears when there are missing HTTP caching headers. These should be included on every origin server response, as they both validate and set the length of the cache. If the headers aren’t found, it will generate a new request for the resource every time, which increases the load on your server. Utilizing caching headers ensures that subsequent requests don’t have to be loaded from the server, thus saving bandwidth and improving performance for the user. And remember, you can’t fix this on 3rd-party resources you don’t control.
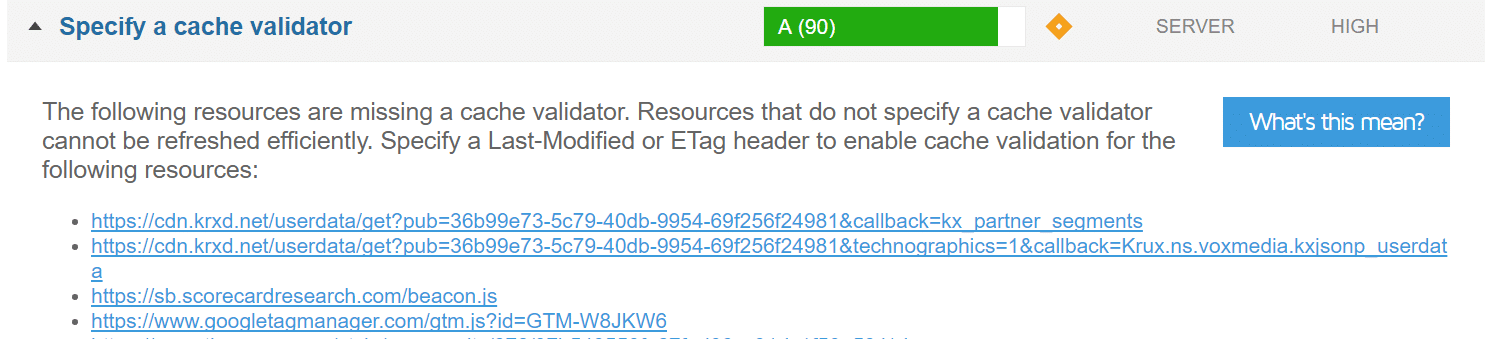
There are a number of different HTTP caching headers involved that can be used to fix this recommendation. Check out our in-depth post on how to specify a cache validator.
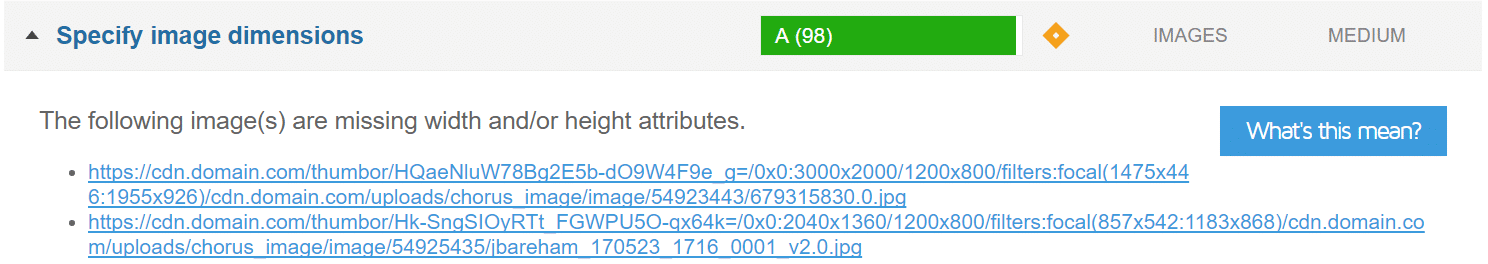
Specify Image Dimensions
Just like you shouldn’t let CSS resize your images, you should also specify image dimensions. This means including the width and height in your HTML code.
Incorrect
<img src="https://domain.com/images/image1.png">
Correct
<img src="https://domain.com/images/image1.png" width="200" height="100">
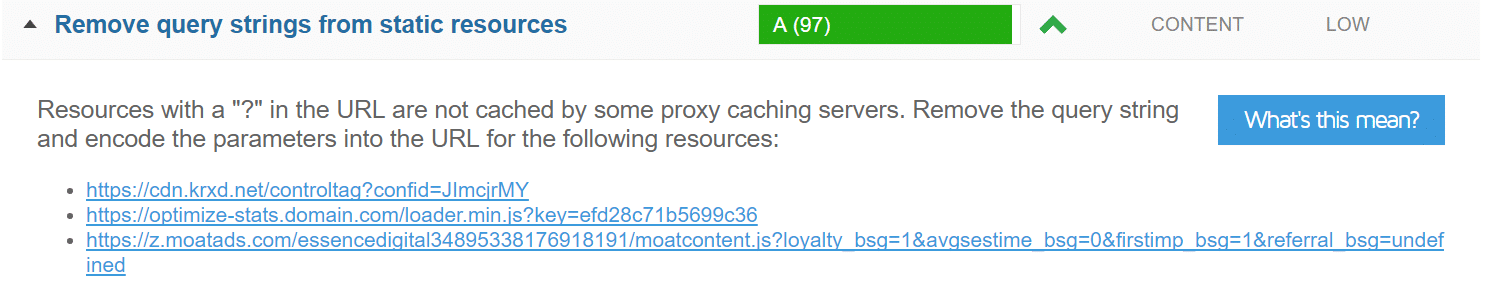
Remove Query Strings From Static Resources
Your CSS and JavaScript files usually have the file version on the end of their URLs, such as domain.com/style.css?ver=4.6. Some servers and proxy servers are unable to cache query strings, even if a cache-control:public header is present. So by removing them, you can sometimes improve your caching. This can easily be done with code or free WordPress plugins.
Check out our in-depth post on how to remove query strings from static resources. And remember, you can’t fix this on 3rd-party resources you don’t control.
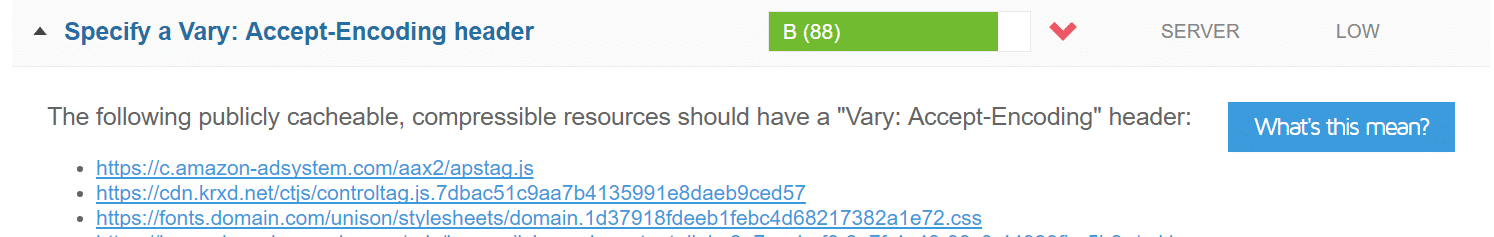
Specify a Vary: Accept-Encoding Header
This is an HTTP header and should be included on every origin server response, as it tells the browser whether or not the client can handle compressed versions of the content. Usually, when GZIP compression is enabled, this is also fixed. But make sure to check out our in-depth post on how to fix the specify a vary: accept-encoding header recommendation. And again, you can’t fix this on third-party resources.
GTmetrix Waterfall Chart
The GTmetrix waterfall chart displays all of the individual requests on your web page (as shown below). You can then analyze each request to see what is causing delays and performance issues on your site. Below is a more in-depth summary and or definition of what each of the colors means on each request.
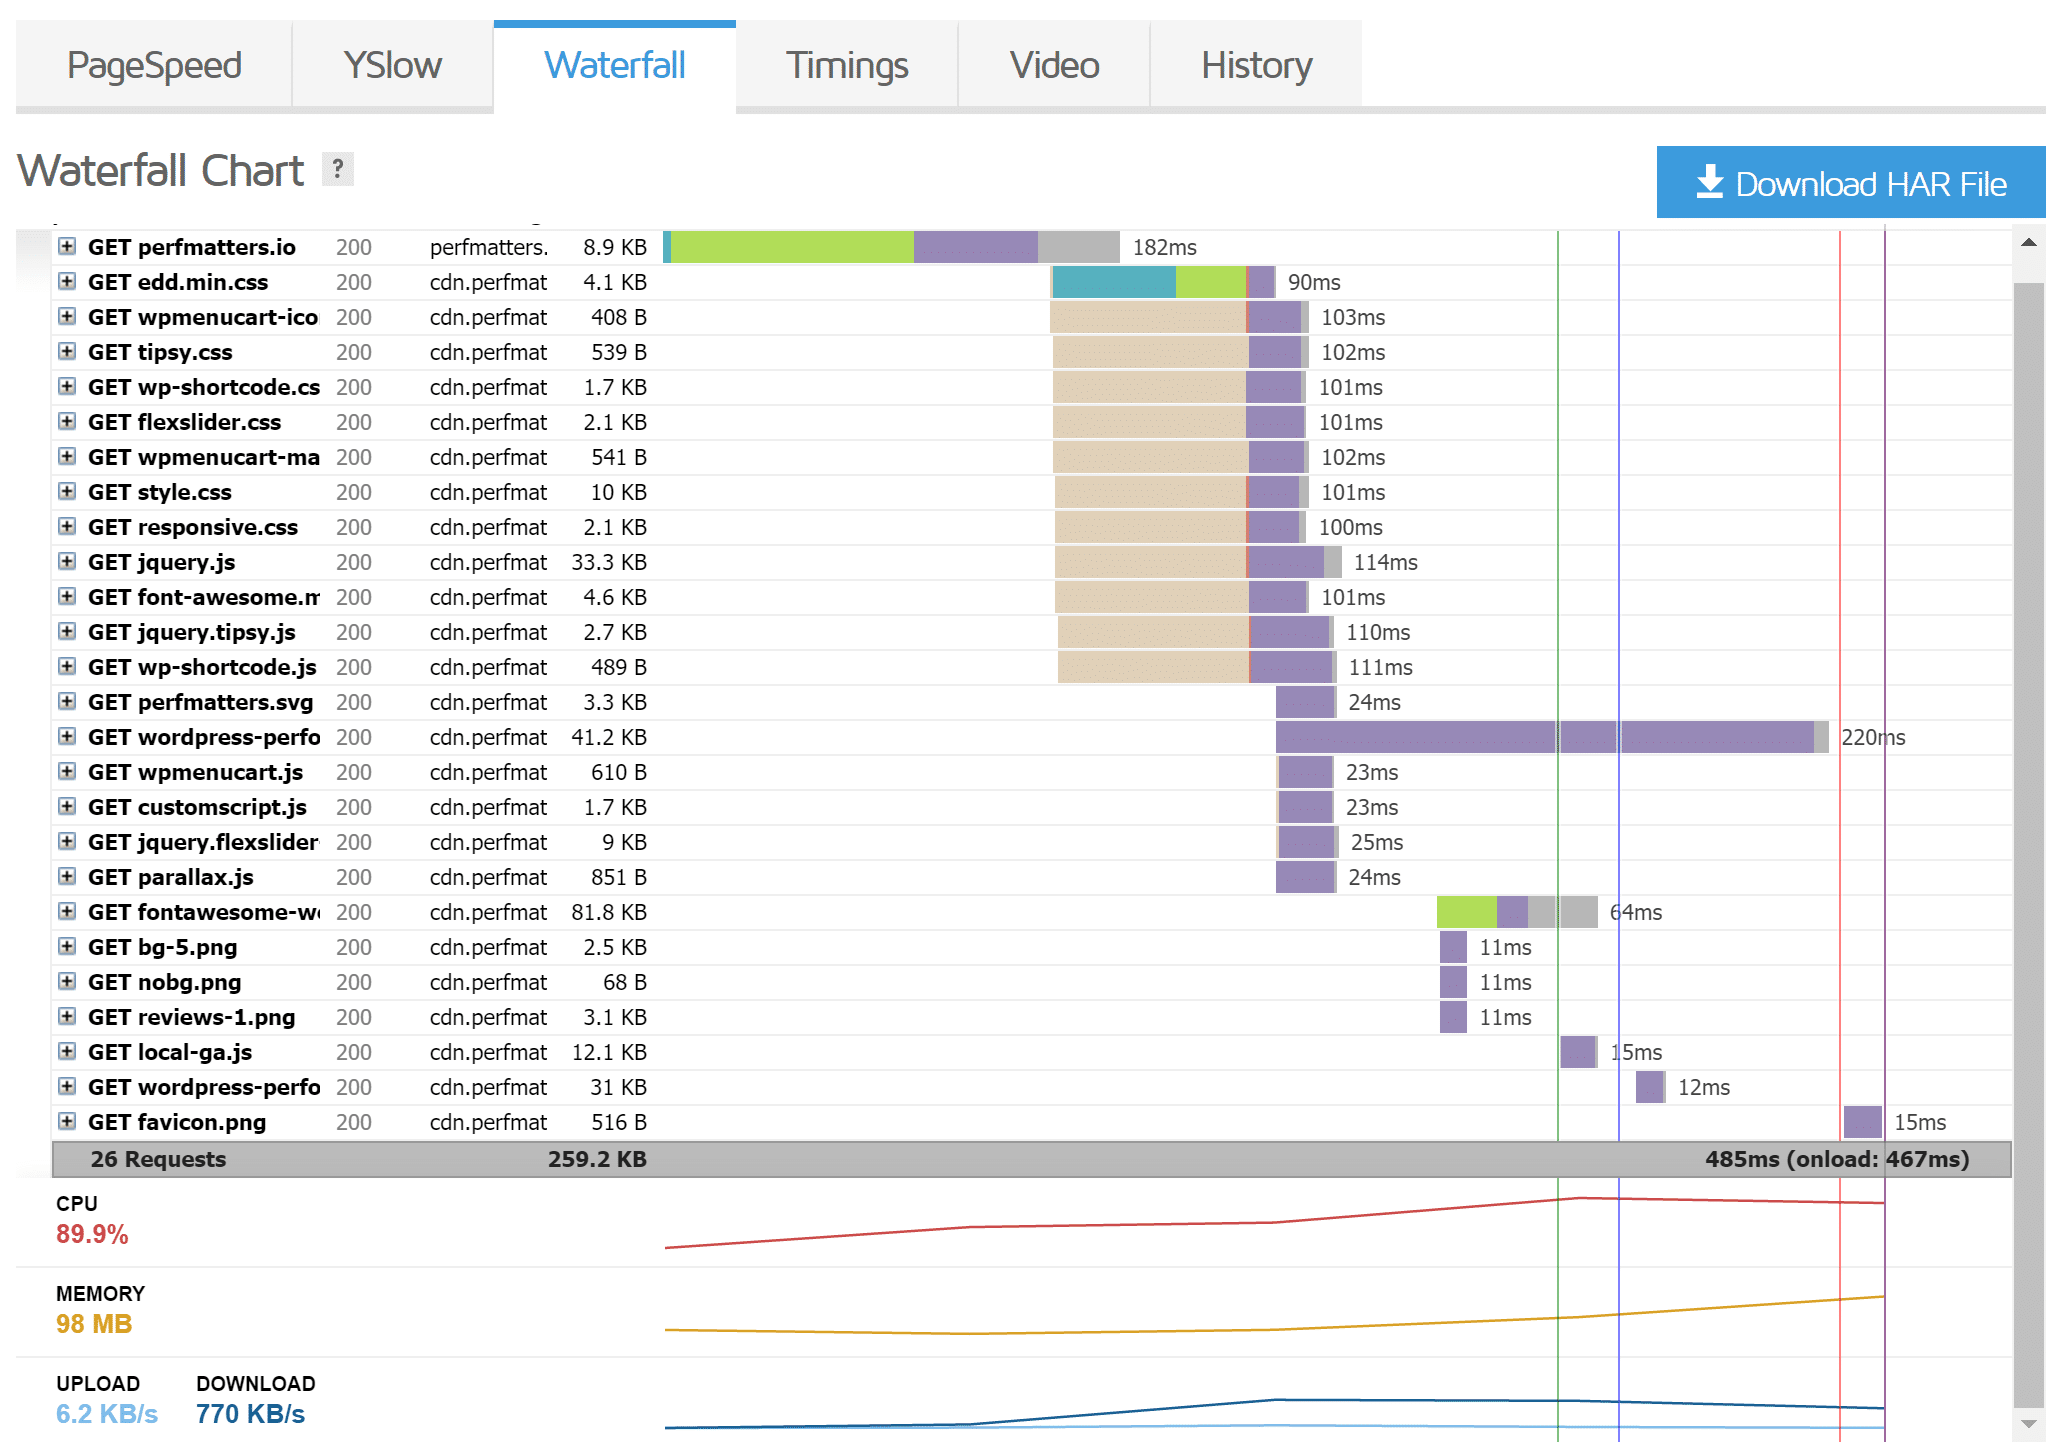
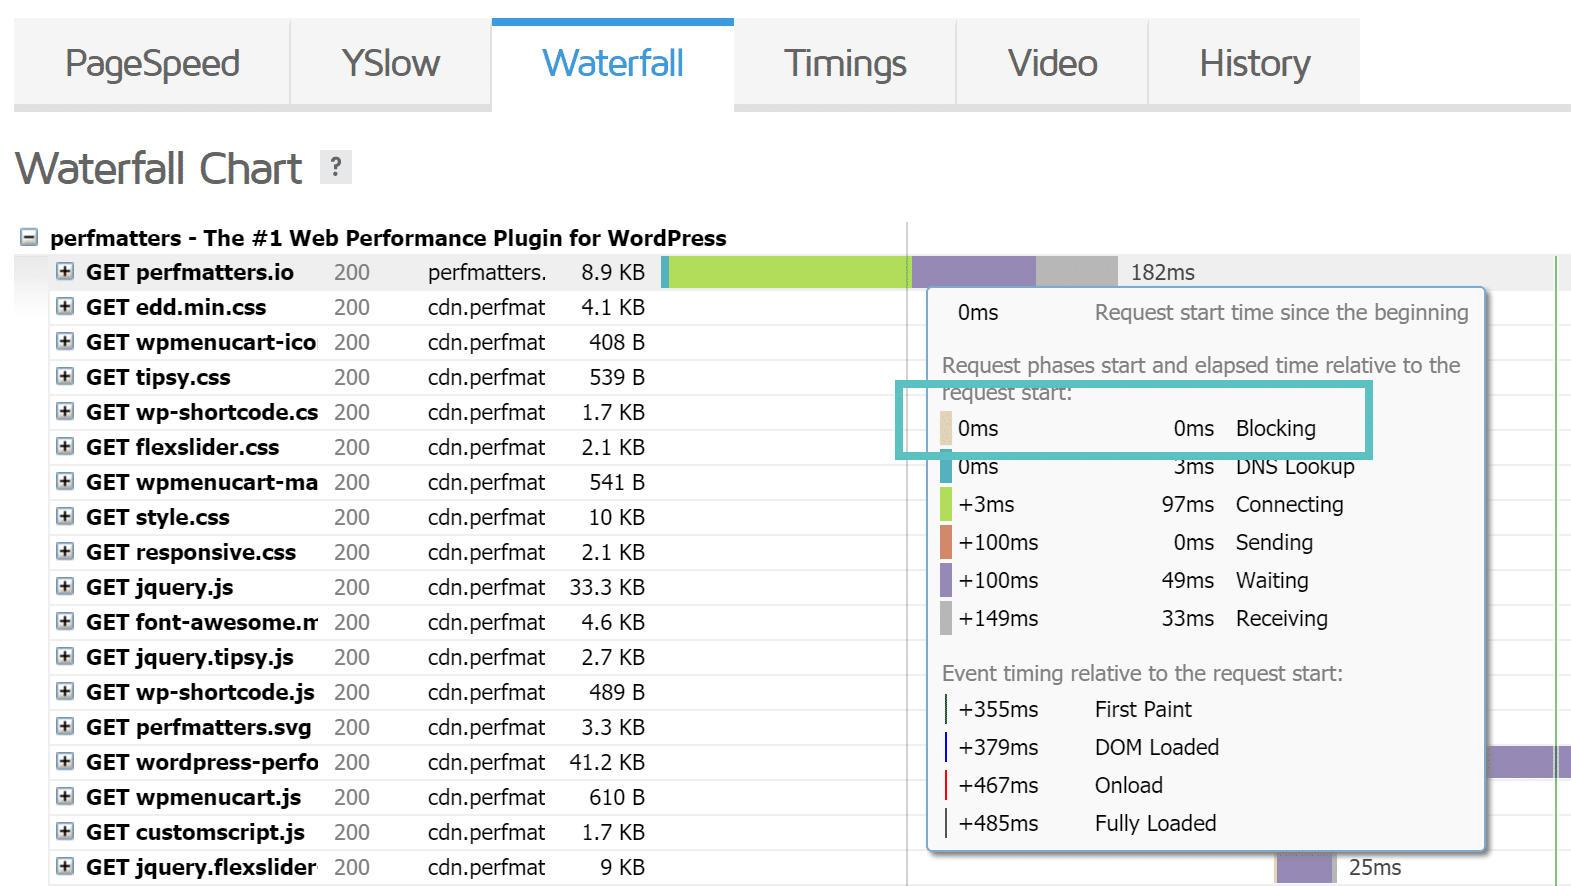
Blocking (Brown)
When a browser loads a web page, JavaScript and CSS resources usually prevent the web page from being displayed until they are downloaded and processed by the browser. This time delay shows up as blocking in the GTmetrix waterfall chart. Check out our in-depth post on how to eliminate render-blocking JavaScript and CSS for more information.
DNS Lookup (Teal)
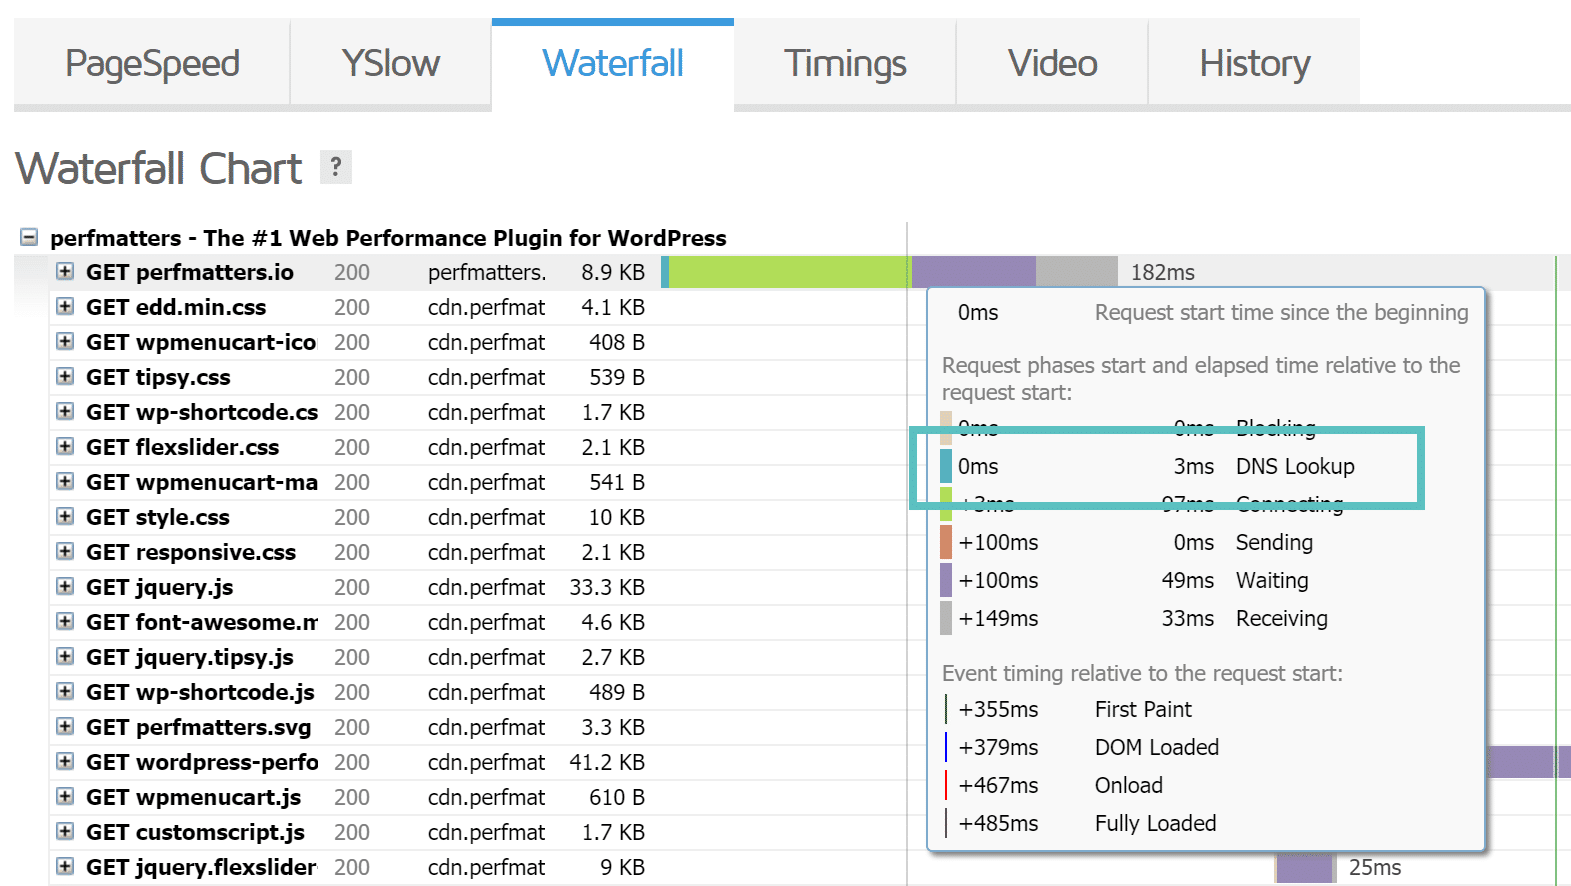
You can think of DNS lookup like a phone book. There are servers called Domain Name Servers which hold the information about your website and which IP it should be routed to. When you first run your website through GTmetrix, it performs a fresh lookup, and it has to query the DNS records to get the IP information. This results in some additional lookup time.
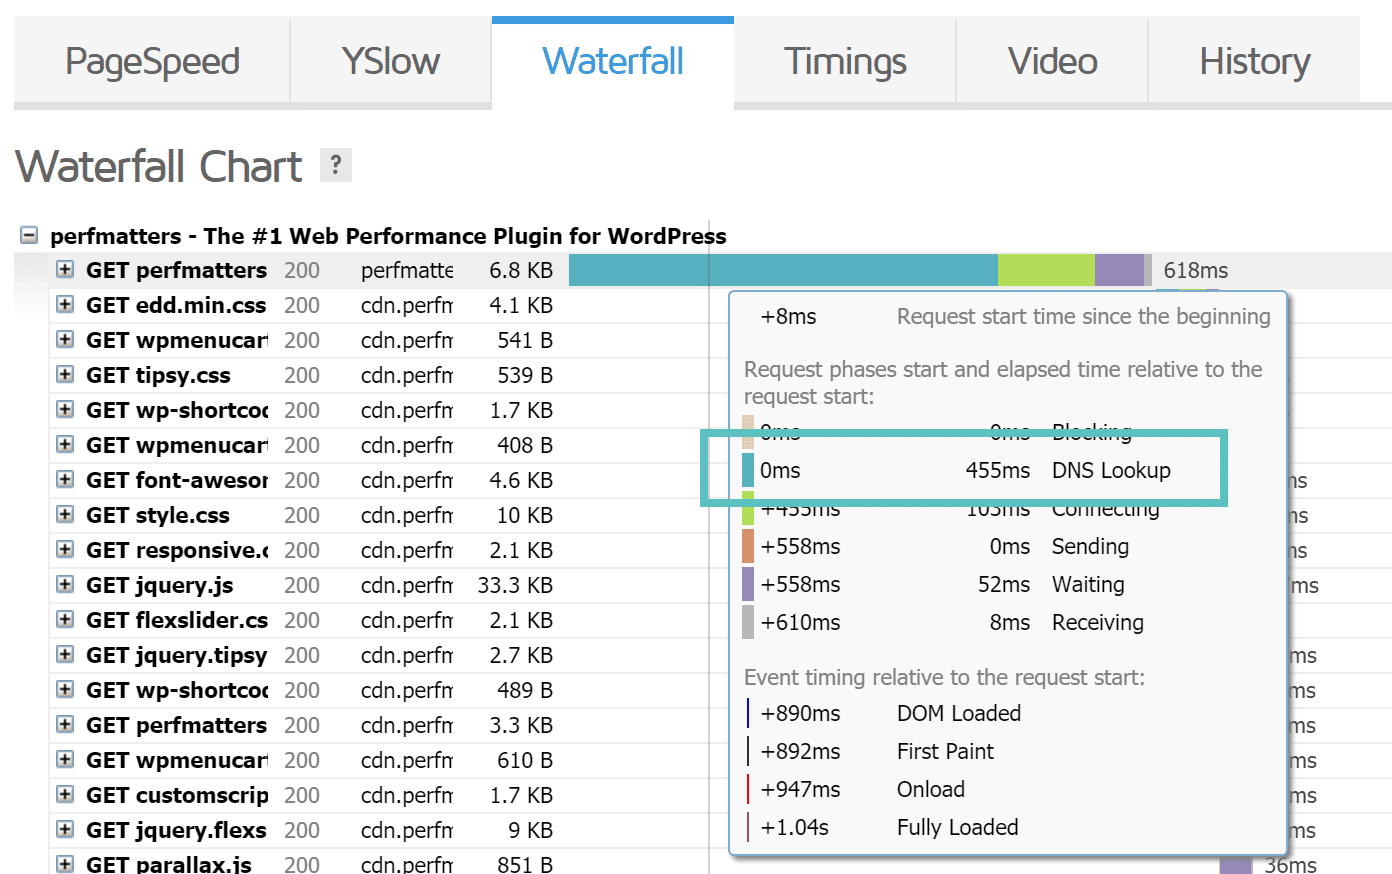
When you run your website through GTmetrix a second time, it caches the DNS because it already knows the IP information and doesn’t have to perform the lookup again. This is one reason why you might nice your website appears faster after running it through GTmetrix multiple times. As you can see in the screen below, on the 2nd test we ran, the DNS lookup time on the initial DOC load is 0 ms. This is one area a lot of people misinterpret! We recommend running your test multiple times and taking the average, unless you want DNS as part of your report, in which case you can take the first test.
The same applies to your assets (JavaScript, CSS, images) if you are using a CDN. A CDN cache works much like DNS, once it is cached, it is then much faster on consecutive loads. Another tip on speeding up DNS is to use DNS prefetching. This allows the browser to perform DNS lookups on a page in the background. You can do so by adding some lines of code to the header of your WordPress site. See some examples below.
<!-- Prefetch DNS for external assets -->
<link rel="dns-prefetch" href="//fonts.googleapis.com">
<link rel="dns-prefetch" href="//www.google-analytics.com">
<link rel="dns-prefetch" href="//cdn.domain.com">
Or if you are running WordPress version 4.6 or newer, you might want to use resource hints. Developers can use the wp_resource_hints filter to add custom domains and URLs for dns-prefetch, preconnect, prefetch or prerender.
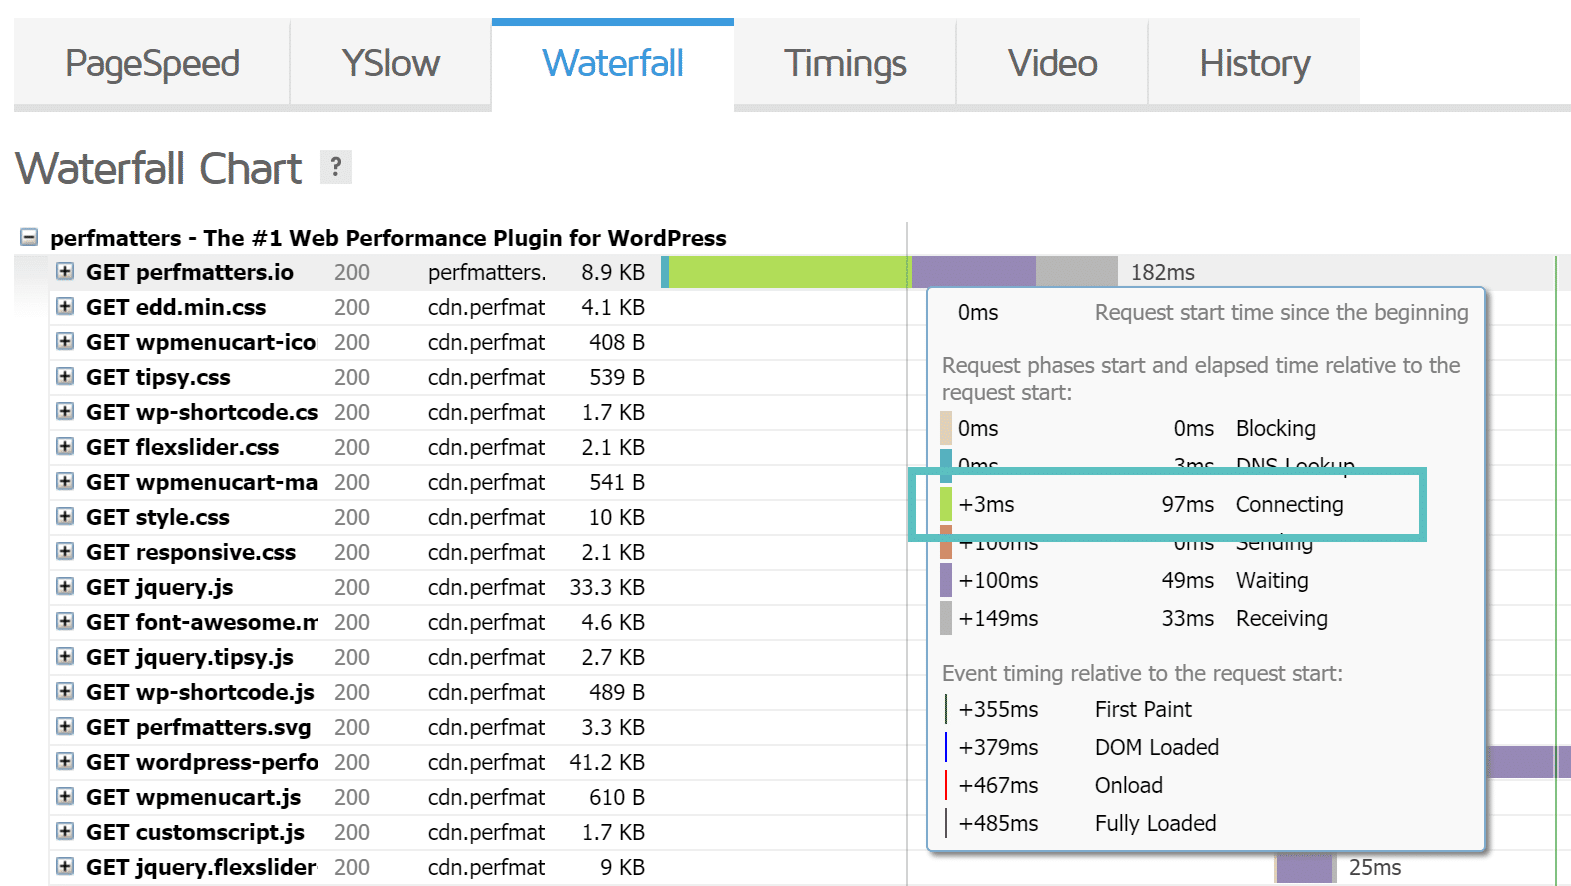
Connecting (Green)
The connecting time in GTmetrix is referring to the TCP connection, or the total time required to create a TCP connection. You don’t really need to understand how this works, but this is simply a communication method between the host/client and the server that has to take place.
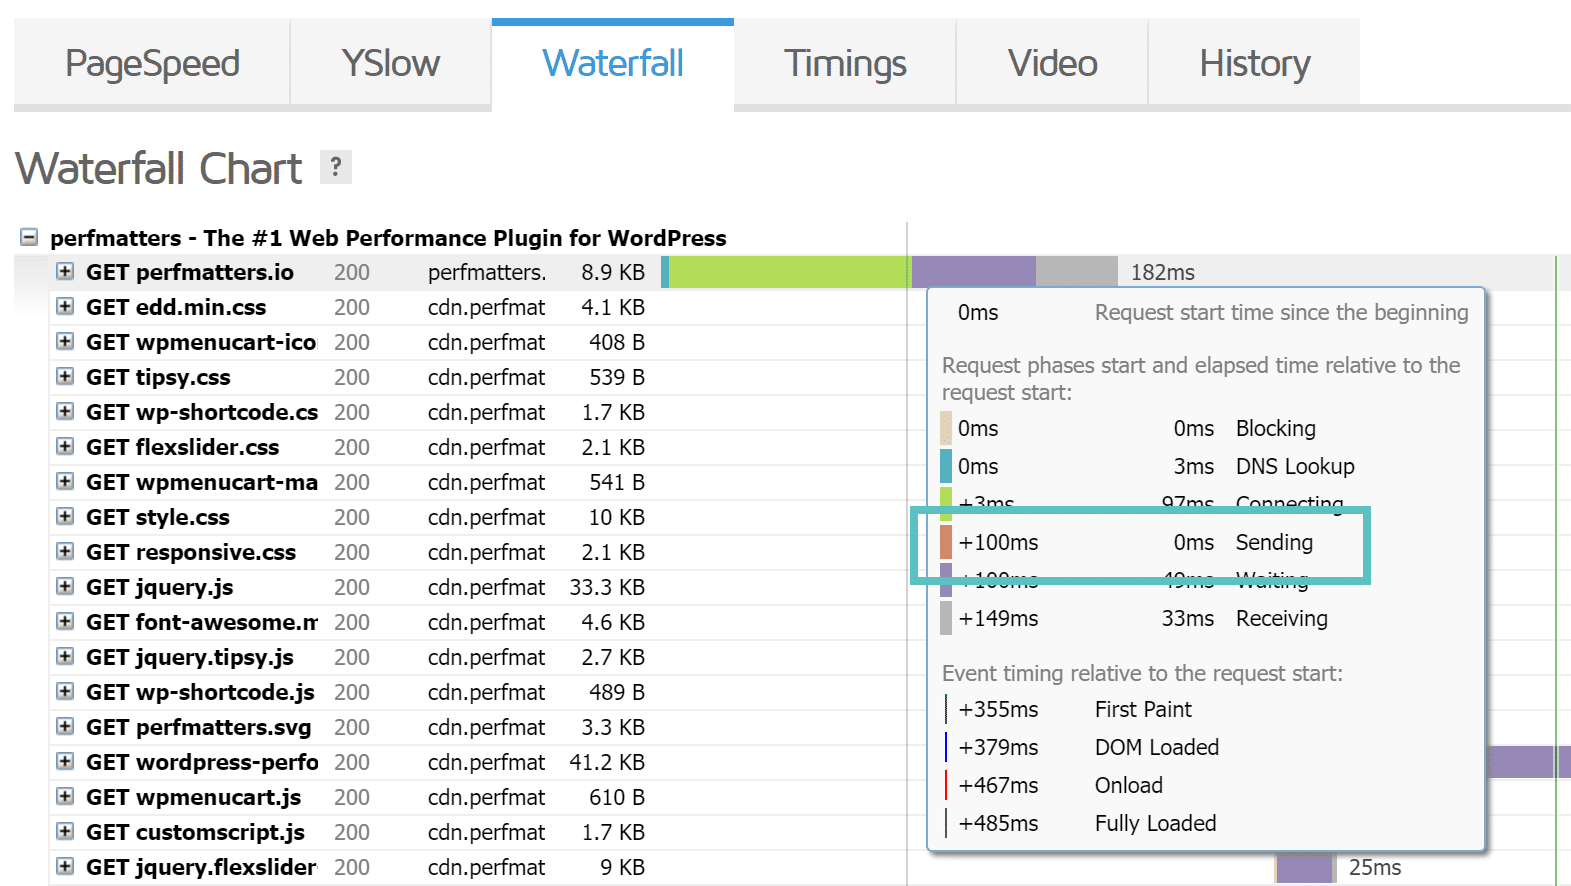
Sending (Red)
The sending time is simply the time it takes for the web browser to send data to the server.
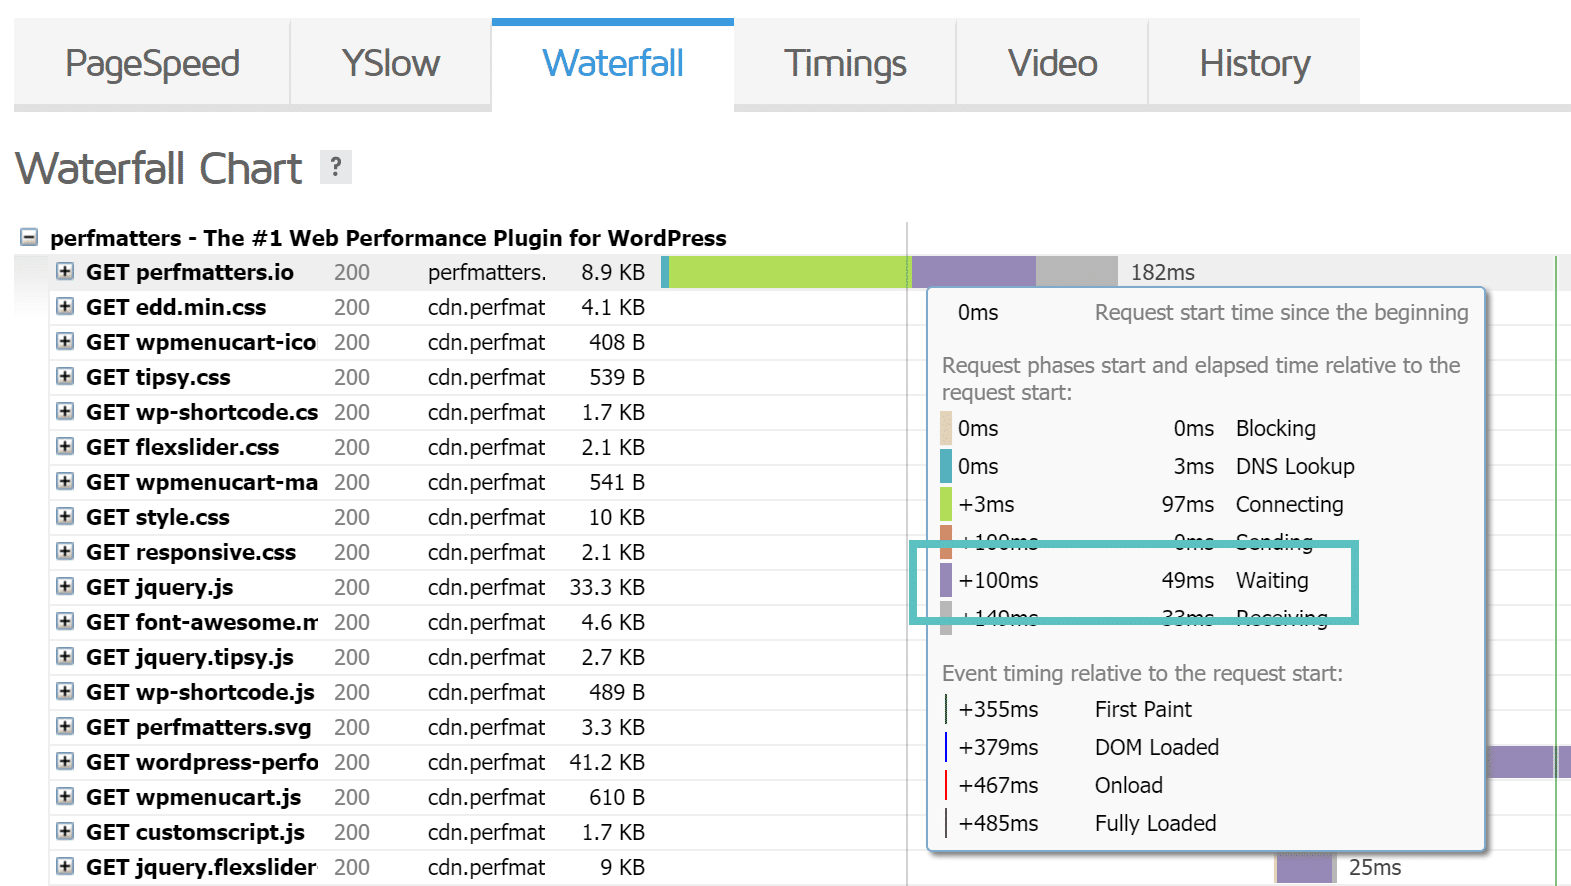
Waiting (Purple)
The wait time in GTmetrix is actually referring to the time to first byte, also known as the TTFB in some tools. TTFB is a measurement used as an indication of the responsiveness of a web server or other network resource. Generally, anything under 100 ms is acceptable and good TTFB. If you are approaching the 300-400 ms range you might have something misconfigured on your server or it might be time to upgrade to a better web stack. As you can see in our test below it was approximately 100 ms which is great.
Some easy ways to decrease your TTFB is to ensure your host has proper caching in place and utilizing a CDN.
Check out our in-depth post on all the ways to reduce TTFB on your WordPress site. It’s also a good idea to read more about Edge Caching and how it delivers pages on your site faster to your readers.
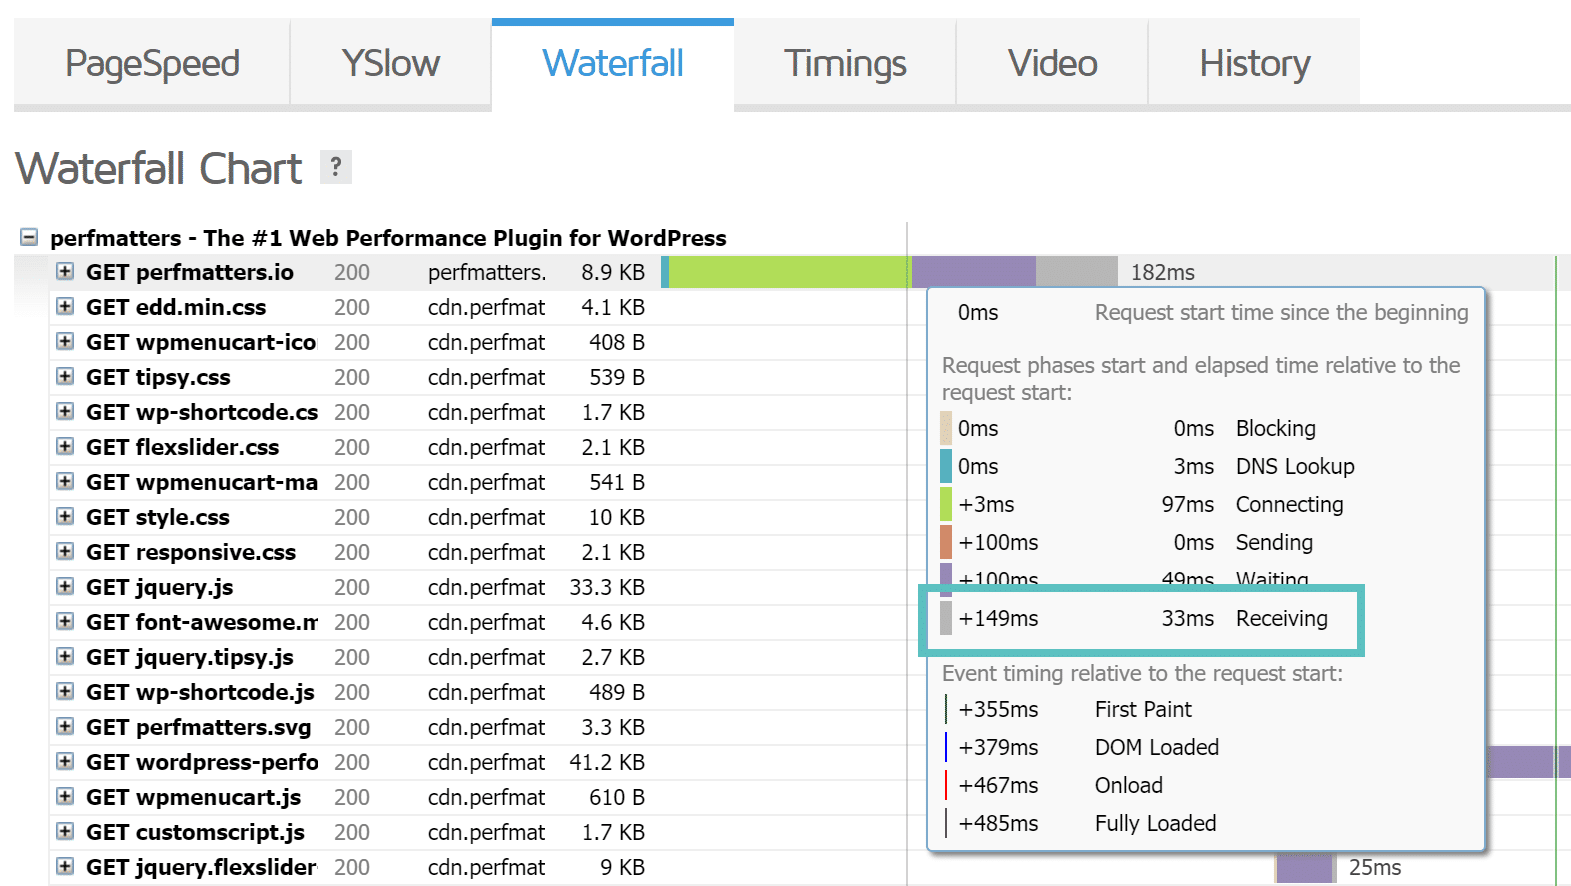
Receiving (Grey)
The receiving time is simply the time it takes for the web browser to receive data from the server.
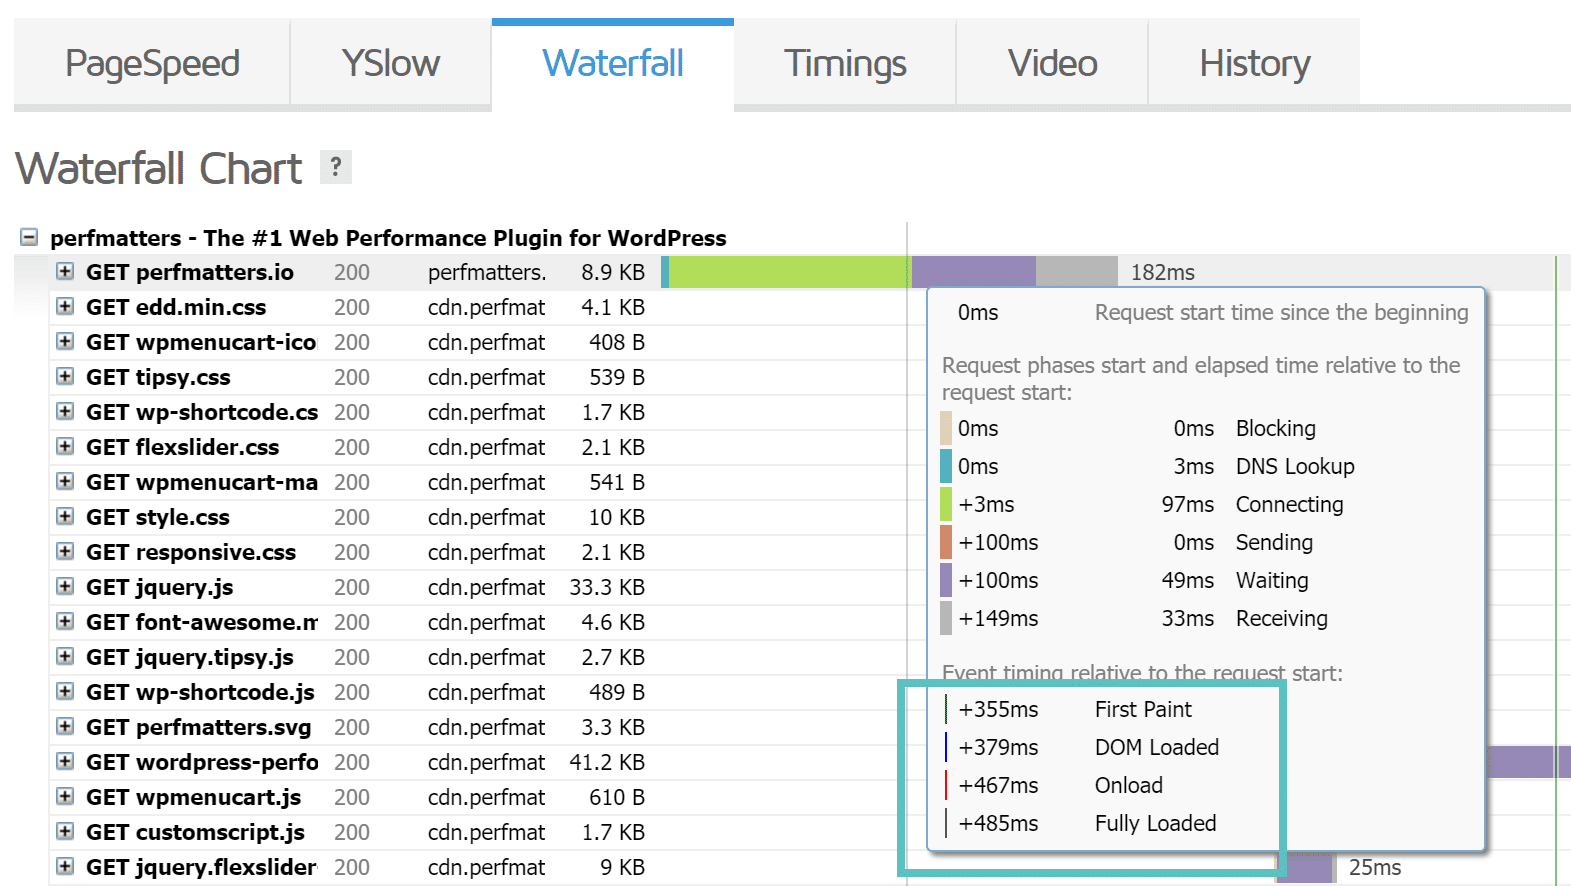
Event Timings
Each time you request a page it has event timing in which things are rendered and loaded.
- First Paint (Green Line): The first point at which the browser does any sort of rendering on the page, such as displaying the background color.
- DOM Loaded (Blue Line): The point at which the DOM (Document Object Model) is ready.
- Onload (Red Line): When the processing of the page is complete and all the resources on the page (images, CSS, etc.) have finished downloading.
- Fully Loaded (Purple Line): The point after the Onload event fires and there has been no network activity for 2 seconds.
HTTP Response Headers
You can also click on an individual request see what they call the HTTP response headers. This provides valuable information. In the screen below we can instantly see things such as gzip is enabled on the web server, it is running over HHVM, it is being served from cache (HIT, would show MISS otherwise), the cache-control headers, server architecture (this is not always visible), expires headers, the browser user-agent and more.
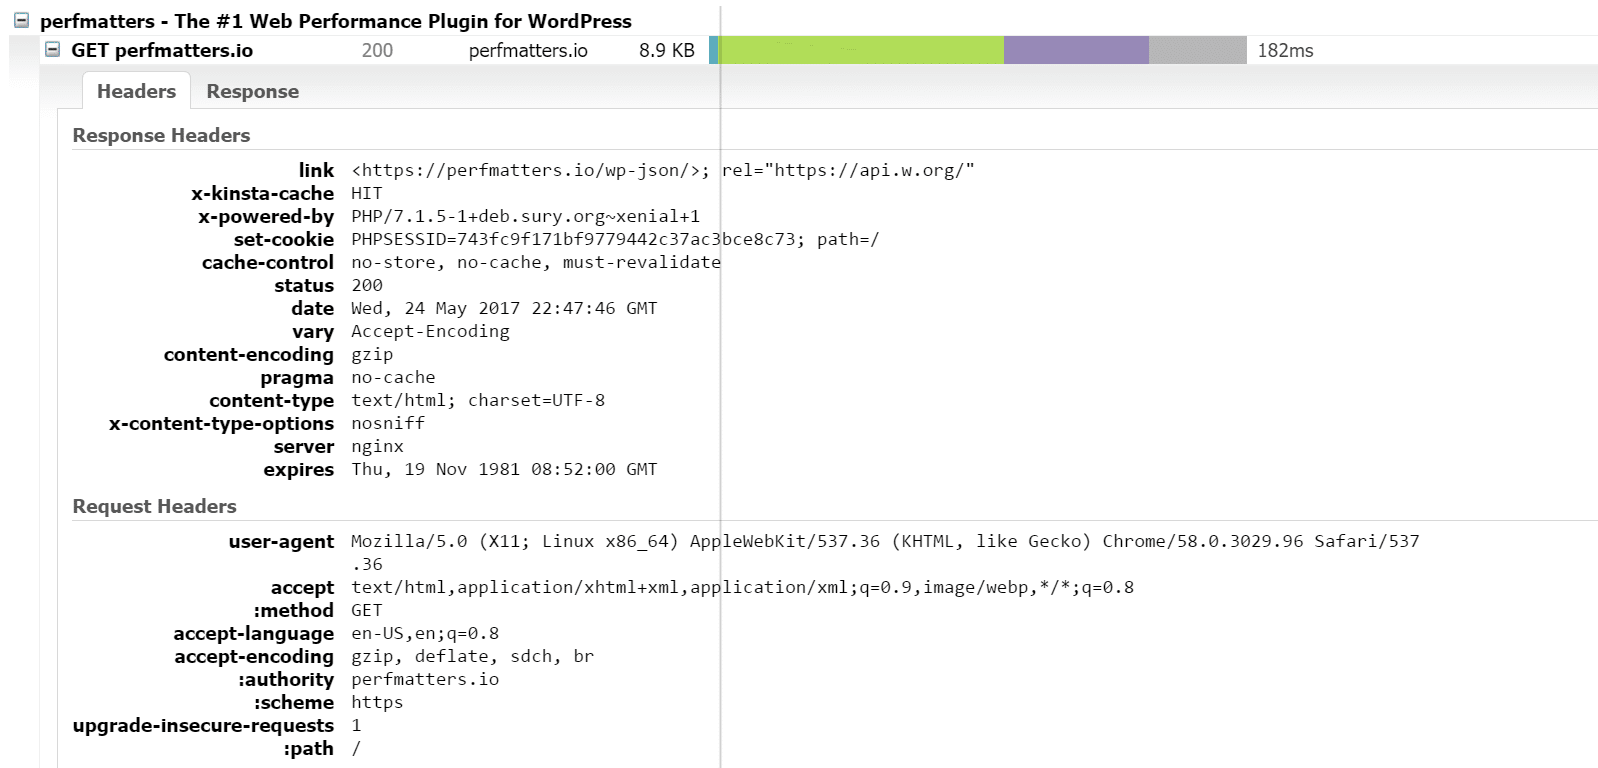
Another thing to be aware of is that the GTmetrix tool does support HTTP/2, unlike Pingdom, because it is currently using Chrome 58+ to run its tests. Chrome added HTTP/2 support in version 49. So keep in mind when you are choosing which speed test tool to use.
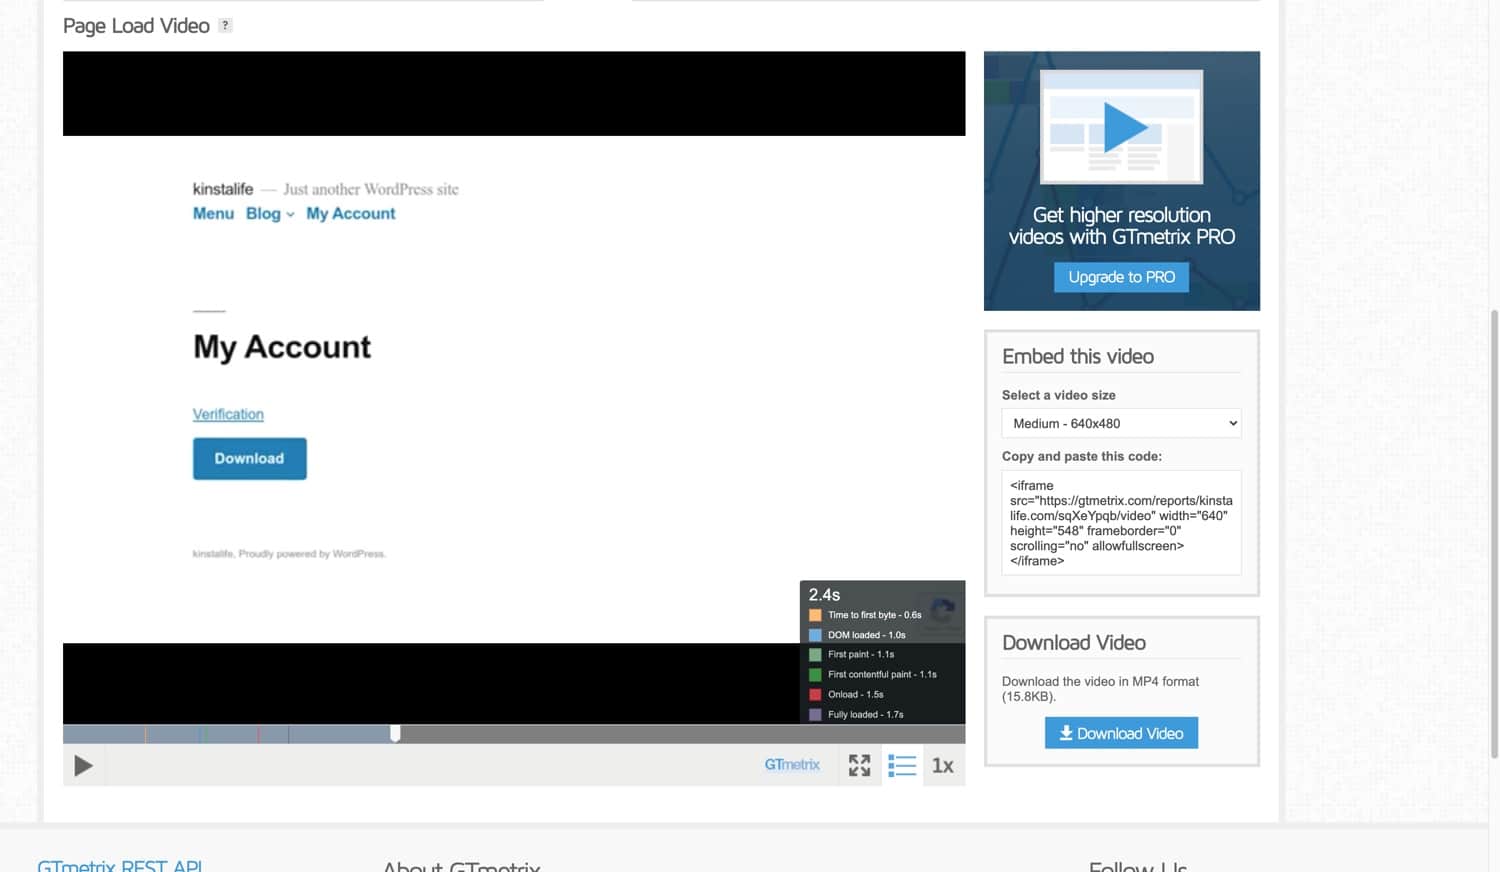
Video
To help you debug visual glitches and frontend performance issues, the latest version of GTmetrix includes a “Video” tab. With the video feature enabled, GTmetrix will automatically record an embeddable video showing how a page loads for each performance test. This feature is very useful for debugging visual issues that only appear on certain browser and screen size combinations.
History
Under the history tab you can view all of your past speed tests. There is a limit to how many are stored in free accounts. You can also monitor a URL which allows you to keep track of performance over time and see any changes when they occur.
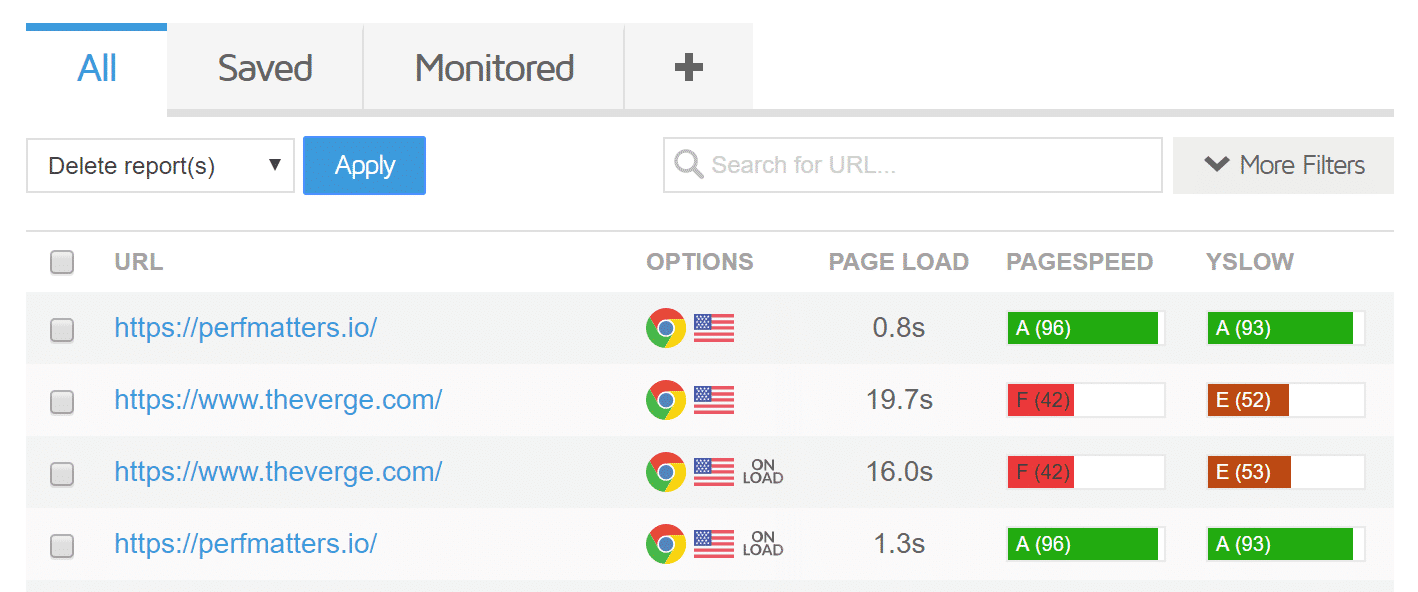
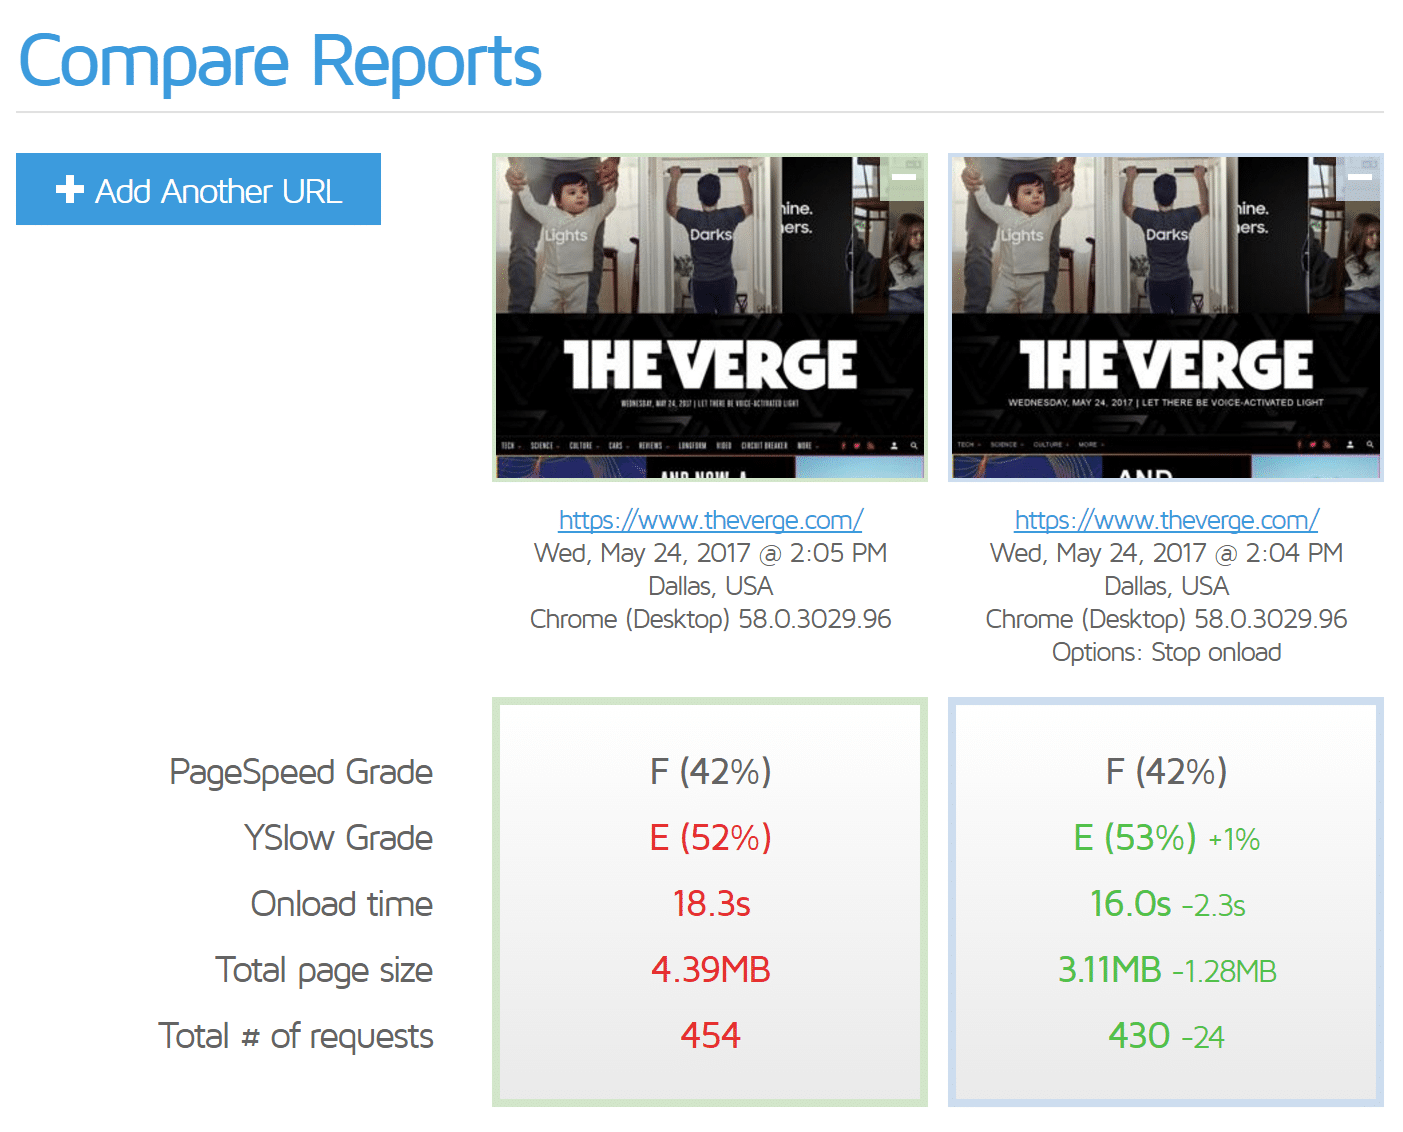
One really cool feature is you can select your past reports and compare them side by side. This can be very useful, especially when you are doing optimizations on your site to see if there are improvements. Remember, sometimes you can over optimize too.
Case Study Domain Configuration
If you got this far down in our in-depth GTmetrix dive then you are in for a treat. It is always annoying to see people share tips and case studies but then not share how they got there. So below is our exact configuration for the case study domain used above! Feel free to replicate it.
Architecture
- The case study domain (perfmatters.io) is hosted with Kinsta on a data center located in the USA (Central location). Kinsta uses HTTP/2, NGINX, MariaDB, which all contribute to the fast load times.
- The site is using HHVM. PHP 7.3 is now available at Kinsta which is even faster than HHVM! You can switch to PHP versions with a press of a button.
- The site is not using any caching plugin. Kinsta caches everything at the server level which greatly simplifies things, and in most cases is faster!
WordPress Plugins
And here is a list of the plugins being used on the WordPress site.
- The free CDN Enabler plugin is used to deploy KeyCDN.
- The free CAOS plugin is used to sync Google Analytics locally.
- The premium perfmatters plugin is used to get rid of unnecessary HTTP requests and disable things such as Emojis and Embeds.
- The premium Gonzalez plugin is used to disable certain scripts from loading.
- The premium Imagify plugin is used to compress images.
Recommended Tutorials for Further Reading:
- How to Speed up Your WordPress Site (Ultimate Guide)
- How to Disable Emojis in WordPress
- How to Disable Embeds in WordPress
- Identify And Analyze External Services On Your WordPress Site
- How to Score 100/100 in Google PageSpeed Insights with WordPress
- How to Diagnose High Admin-Ajax Usage on Your WordPress Site
- 7 Tips on How to Reduce DNS Lookups and Speed Them Up
Summary
As you can see, knowing how the GTmetrix speed test tool works a little better and what all the charts mean can help you make a more data-driven decision when it comes to performance. A waterfall analysis as we call it is crucial to know how your individual assets load. And remember, when it comes to comparing it with Pingdom, they are different tools and so it is better to stick with one or the other as they calculate things differently. Got any other great GTmetrix tips?
If you would like to see more in-depth articles like the one above, please let us know below in the comments!

Brian has a huge passion for WordPress, has been using it for over a decade, and even develops a couple of premium plugins. Brian enjoys blogging, movies, and hiking. Connect with Brian on Twitter.

