Server Logs
You can view log files within MyKinsta and download additional logs via SFTP. Log files cannot be manually cleared and are retained for up to 4 days. These files are valuable for troubleshooting errors and identifying other issues on your site.
If you have a Single 1.25M or above, WP 60 or above, or an Agency plan, you can reach out to our Support Team to add a Splunk Forwarder to your site. This tool indexes your logs and sends them to Splunk, a third-party platform designed for easy monitoring, searching, analysis, and visualization of log data. To use Splunk, you need a Splunk account with access to the Splunk Cloud Platform.
View logs in MyKinsta
Three types of log files are available in MyKinsta: error.log, kinsta-cache-perf.log, and access.log.
In MyKinsta, go to Sites and select the site for which you want to view logs. Click on the Logs tab to open the Log viewer page. Use the search box to find text in the current file.
error.log
This file records PHP errors and warnings generated by your WordPress site. It can include:
Fatal PHP errors
Warnings and notices
Plugin/theme compatibility issues
Memory limit or timeout errors
Server-level issues related to PHP execution
Use it for debugging broken pages, white screens of death, and plugin/theme issues.

kinsta-cache-perf.log
This file logs cache performance details specific to Kinsta’s caching layer. It typically shows:
When a page was served from cache vs. bypassed
Cache HIT / MISS / BYPASS events
Cache refresh/purge information
Response times and related metrics
Details about why caching did or didn’t occur (cookies, query params, POST requests, etc.)
Use it to diagnose caching behavior, improve performance, or confirm whether pages are being cached correctly.

access.log
This is the web server access log, recording every HTTP request made to your site. It includes:
Visitor IP addresses
Requested URLs and query strings
HTTP status codes (200, 301, 404, 500, etc.)
Timestamps
Request methods (GET, POST, etc.)
Response sizes and processing time
Use it for security auditing, traffic monitoring, locating 404 errors, and analyzing site access patterns.

Search and filter logs
If you’re looking for a specific log entry, start by filtering the logs by timeframe. Then add a search string to narrow down the results. All matching text is highlighted, allowing you to easily identify each relevant entry.

Download logs in MyKinsta
Kinsta’s file manager provides a quick and easy way to download log files from your site.
- In MyKinsta, go to Sites > sitename > Files.
- To access the site’s root directory, click the root directory path in the breadcrumbs.
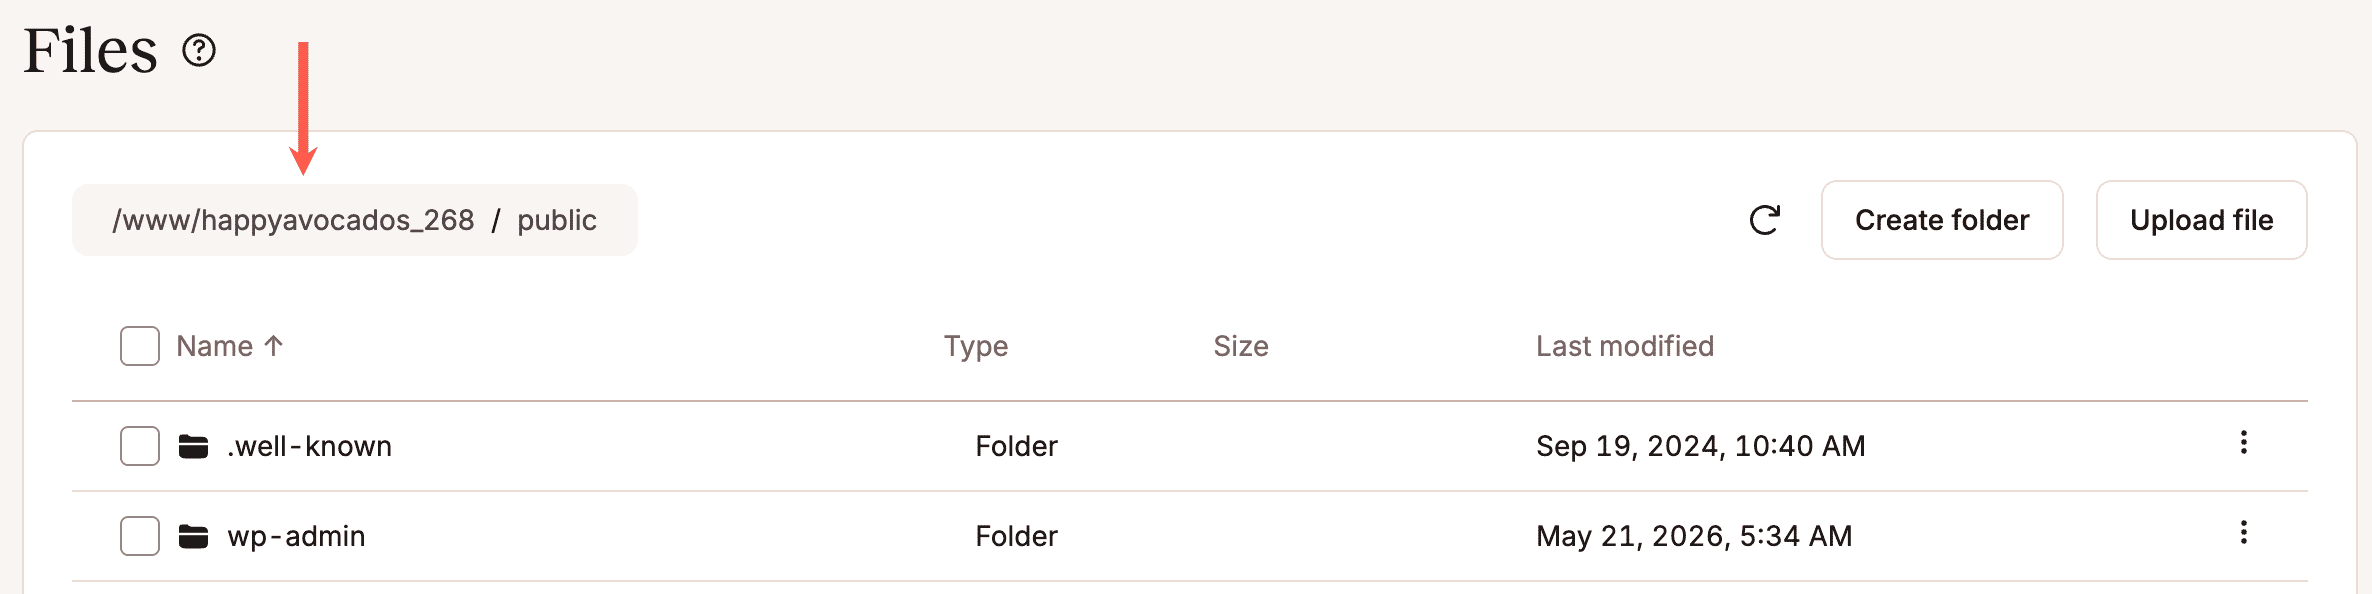
Click the root directory path to access the logs. - Open the logs folder.
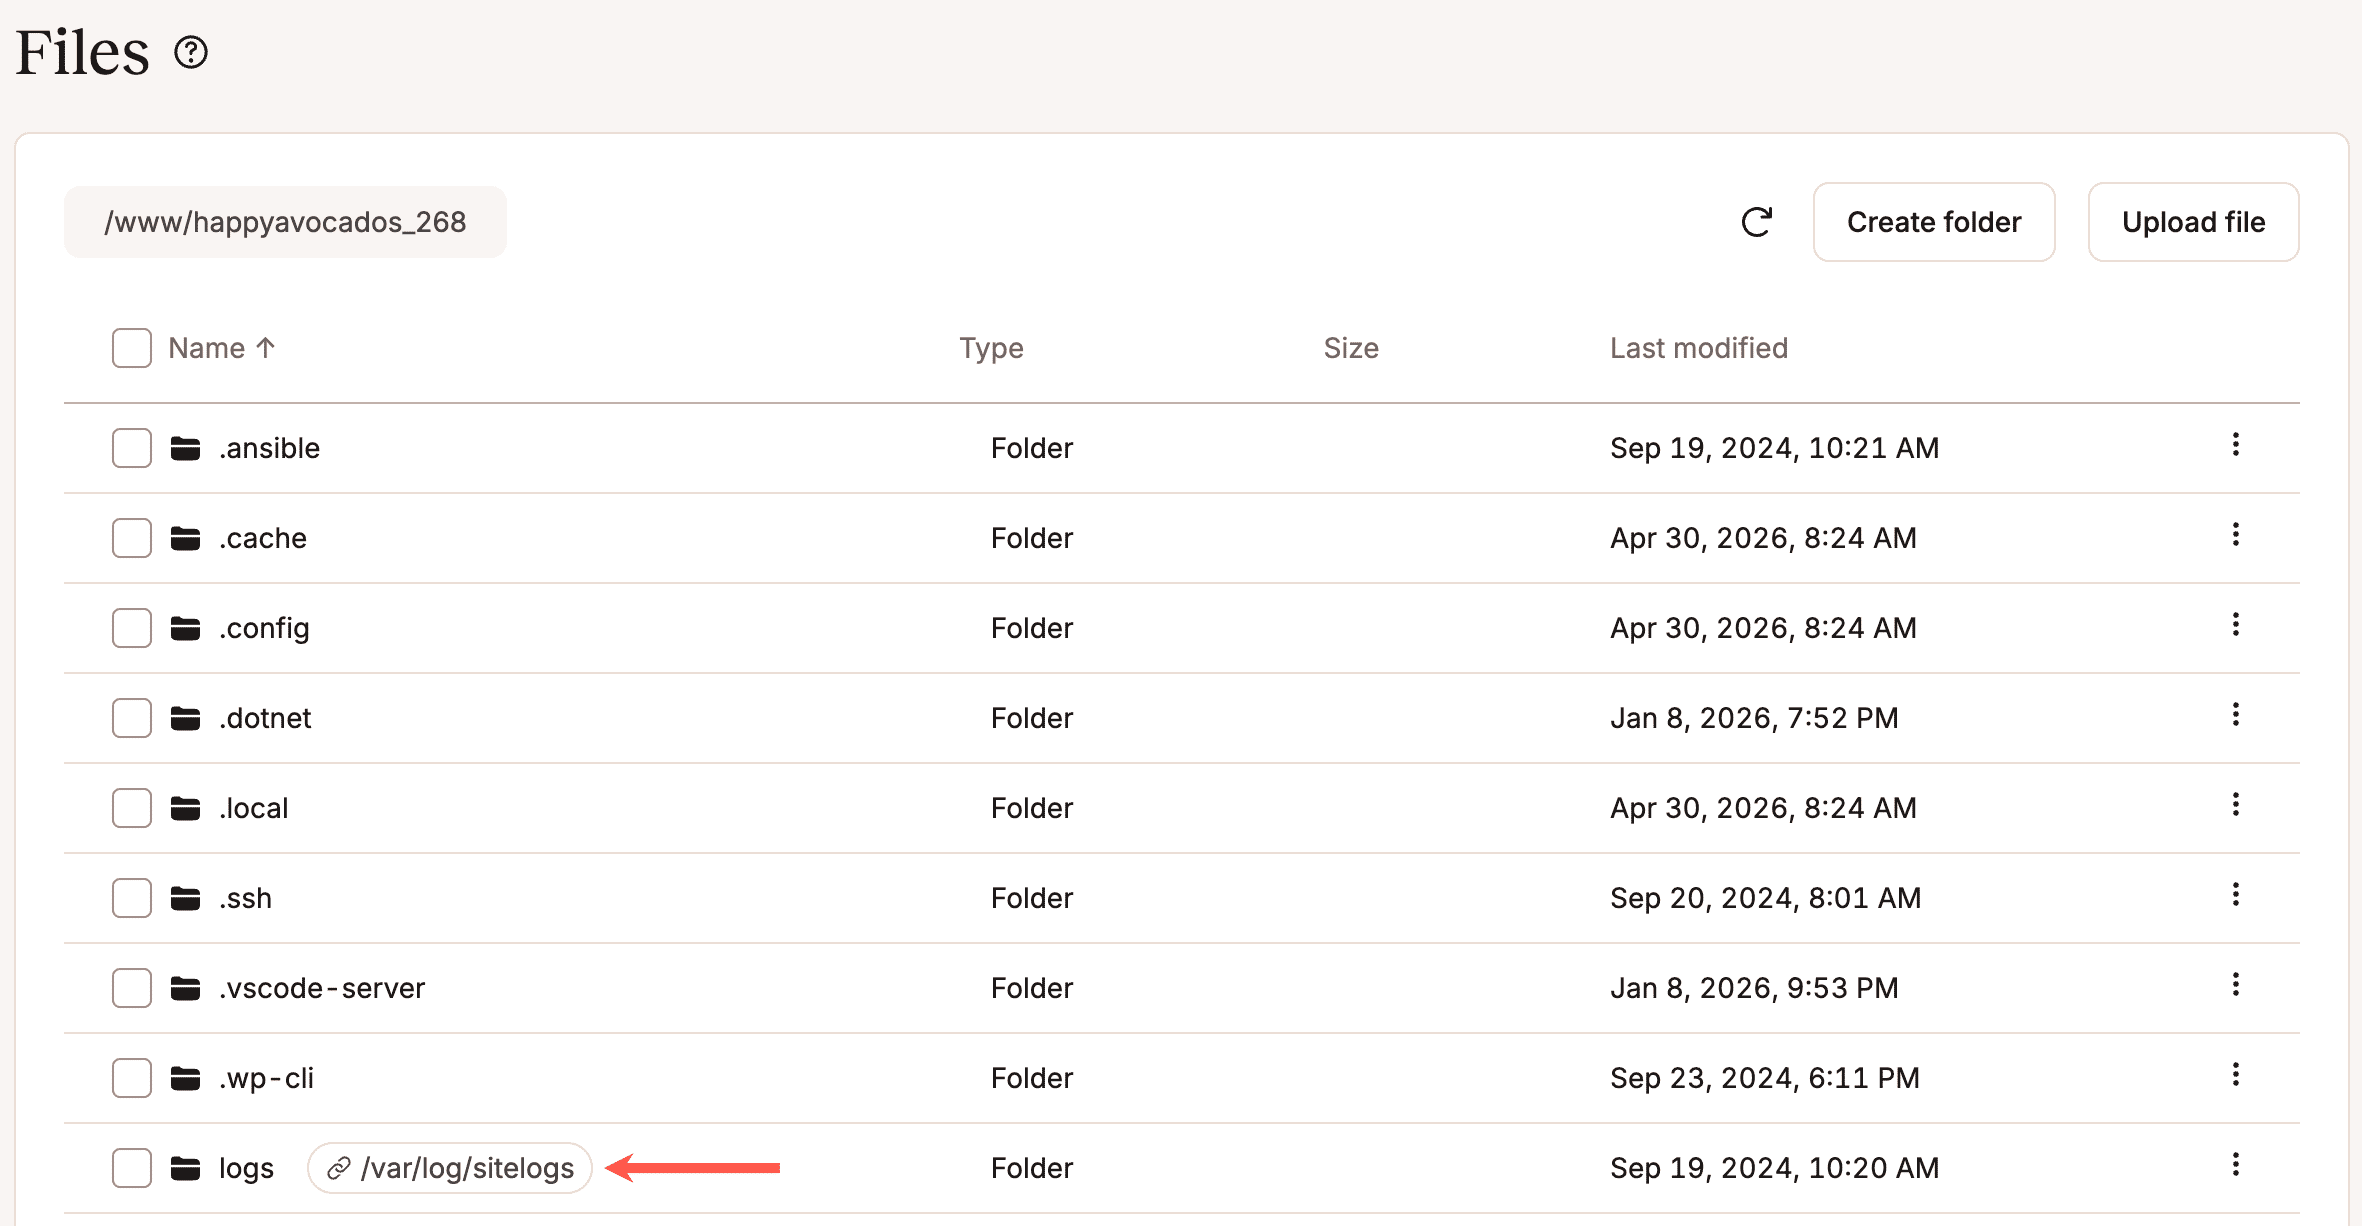
Open the logs folder. - Locate the log file you want to download, click the kebab (three-dots), and then click Download.
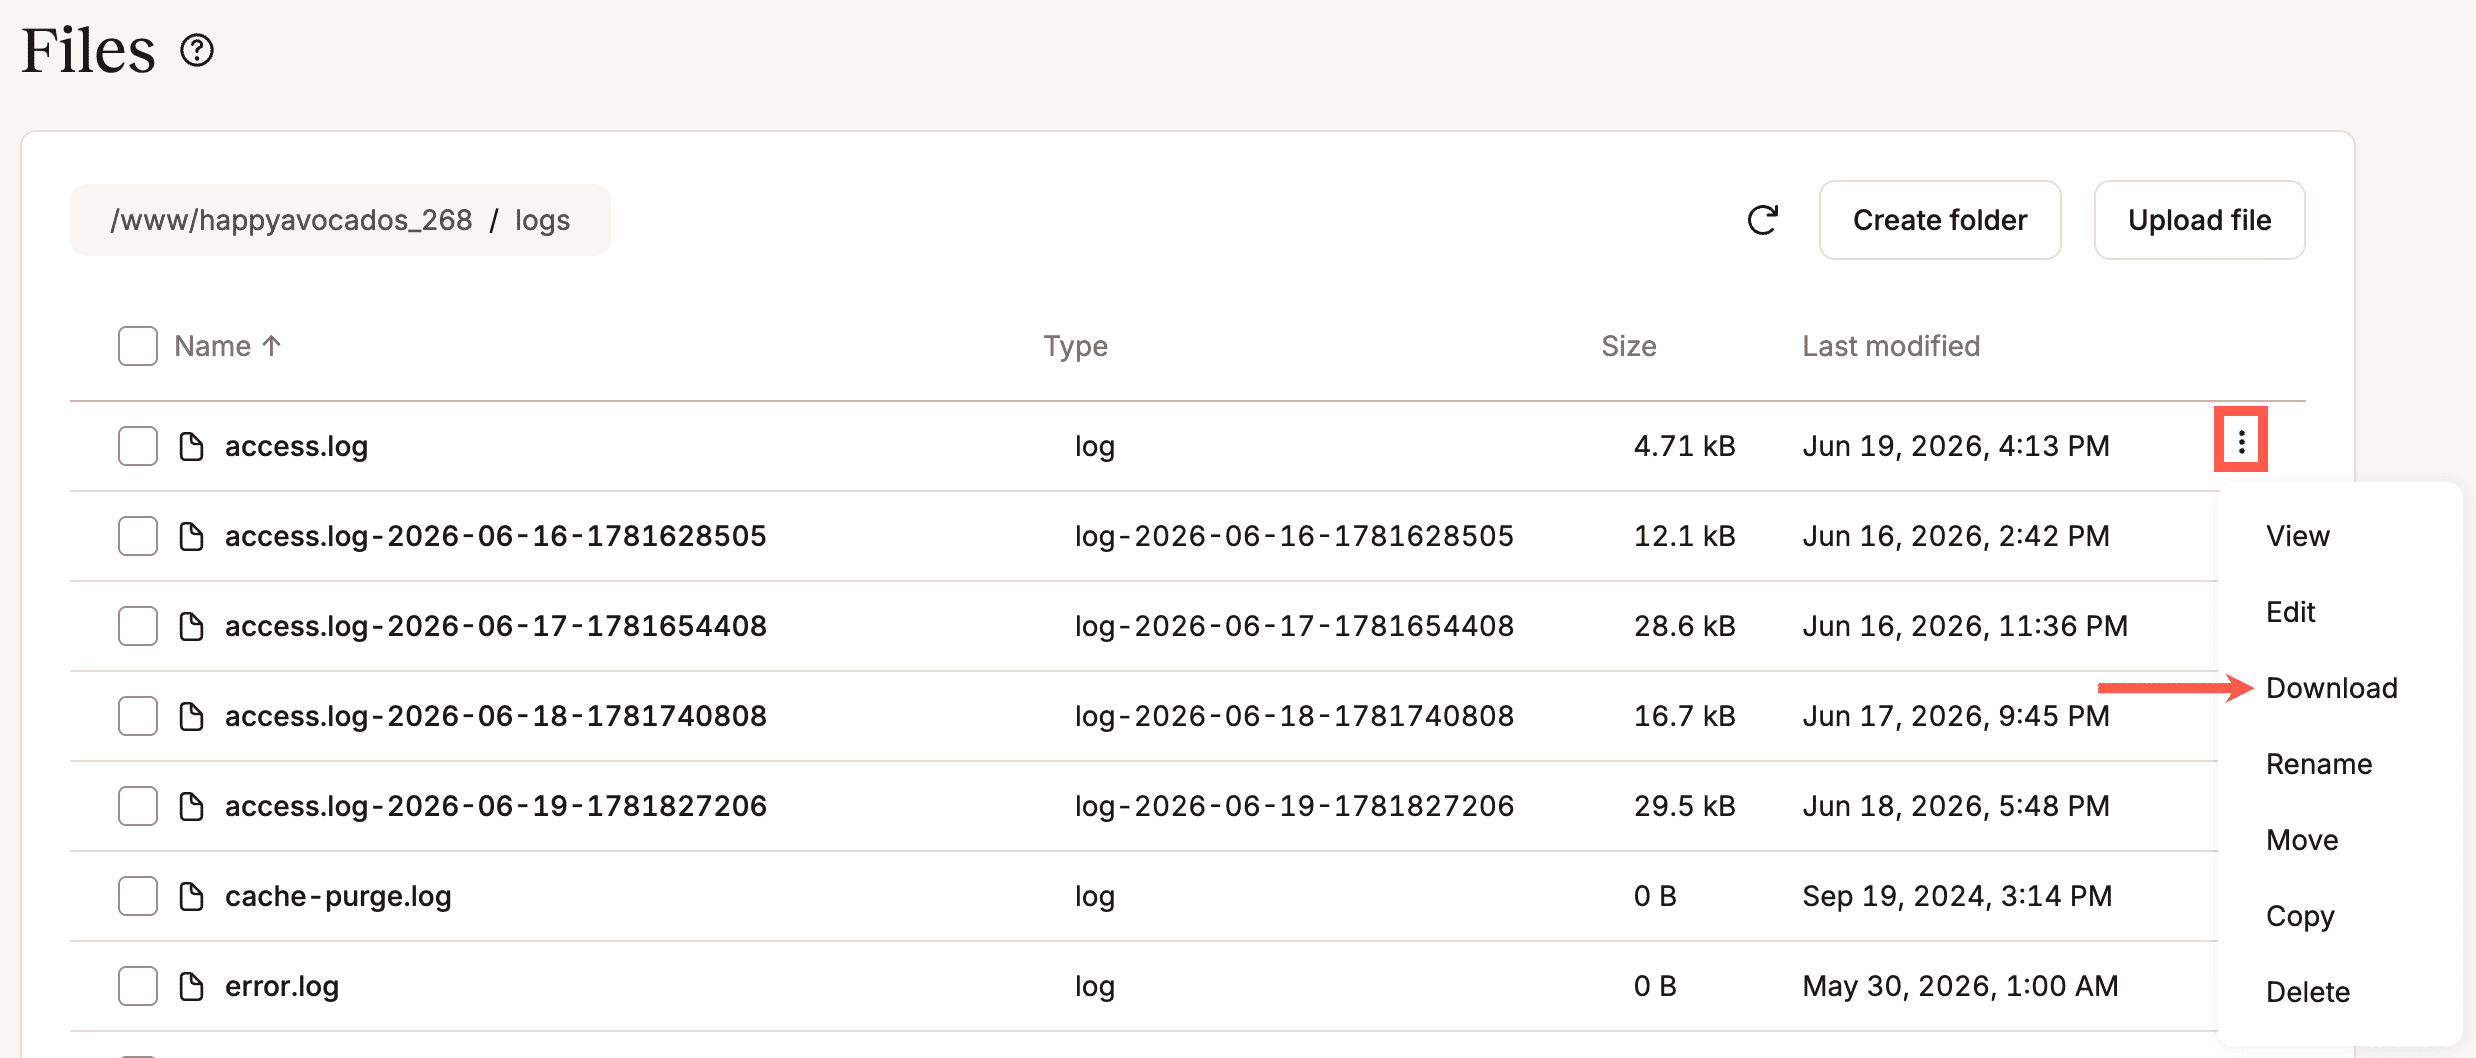
Download the log file.
The log file is downloaded to your computer and can be opened with any text editor for further analysis.
Download logs with SFTP
In addition to the error.log, kinsta-cache-perf.log, and access.log files, you can also download your cache-purge.log and mail.log files using SFTP.
- Connect to your site with SFTP.
- Navigate into the logs folder/directory.
- In that folder, you’ll find your log files. You can download any or all of these.
- Once you’ve downloaded the log file(s), you can open any of them with your preferred text editor or import them into a log viewing application if you prefer.
Log file descriptions
For each log file type, the file without a date at the end of the name contains data for the current day. Historical logs from previous days are named with the date of the following day. For example, an access.log file named access.log-2022-07-25-1658707208 contains logs from just after midnight July 24, 2022, until just before midnight July 25, 2022.
- access.log: This file is a log of Nginx requests for the current day.
- error.log: Specific errors, including PHP errors, are logged here.
- kinsta-cache-perf.log: Cache header status (hit, miss, or bypass) for requests is recorded here.
- cache-purge.log: This file contains a log of requests to cache-clearing URLs (including cache-clearing URLs configured in the Kinsta MU Plugin).
- mail.log: A record of the number of emails sent from your site each hour. Each line will look something like this:
[22/Sep/2021:21:56:01 +0000] "H" 1 "no_action"- Format is:
[time] "H" [count] "no_action" “H”and“no_action”are constants that can be ignored.
- Format is:
Log file formats
access.log
Each line will look something like this:
kinstahelptesting.kinsta.cloud 98.43.13.94 [22/Sep/2021:21:26:10 +0000] GET "/wp-admin/" HTTP/1.0 302 "-" "Mozilla/5.0 (Macintosh; Intel Mac OS X 10.15; rv:92.0) Gecko/20100101 Firefox/92.0" 98.43.13.94 "/wp-admin/index.php" - - 472 0.562 0.560Format
$http_host_cleaned $remote_addr_kinsta $time_local $request_method $request_uri $server_protocol $status $http_referer $http_user_agent $http_x_kinsta_edge_incomingip $uri $log_x_pull $gzip_ratio $bytes_sent $request_time $upstream_response_timeColumn descriptions
$http_host_cleaned: Hostname being requested by the client.$remote_addr_kinsta: IP of the connecting client.$time_local: UTC-based timestamp for the transaction from the browser.$request_method: HTTP method used (GET/POST/PUT/DELETE) when accessing the site resource.$request_uri: Full/raw site path (URI) requested from the site after the domain.$server_protocol: Protocol being used to access the site (HTTP/HTTPS).$status: Response code from the site (2xx,3xx,4xx,5xx, etc.).$http_referer: Any forwarding or URL tags directing the request to the site/URI.$http_user_agent: Browser or software process type of the client making the request.$http_x_kinsta_edge_incomingip: Usually the same as$remote_addr_kinstaindicating the client IP.$uri: Cleaned up version of$request_uri.$log_x_pull: Logged information on whether the request used our previous implementation of Kinsta’s CDN (powered by KeyCDN). This column may be removed in the near future.$kinsta_compression_ratio: Compression ratio used on request.$bytes_sent: Size of the request being sent.$request_time: Total time spent on request.$upstream_response_time: Time for PHP to process the request.
error.log
Each line will look something like this:
2019/06/17 15:29:57 [error] 55810#55810: *360896 FastCGI sent in stderr: "PHP message: PHP Parse error: syntax error, unexpected end of file in /www/kinstahelptesting_610/public/wp-content/plugins/code-snippets/php/admin-menus/class-edit-menu.php(213):eval()'d code on line 10" while reading response header from upstream, client: 126.100.65.37, server: kinstaexample.com, request: "POST /wp-admin/admin.php? page=edit-snippet&id=6 HTTP/1.0", upstream: "fastcgi://unix:/var/run/php7.3-fpm-kinstahelptesting.sock:", host: "kinstaexample.com", referrer: "https://kinstaexample.com/wp-admin/admin.php?page=edit-snippet&id=6Note: Some errors may be followed by a Stack trace, which provides more details about an error and is beneficial when debugging errors.
Format
UTC timestamp, severity level, error code, error ID, stderr message, client IP, site domain, HTTP/S request type, URI, protocol, upstream process handling request, interal host/port details, referrer URLColumn descriptions
UTC timestamp: UTC-based timestamp for the error from the browser.severity level: Severity of the error (error, warn, etc.).error code: Process and thread ID.error ID: Connection ID.stderr message: Standard error message.client IP: The IP address that made the request.site domain: Domain of the site where the error occurred.HTTP/S request type: HTTP method being used (GET/POST/PUT/DELETE).URI: URI requested.protocol: Protocol used for the request.upstream process handling request: Process on the server that handled the request.interal host/port details: Hostname used internally by the server.referrer URL: The URL the request came from.
kinsta-cache-perf.log
Each line will look something like this:
Format
$time_local $sent_http_x_kinsta_cache $cache_zone $remote_addr_kinsta $request_method $request_uri $server_protocol $log_cookie $upstream_response_timeColumn descriptions
$time_local: UTC timestamp for the request from the browser.$sent_http_x_kinsta_cache: Status of cache request (MISS/BYPASS/HIT).$cache_zone: Designated internal cache zone for the cached item.$remote_addr_kinsta: Remote client IP.$request_method: HTTP/S method used for the request (GET/PUT/POST/DELETE).$request_uri: Resource path (URI) of the request after URL.$server_protocol: HTTP vs HTTPS protocol.$log_cookie: Associated cookie to the cached item.$upstream_response_time: Time for CDN upstream to process the request.
cache-purge.log
Each line will look something like this:
Format
$time_local $remote_addr_kinsta $request $upstream_response_timeColumn descriptions
$time_local: UTC timestamp for the request from the browser.$remote_addr_kinsta: Internal tool IP requesting cache purge.$request: Request type, which will be POST for any initiated purges.$upstream_response_time: Time to complete purge action.
mail.log
Each line will look something like this:
[22/Sep/2021:21:56:01 +0000] "H" 1 "no_action"Format
[time] "H" [count] "no_action"Column descriptions
time: UTC timestamp from the browser."H": Constant that can be ignored.count: Number of emails sent from your server."no_action": Constant that can be ignored.