Analytics
Kinsta charges for Database Hosting based on the size, runtime, and egress bandwidth (when applicable) of your database. With Database Analytics, you can get insights into your database’s usage data. You can view analytics for each database in database-level analytics or for all of your databases in company-level analytics. For more information about how we calculate your invoice, refer to Database Pricing.
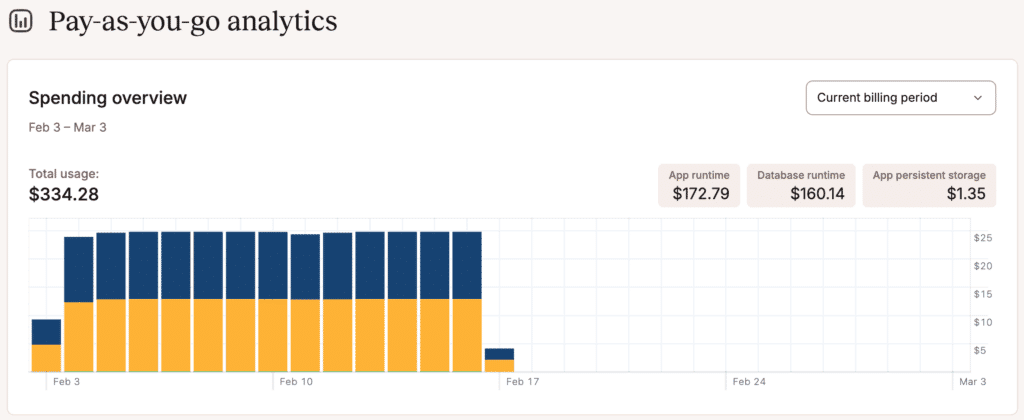
The database billing amounts are also included in the Spending overview chart within the Pay-as-you-go analytics on the MyKinsta Dashboard. This chart shows the spending overview for all pay-as-you-go services, including applications, databases, and static sites.
Database level analytics
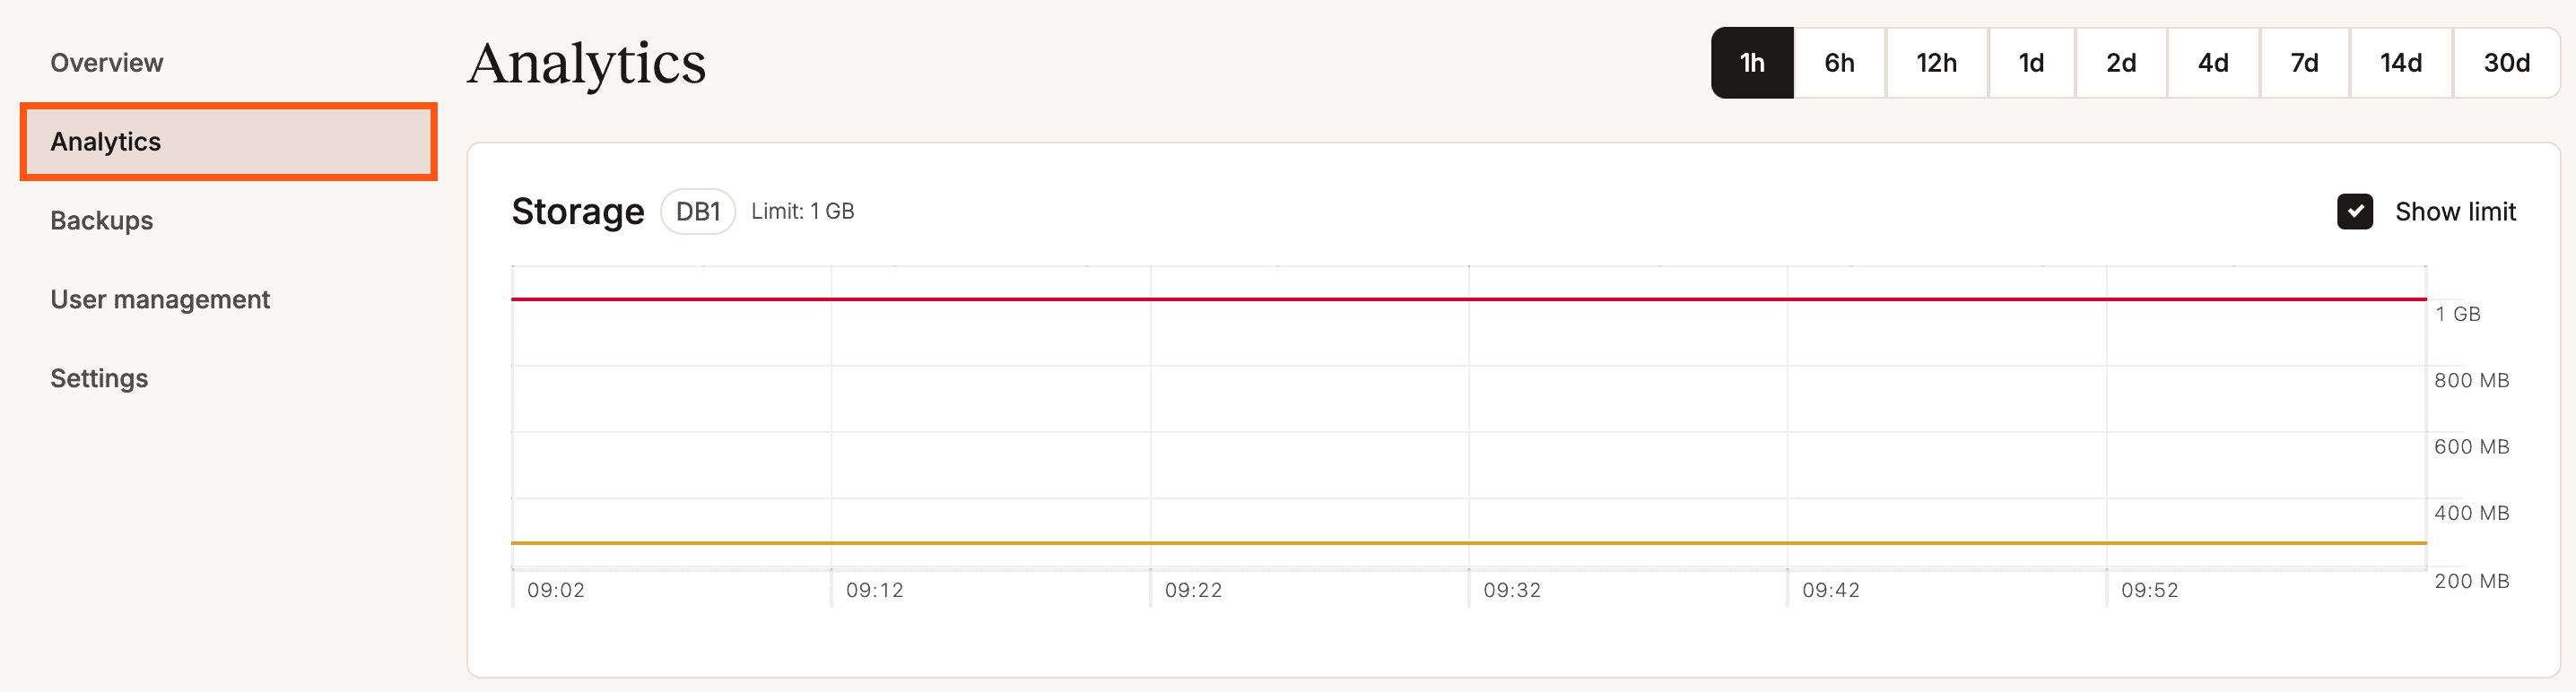
Database-level analytics shows you information about your database’s storage, memory, and CPU usage.
When viewing the database-level analytics, you can choose to see data for the past 1 hour, 6 hours, 12 hours, 1 day, 2 days, 4 days, 7 days, 14 days, or 30 days.
To access these in-depth reports, go to your database’s Analytics page (Databases > dbname > Analytics).
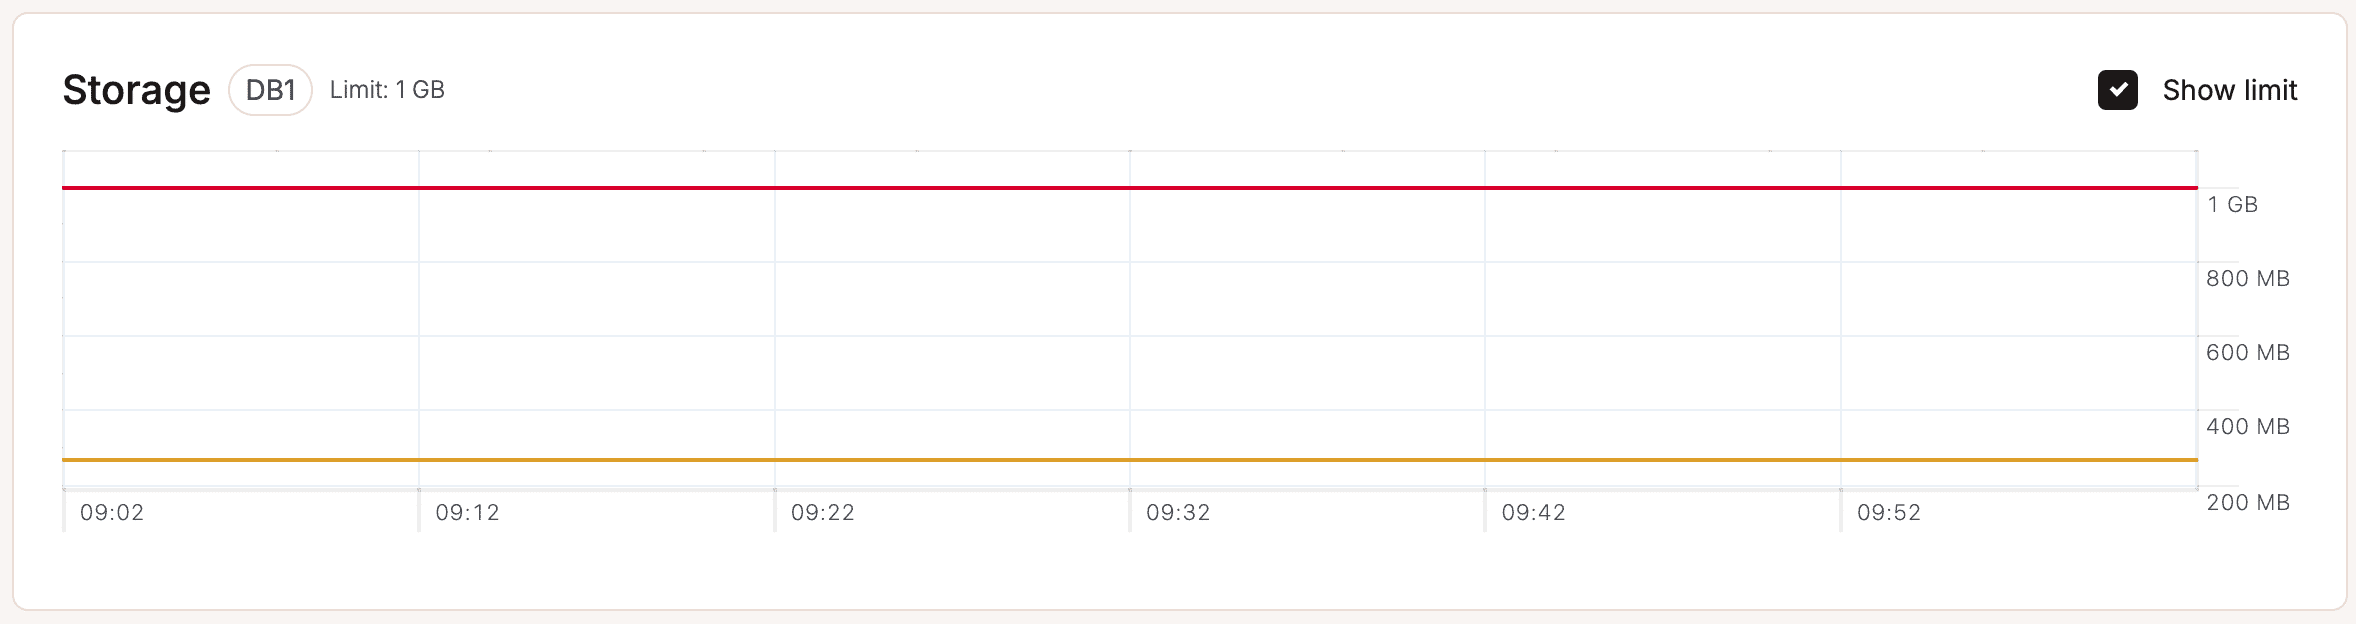
Storage
The Storage chart shows the data stored in the database (including any add-on storage) for the selected time period. Select Show limit to compare your usage to your service’s resource limit.
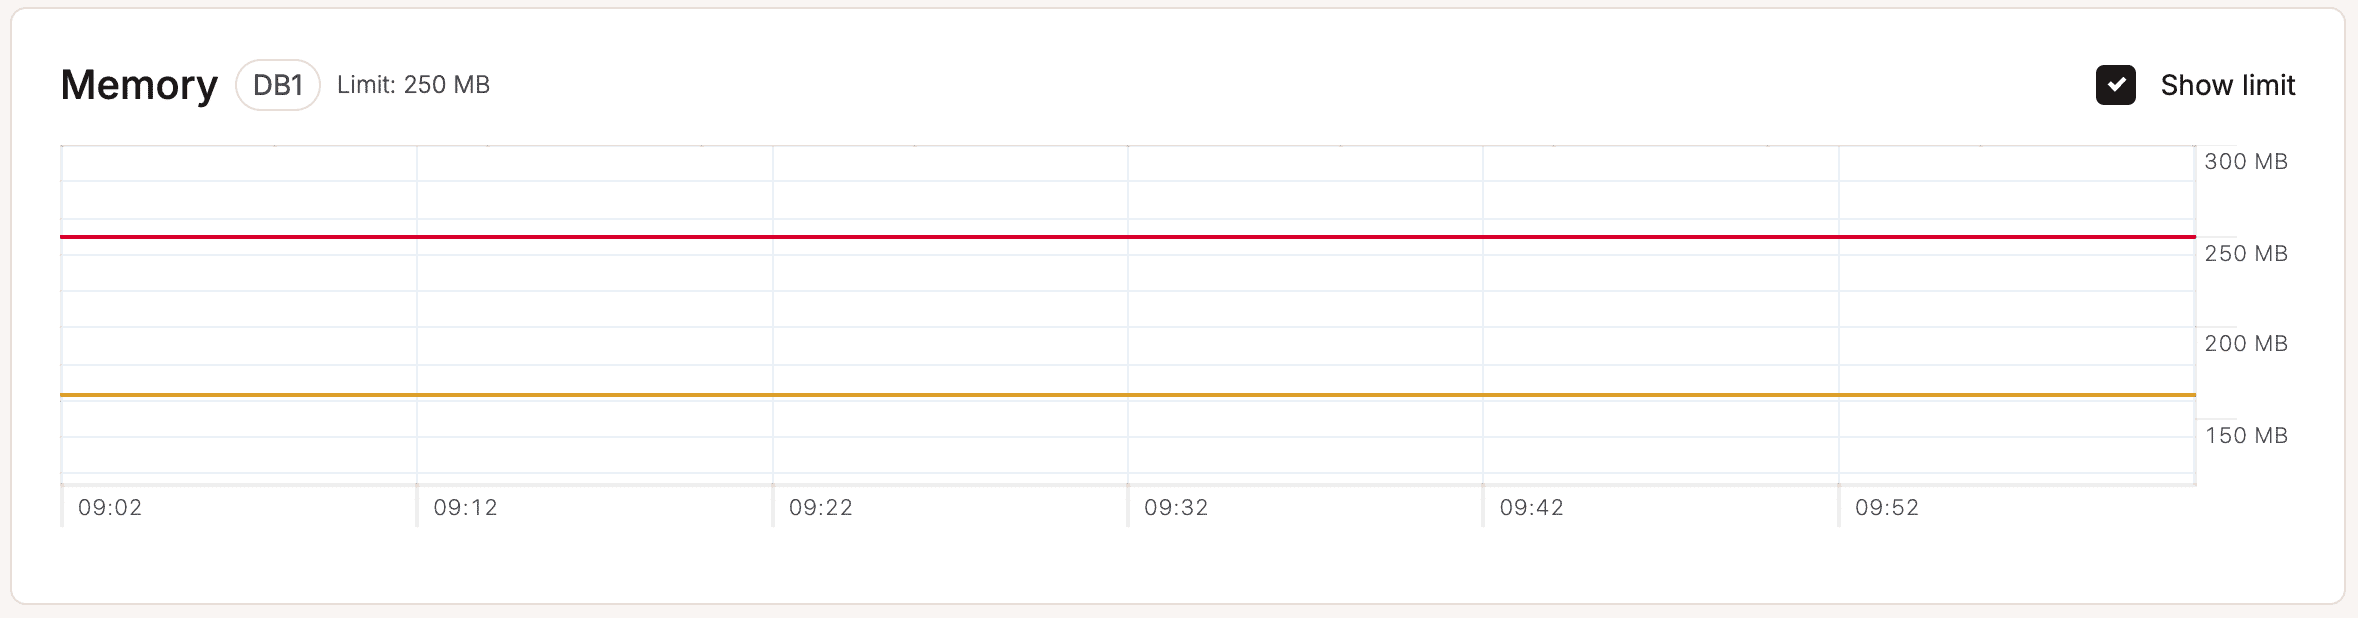
Memory
The Memory chart shows the average of the total memory (RAM) used for the selected time period. Select Show limit to compare your usage to your service’s resource limit. If a database uses most or all of the available memory, we recommend a larger database type with more available memory. You can change the size in your Database Settings (Database Settings > Basic details) if you need a larger database.
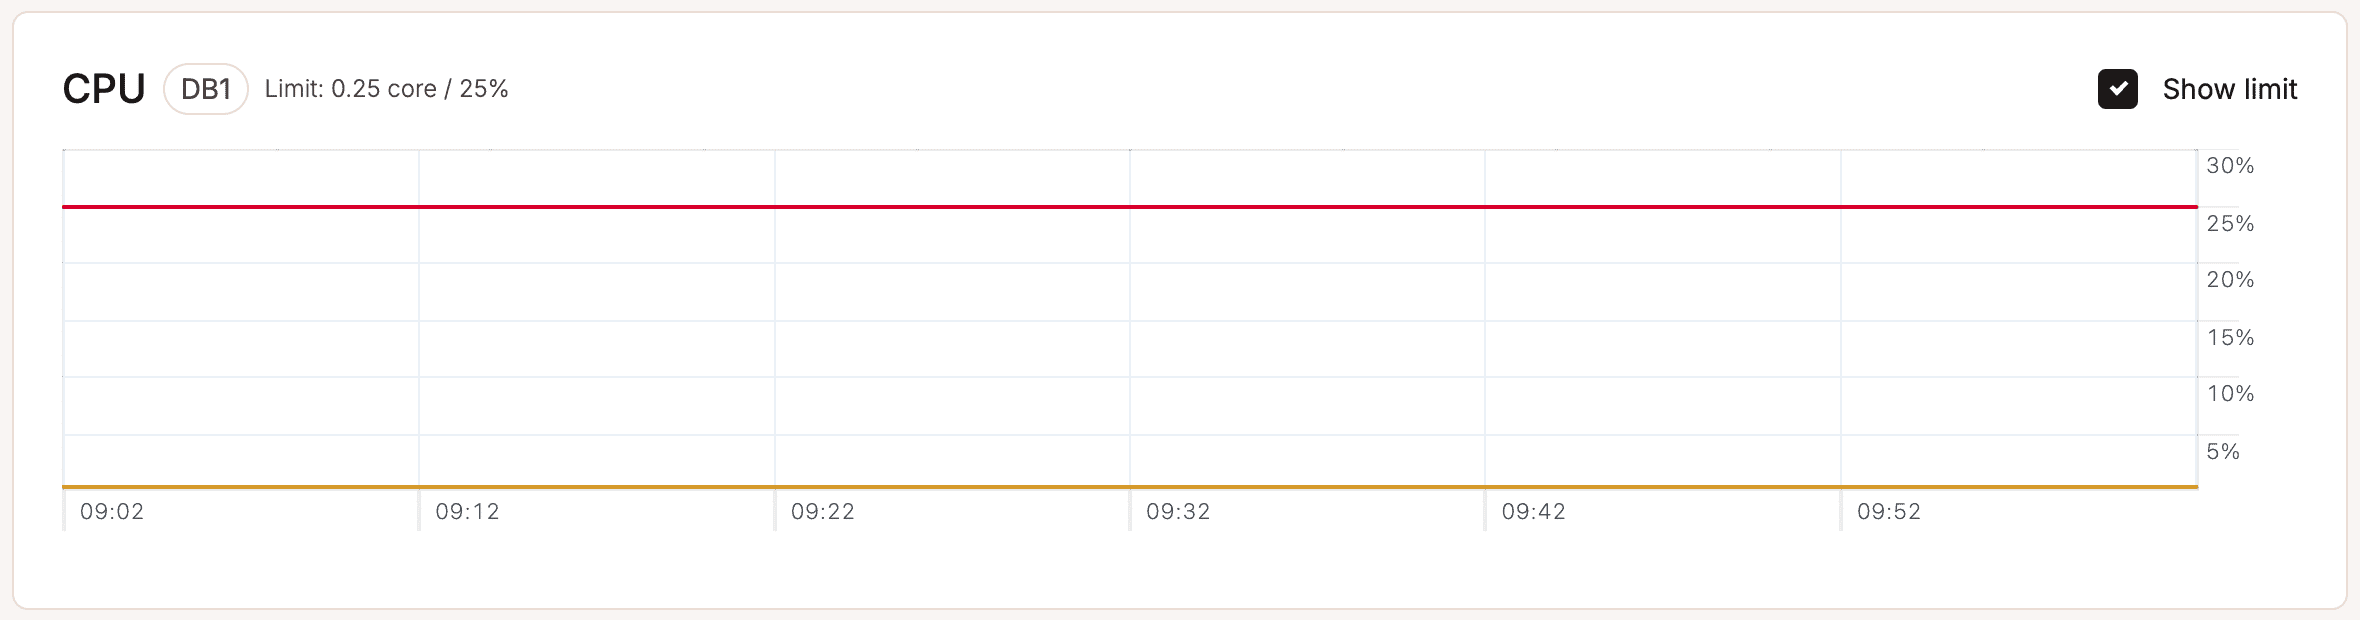
CPU
The CPU chart shows the average of the total CPU utilization for the selected time period, expressed as a percentage of the instance’s CPU resources. Select Show limit to compare your usage to your service’s resource limit. If you see a high percentage of CPU usage (near 100%), we recommend a larger database type with more available CPU. You can change the size in your Database Settings (Database Settings > Basic details) if you need a larger database.
Company level analytics
Company-level analytics shows you the total bandwidth and runtime for all of your databases. To access these reports, go to your company’s Analytics page (Your name > Company settings > Analytics). Note: If you also have Application Hosting or WordPress Hosting, you’ll need to select the Databases subpage to view your company-level analytics.
When viewing company-level analytics, you can choose to see data for the past 24 hours, 7 days, 30 days, or the current billing cycle (Current month in the dropdown menu).
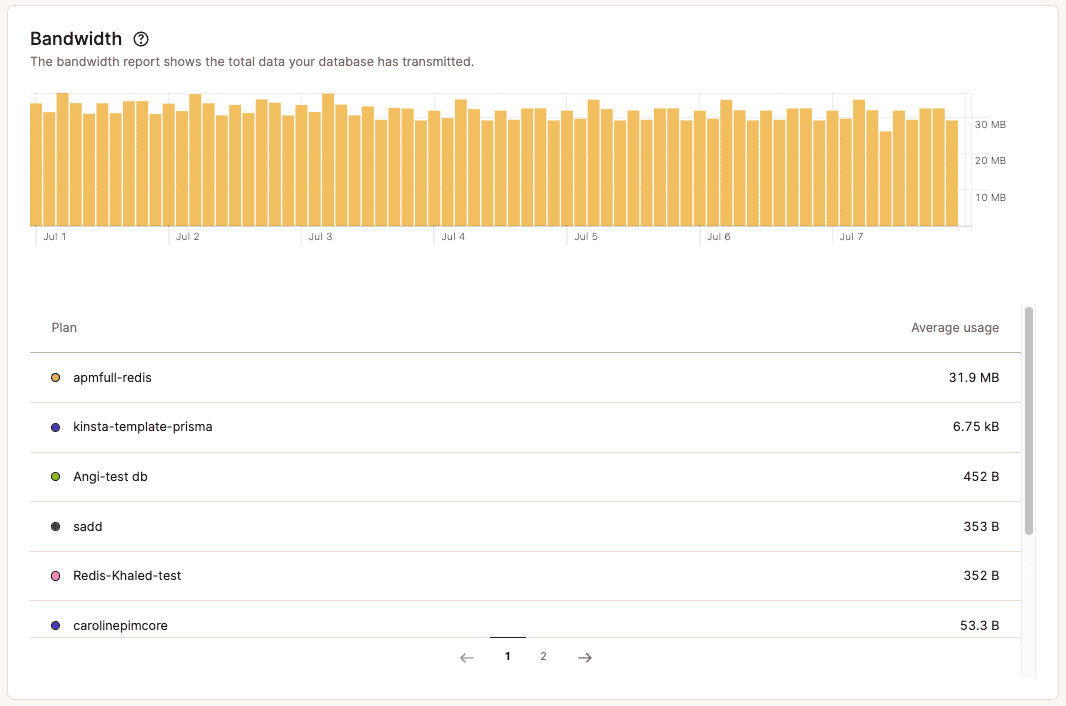
Bandwidth
The Bandwidth chart shows the total egress data all of your databases have transmitted for the selected time period.
Each color block represents an individual database, so you can see which ones use the most or the least amount of bandwidth.
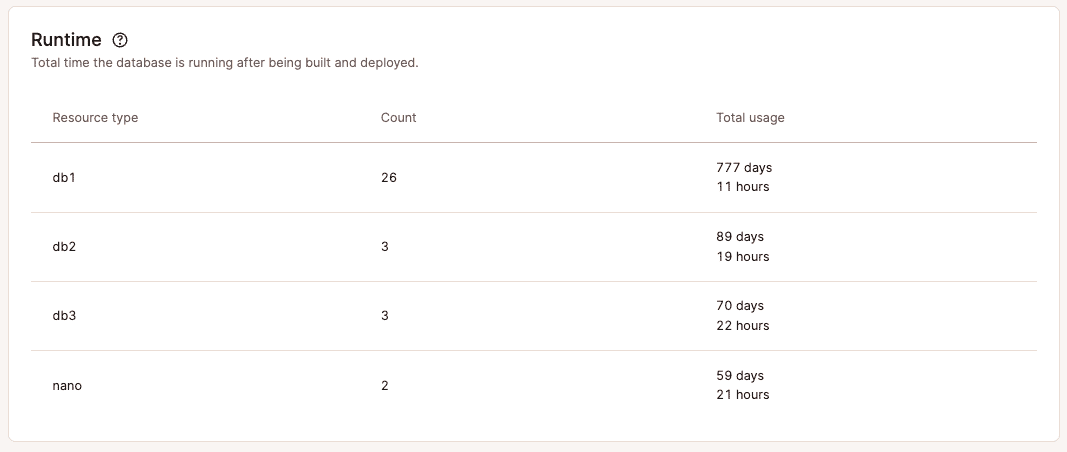
Runtime
The Runtime report shows the total time all databases have been running after being built and deployed, with each resource type and count in a separate row.
Additional notes
Analytics data is retained for 30 days. We suggest checking your Database Analytics frequently after first creating your Database at Kinsta and periodically thereafter. If you see any unexplained analytics data or inconsistency that concerns you, let our Support team know, and we can further investigate to help determine the cause.