Debugging
It happens to all of us; there’s some issue or error with our site, and we need to do some troubleshooting to figure out what’s causing the issue and how to solve it.
WordPress is a dynamic CMS, which means code is constantly running in the background to generate the pages you see. Occasionally, you may experience conflicting code between plugins, code syntax errors in your theme, broken code snippets in your functions.php file, or other PHP-related issues.
To tackle these problems, enabling debug mode in WordPress can help you or your developer troubleshoot your site. This built-in debug mode can help you track down what’s going on by displaying all PHP errors, notices, and warnings. There are also additional debugging options that can be helpful when investigating specific types of issues.
Normally, enabling debug mode requires you to edit your wp-config.php file via SSH or SFTP. This can be inconvenient, especially if you don’t have your WordPress login credentials handy or an SFTP client installed. Here at Kinsta, we are constantly developing useful tools in MyKinsta to speed up your WordPress workflow. With our WordPress debugging tool, you can easily enable and disable debug mode without touching a single line of code.
Once you identify the source of an issue, you can report the details to the plugin or theme developer or your website’s developer. If an immediate fix isn’t available, you may need to deactivate the plugin or theme until it can be resolved.
Enable WP_DEBUG
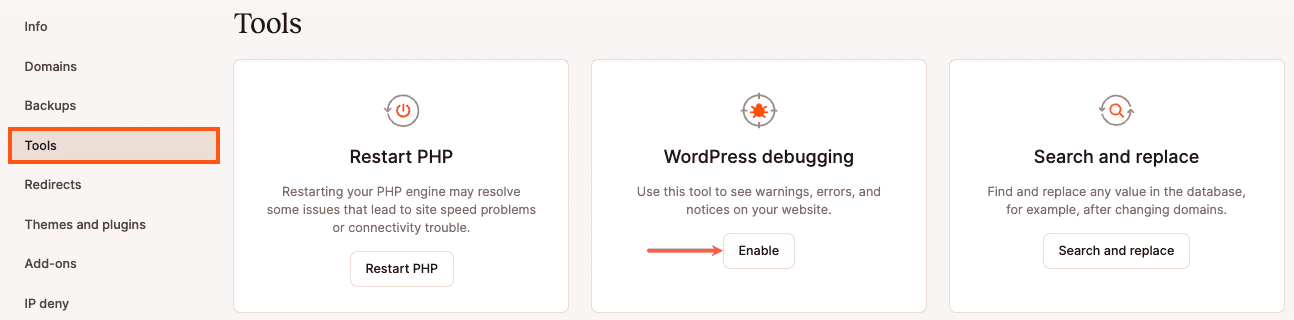
To enable WP_DEBUG, log in to MyKinsta, and select the site and environment you want to enable it on.
Go to the Tools tab and click the Enable button under WordPress debugging.
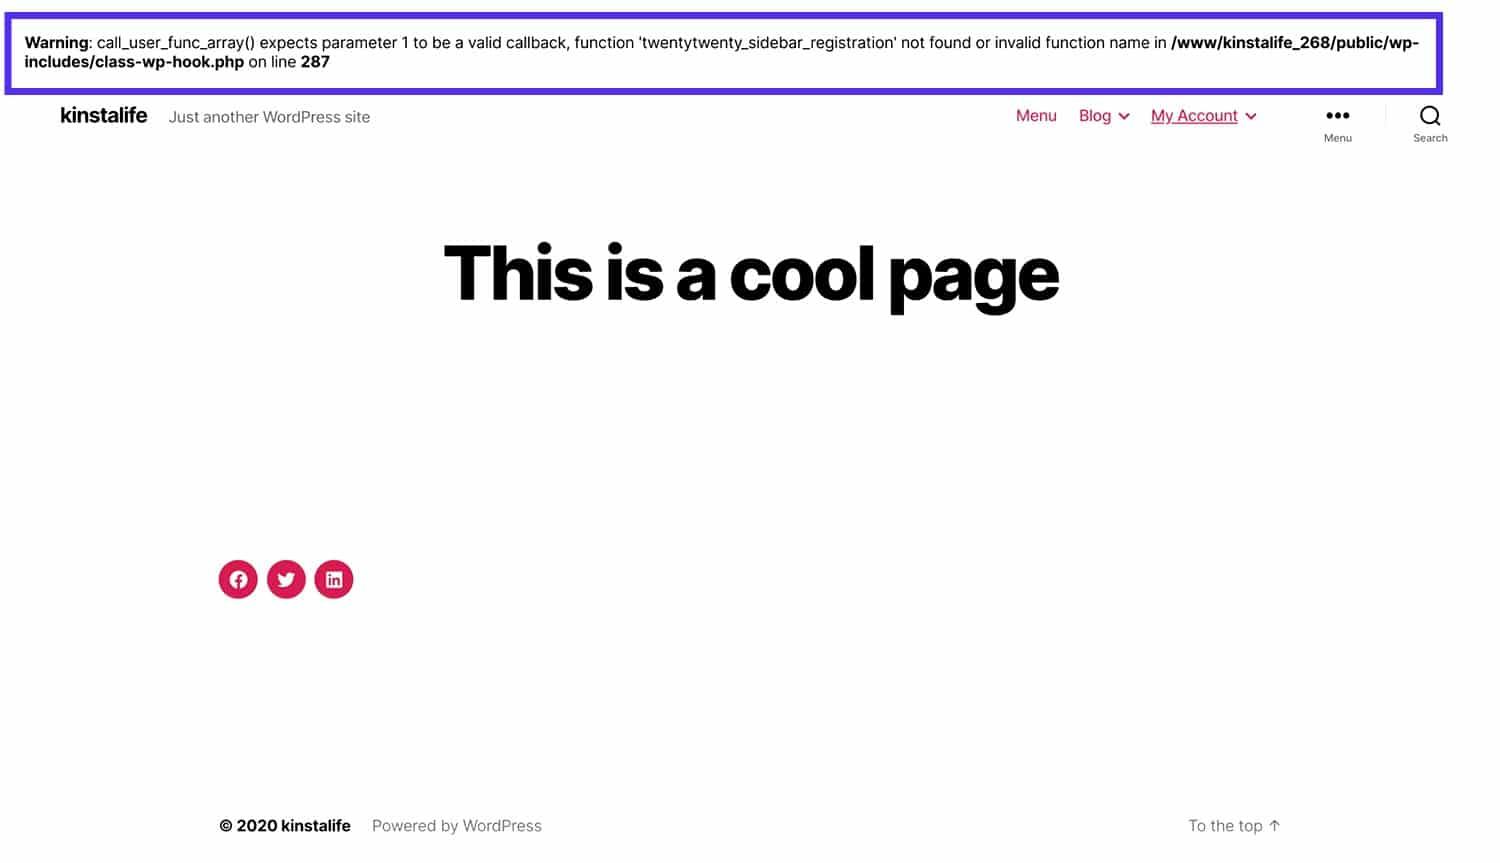
This will make WordPress show any and all PHP errors, notices, and warnings on your site at the top of the page. These will be shown to any visitor and may be shown on both the front of your site and in the WordPress dashboard. The screenshot below shows a typical PHP warning with debug mode enabled.
If you view your site’s wp-config.php file now, you’ll see the following line has been added just before the /* That's all, stop editing! Happy blogging. */ line:
if (! defined('WP_DEBUG') ) { define( 'WP_DEBUG', true ); } // line added by the MyKinstaSetting WP_DEBUG to true enables debugging in WordPress.
Extending WP_DEBUG
There are a few constants that serve as companions to WP_DEBUG by enabling additional debugging options.
Debug log
If you’d like to save errors to a log file, you can enable WP_DEBUG_LOG by editing your wp-config.php file and adding the following line after the line that enables WP_DEBUG:
define( 'WP_DEBUG_LOG', true );By default, this log file will be saved to: wp-content/debug.log on the server. If you like, you can customize the path and file name. In this example, we’re saving the log file to the tmp directory and naming the file wp-errors.log:
define( 'WP_DEBUG_LOG', '/tmp/wp-errors.log' );Script debug
Enabling SCRIPT_DEBUG forces WordPress to use the dev versions of core CSS and JavaScript files instead of the minified versions that it usually loads:
define( 'SCRIPT_DEBUG', true );This can be helpful when troubleshooting JavaScript or CSS issues and you suspect a conflict or other problem with core JavaScript or CSS files.
Database query debugging
To save database queries to an array, enable SAVEQUERIES:
define( 'SAVEQUERIES', true );This will save each query with how long each query took to execute and what function called the query. The array can be accessed or displayed with the global $wpdb->queries.
Disable WP_DEBUG
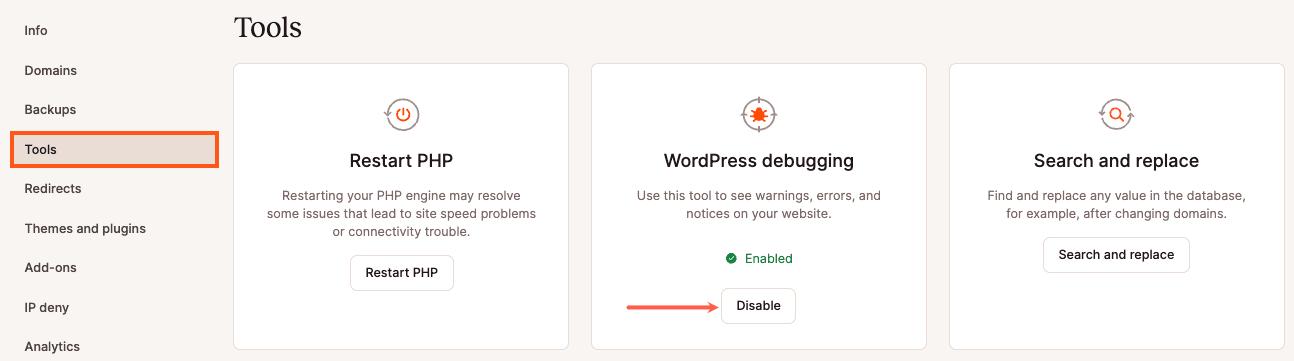
Once you’ve finished troubleshooting your WordPress site, you can disable debug mode by clicking Disable in the WordPress debugging tool.
Other debugging tools and resources
Query monitor plugin
The Query Monitor plugin is a free plugin that’s helpful for debugging a number of different areas in WordPress. It can help you track down slow database queries, AJAX calls, REST API requests, and much more. For more details, we have a blog post on how to use the Query Monitor plugin.
Kinsta’s APM tool
Kinsta’s APM tool helps you identify PHP performance bottlenecks on your WordPress site without having to sign up for third-party monitoring services like New Relic.
New Relic
New Relic is a monitoring tool that gives you detailed performance breakdowns on a granular level.
Server logs
Log files are available in MyKinsta and can also be downloaded via SFTP. These files can be helpful when troubleshooting errors or tracking down other issues on your site.