Analytics
You can view information about your static site resource usage in your MyKinstaDashboard. Static Site Hosting is free for the first 100 GB of bandwidth per month and 600 build minutes per month; after that, pricing is usage-based, and you only pay for resources if your sites exceed the free limits. For more information, refer to Static Site Pricing.

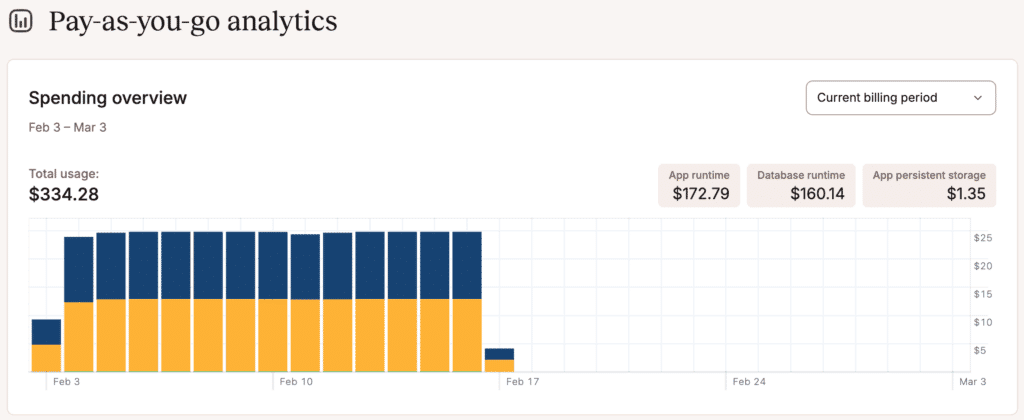
If your static sites exceed the free limits, the billing amounts are also included in the Spending overview chart within the Pay-as-you-go analytics on the MyKinsta Dashboard. This chart shows the spending overview for all pay-as-you-go services, including applications, databases, and static sites.
Static site analytics within each site shows you information about HTTP requests to your site, including requests per minute, response time, slowest requests, and the top pages.
When viewing the analytics, you can choose to see data for the past 1 hour, 6 hours, 12 hours, 1 day, 2 days, 4 days, or 7 days.
To access these reports, go to your static site’s Analytics page (Static sites > sitename > Analytics).

Requests per minute
The Requests per minute chart shows the average number of HTTP requests per minute (RPM) of all HTTP requests for the time period selected.

Response time
The Response time chart shows the average response time for all HTTP requests for the time period selected.

Slowest requests
The Slowest requests table shows the 10 slowest requests to your site for the selected time period and the average response time it took to complete.

Top pages
The Top pages table shows the top 10 most requested pages by the number of views for your site.

Additional notes
Analytics data is retained for 7 days. We suggest checking your Static Site Analytics frequently after first deploying to Kinsta and periodically after that. If you see any unexplained analytics data or inconsistency that concerns you, you can connect with developers and knowledgeable community members in the Kinsta Community forum to help you further investigate.