Kinsta’s APM Tool
Kinsta’s APM tool helps you identify PHP performance bottlenecks on your WordPress site without having to sign up for third-party monitoring services like New Relic.
Available at no additional charge on all plans, the APM tool can be really useful when troubleshooting your website. The APM tool is designed to capture timestamped information about your WordPress site’s PHP processes, MySQL database queries, external HTTP calls, and more.
With the APM data, you can dig into specific slow page loads to identify the root cause of the issue. For more details on resolving performance issues on specific types of sites using the APM tool, see these guides:
- How to Fix WooCommerce Performance Issues Using Kinsta’s APM
- How to Fix Your Membership Website’s Speed With Kinsta’s APM Tool
Keep in mind that Kinsta’s APM tool is specifically designed to help you monitor WordPress sites, so using it to monitor a site running on another CMS or framework may result in inaccurate results. Thus, we only recommend using it for WordPress sites.
APM tool terminology
Before we dive into how to use the APM tool, let’s define a few important terms that will be used later on.
APM
APM, short for “Application Performance Monitoring,” is a tool that gives you insight into the performance statistics and trends of an application. Kinsta’s APM tool provides you with actionable data about the performance of your WordPress site.
Request
In the context of the APM tool, a request refers to a visit to your WordPress site that requires PHP execution to render. A request URL can include various query string parameters and will trigger a corresponding transaction.
For example, a request to yourdomain.com/wp-cron.php?arg=1&arg2=2 would trigger a /wp-cron.php transaction.
Transaction
A transaction refers to the backend activity that occurs to serve a request to your WordPress site. For example, the transaction for a request to /wp-login.php contains the individual PHP processes that generate your WordPress site’s login page.
Span
A span refers to an individual process in a transaction. A single transaction may consist of hundreds of spans arranged hierarchically.
For example, a transaction that generates an account page for a WooCommerce customer may consist of a span that breaks down into multiple database query spans.
Transaction sample
A transaction sample refers to a selected instance out of many requests to a specific transaction endpoint (e.g. /single.php, /wp-cron.php, etc.). In the APM tool, you’ll have three samples to choose from.
For example, the APM tool may record dozens of /wp-cron.php transactions. In this case, the APM tool will pick out the slowest transaction and call it a transaction sample.
Transaction trace
A transaction trace is a complete timeline of all processes that occurred in a transaction sample. In our APM tool, a transaction trace is represented by a list of spans with its corresponding duration and timestamp information.
Stack trace
A stack trace is a detailed process breakdown for an individual span. Stack traces are useful for in-depth debugging. They contain very detailed information about the PHP code that was executed, down to a specific PHP file and line of code.
Enable Kinsta’s APM tool
By default, the APM tool is disabled. Since the APM tool requires additional server resources, we recommend only enabling it when you’re actively troubleshooting a performance issue on your WordPress site.
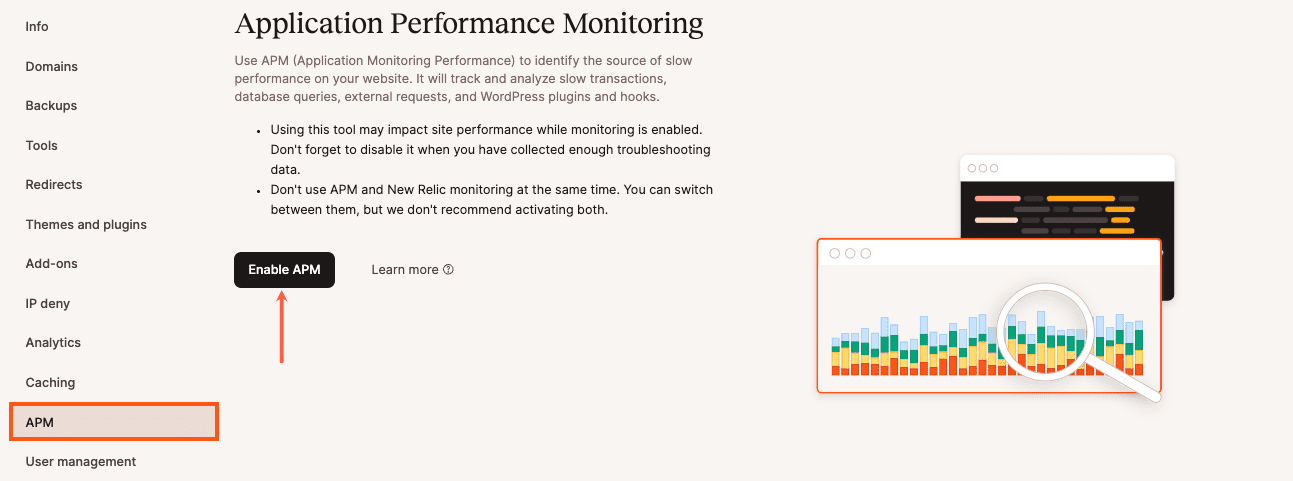
To enable the APM tool, log in to MyKinsta, choose the site you want to monitor, navigate to your site’s APM tab, and click the Enable APM button.
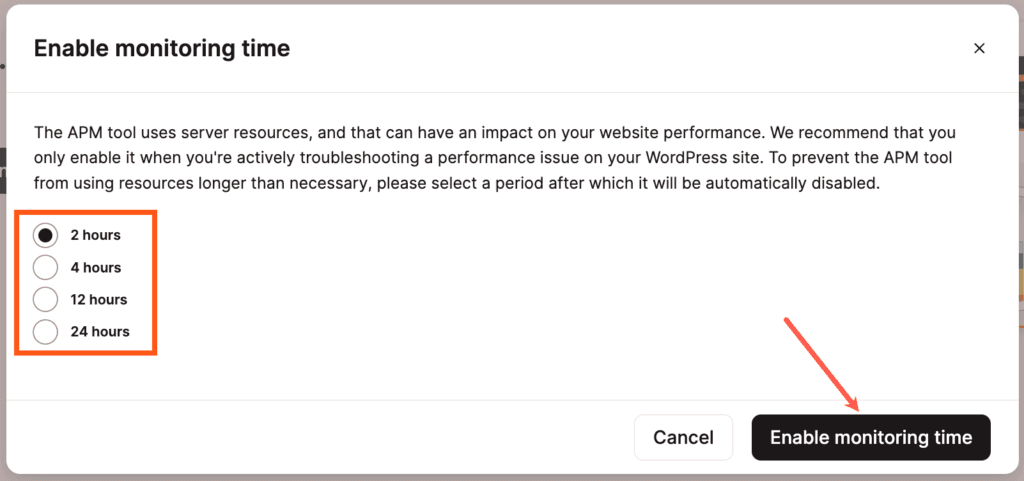
Next, select a monitoring duration for the APM. You can choose between 2 hours, 4 hours, 12 hours, and 24 hours. Since the APM may reduce the performance of your site, we don’t recommend leaving it enabled for an extended period of time. Once you’ve selected a monitoring duration, click Enable monitoring time to start the APM.
Give the tool 5-10 minutes to begin collecting data, and then you can view that data on the APM tab.
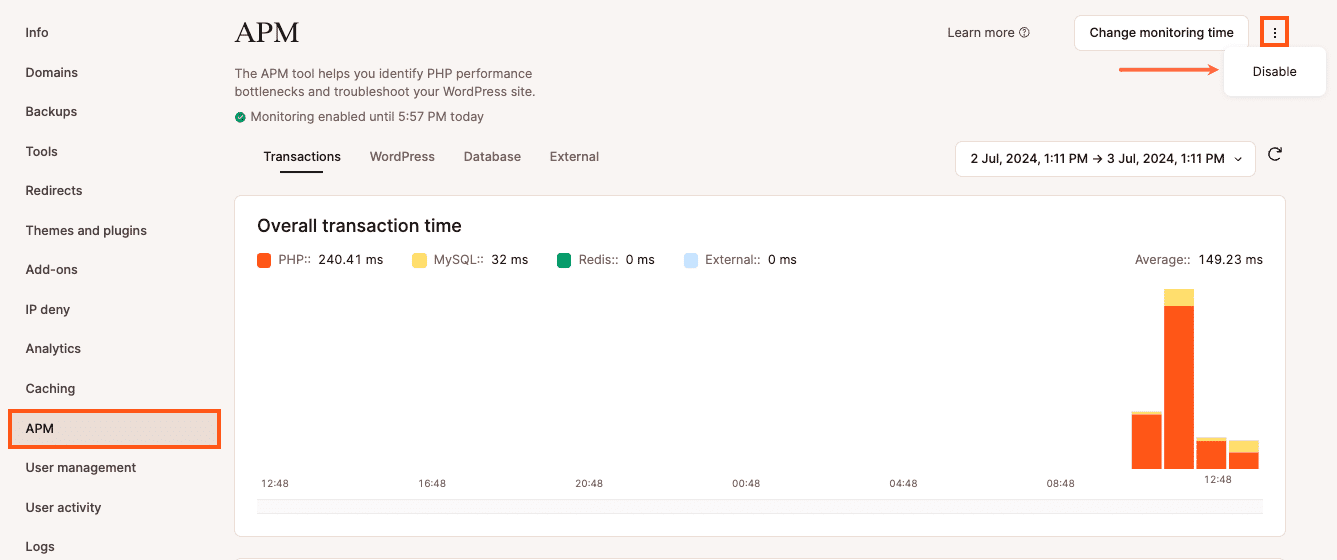
After the monitoring duration has passed, APM will be disabled automatically. If you want to turn off monitoring early, click the kebab (three-dot) menu and select Disable from the dropdown menu.
Select a monitoring data time frame
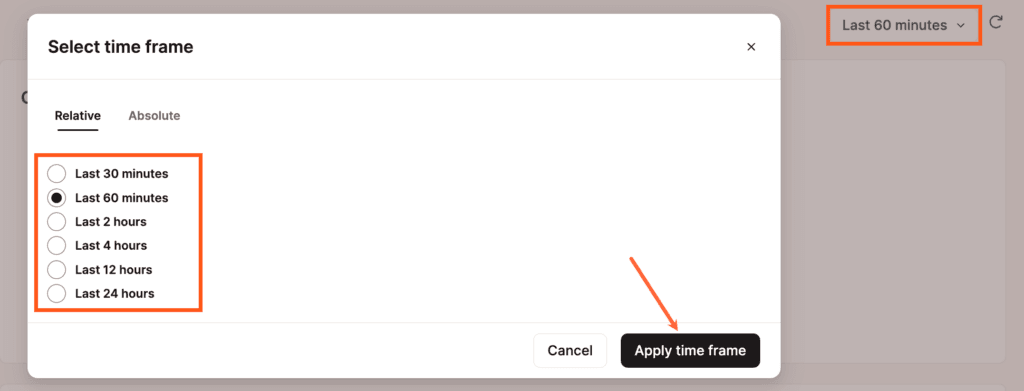
By default, the APM tool shows monitoring data from the past 60 minutes. However, the data time frame is customizable, and you can choose between the options below.
- 30 minutes
- 60 minutes
- 2 hours
- 4 hours
- 12 hours
- 24 hours
To change this setting, click on the time frame button near the top right of the APM page and select an option in the modal/pop-up that appears. Click the Apply time frame button to set the new time frame.
Refresh the monitoring data
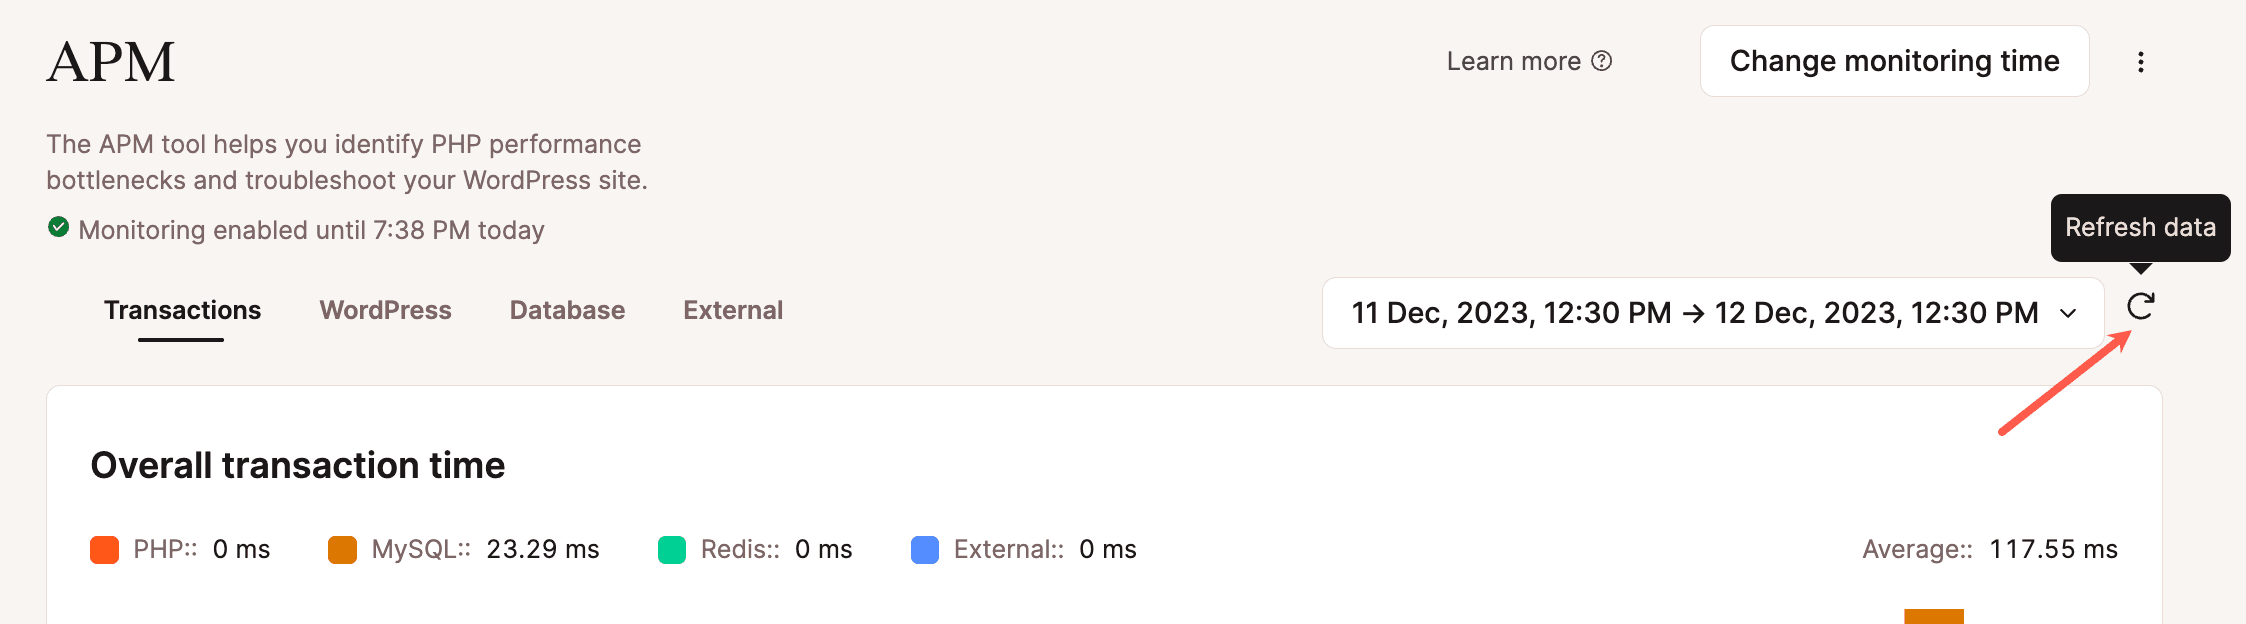
Kinsta’s APM tool displays performance monitoring data based on the set time frame (e.g. past 30 minutes, past 60 minutes, etc.). To prevent confusion, the APM tool does not automatically refresh data. To refresh the APM tool and display the latest data from the selected time frame, click on the refresh (redo) icon next to the time frame button.
Read APM tool insights
Since the data logging does not start until after the APM tool has been enabled, you’ll need to give it some time to gather performance data for your site. We recommend waiting 5-10 minutes before inspecting the monitoring data.
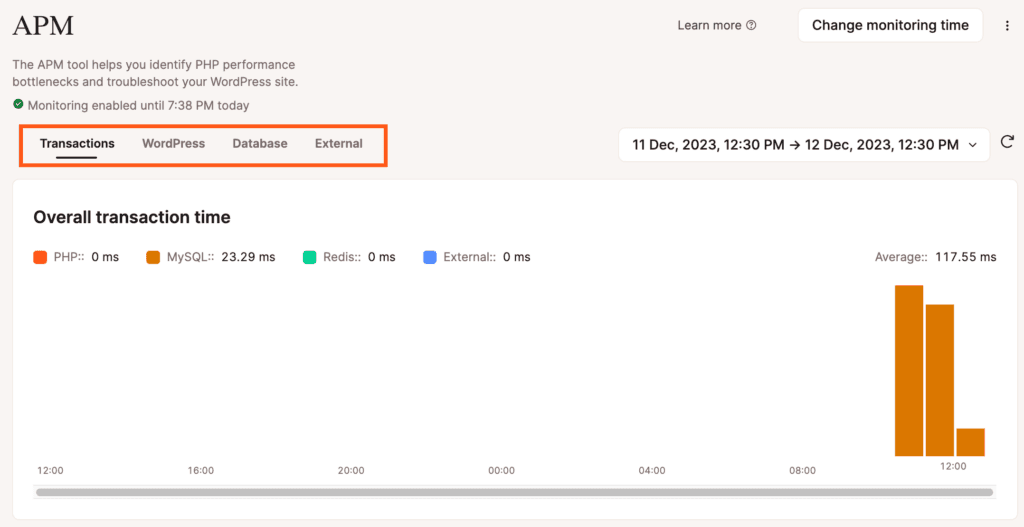
After that, key insights can be found in the Transactions, WordPress, Database, and External tabs, which we’ll review in more detail below.
There are some common columns you’ll see on each tab:
- Total Duration (%): The percentage of time, relative to Total Duration, consumed by all requests to a transaction endpoint within the selected time frame. The duration percentage is calculated with the Total Duration values (the sum of the duration of all requests to a particular endpoint), so it does not represent the duration of an individual transaction sample.
- Total Duration: The total amount of time a transaction endpoint consumes within the selected time frame. Note that the duration refers to the sum of the duration of all requests to a particular endpoint and does not represent the duration of an individual transaction sample.
- Max Duration: The slowest transaction sample duration from the selected time frame.
- Avg. Duration: The average of all transaction sample durations from the selected time frame.
- Rate Per Min: The number of times a transaction has run on average per minute in the selected time frame.
As you navigate through the data, you’ll also see these common data details:
Transaction samples
When you click on a transaction, you’ll be presented with a modal containing up to three transaction samples from the selected time frame.
- Slowest sample: The slowest transaction sample.
- 95th percentile: A transaction in the 95th percentile (95% of transactions are faster than this transaction sample).
- 50th percentile: A transaction in the 50th percentile (50% of transactions are faster than this transaction sample), also referred to as the median. You can think of this as the typical duration as there are exactly the same amount of slower and faster samples than this.
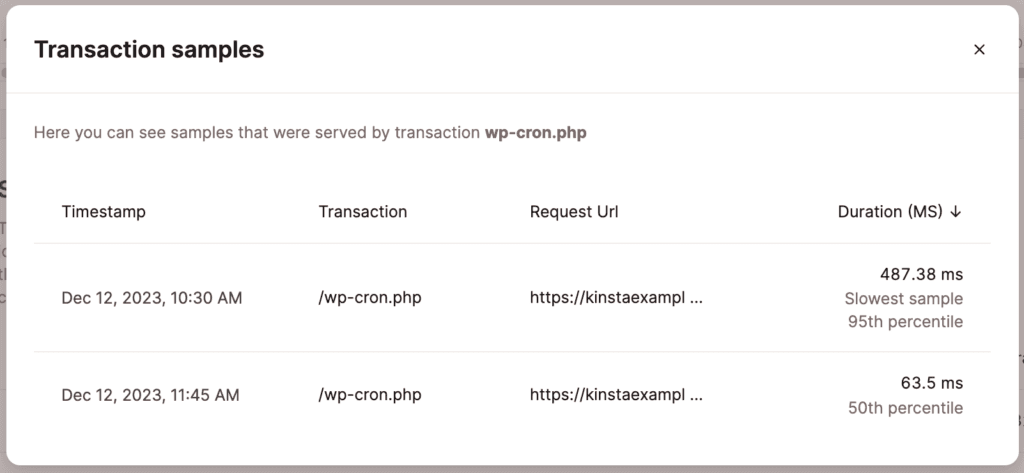
You may see one, two, or three samples. For example, the same transaction may be the Slowest sample and the 95th percentile transaction.
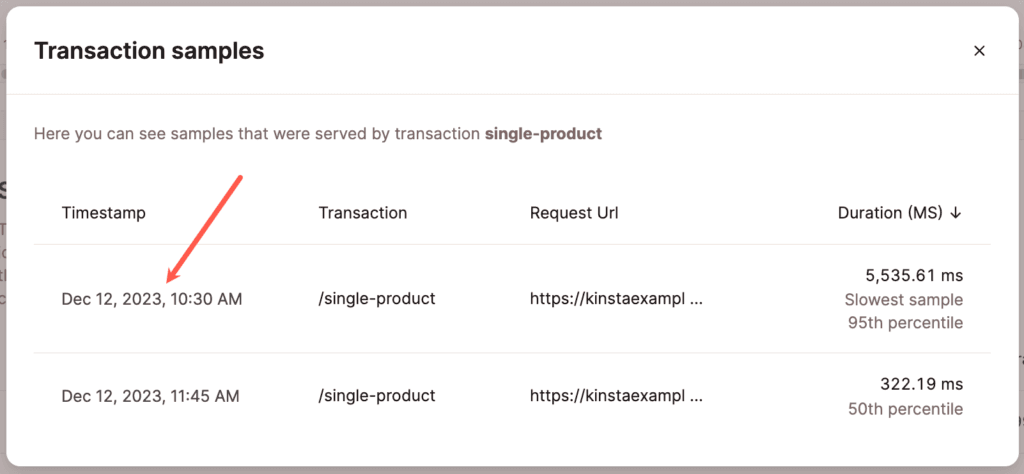
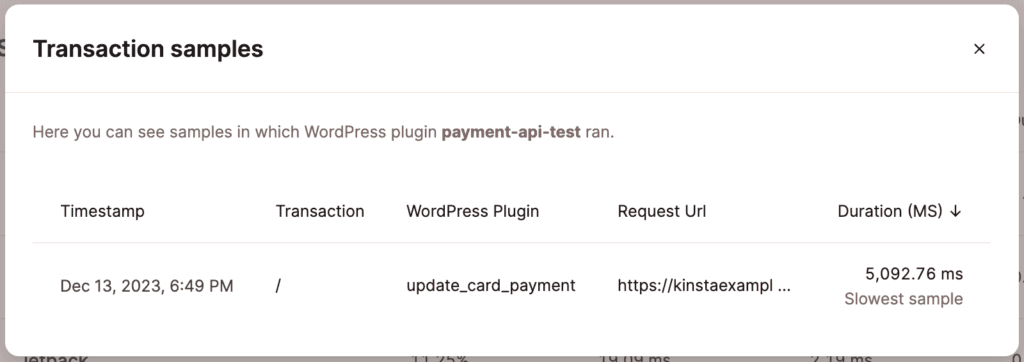
The Transaction samples modal/pop-up also shows useful information about each transaction sample, including the timestamp, transaction endpoint, request URL, and duration.
Individual transaction sample
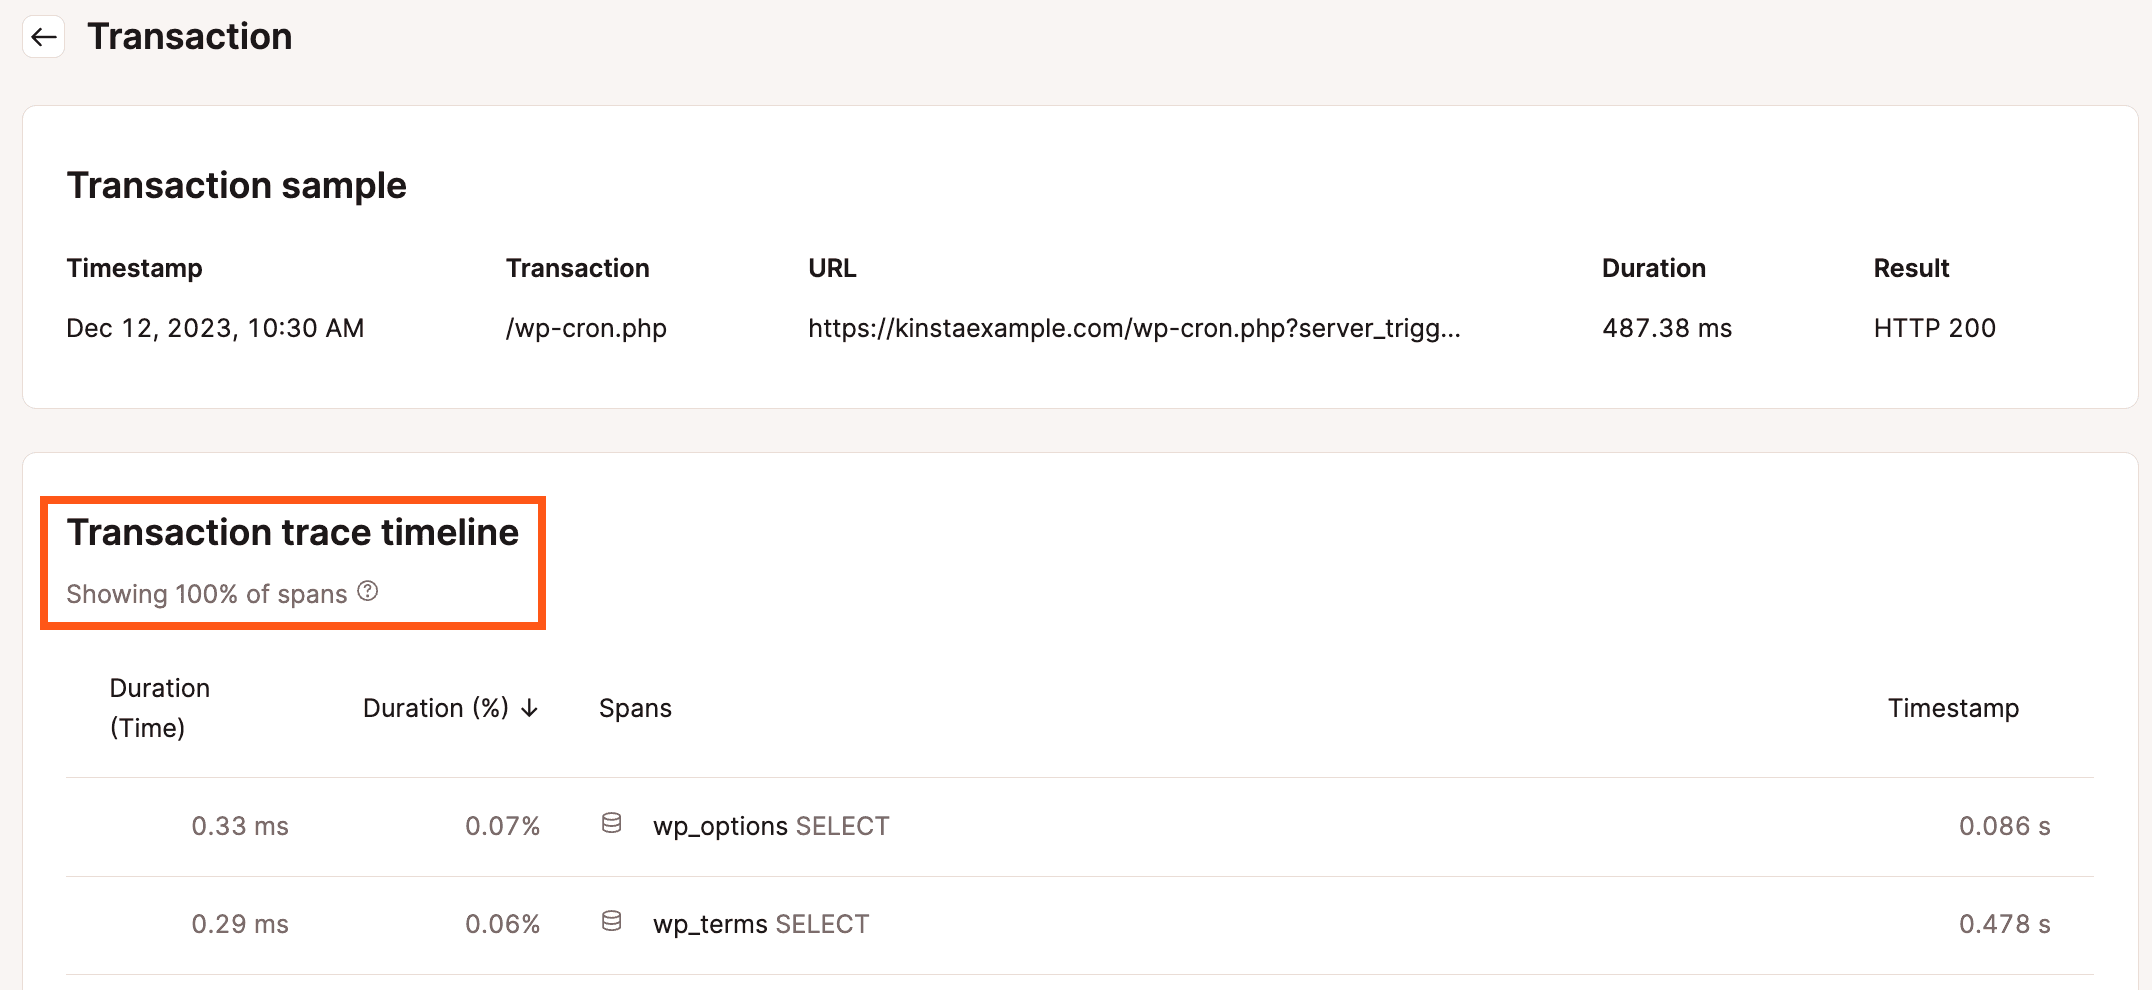
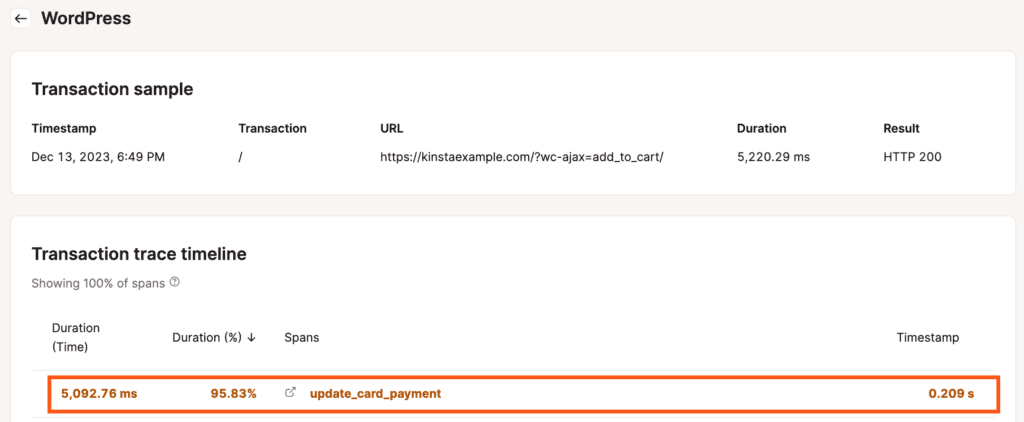
If you click on a transaction sample in the modal, you’ll be brought to a dedicated page for the selected sample. This Transaction sample page includes the sample’s timestamp, transaction endpoint, URL, duration, HTTP status code, and a full transaction trace timeline.
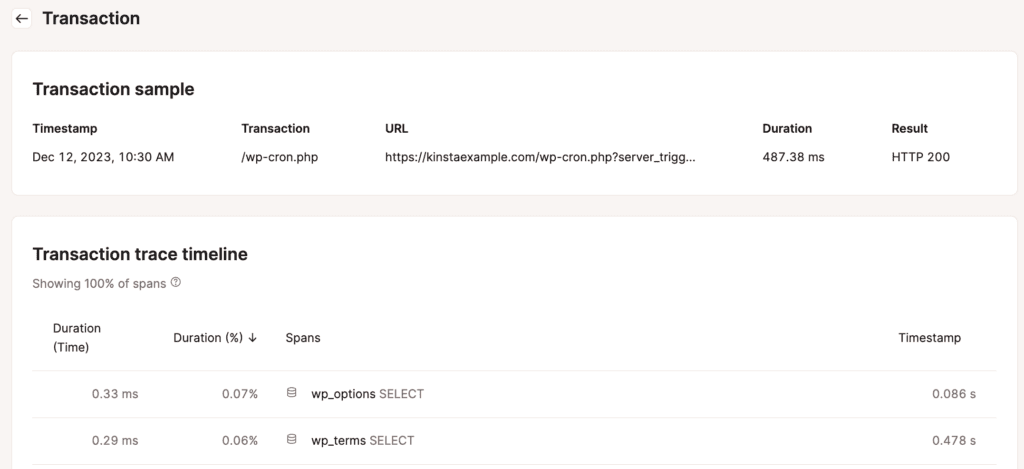
- Timestamp: The date and time of the transaction sample.
- Transaction: The PHP endpoint of the transaction sample (e.g. /wp-cron.php, /single.php, etc.).
- URL: The specific URL of the transaction sample.
- Duration: The duration of the transaction sample in milliseconds.
- Result: The HTTP status code of the transaction. If you see an “HTTP 200” result, it means the transaction was slow but ultimately successful. However, if you see an “HTTP 503” result, it could mean the transaction timed out.
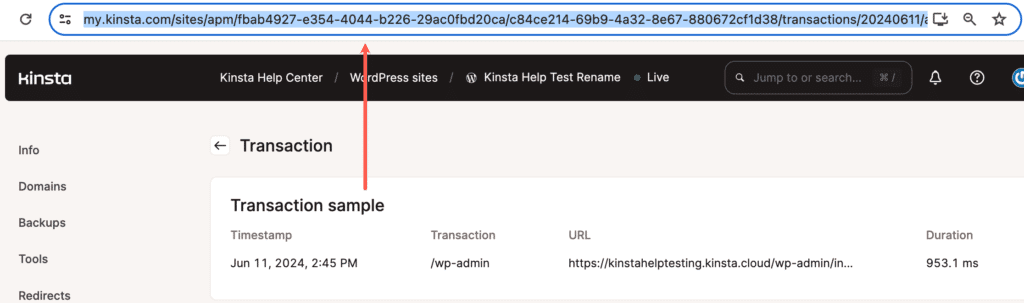
Each transaction sample has its own permalink or unique URL. This makes it easy to reference and share a specific transaction sample with your colleagues, a developer, or the Kinsta Support team. Note: Your colleague or developer will need to have access to the site in MyKinsta in order to view the transaction sample.
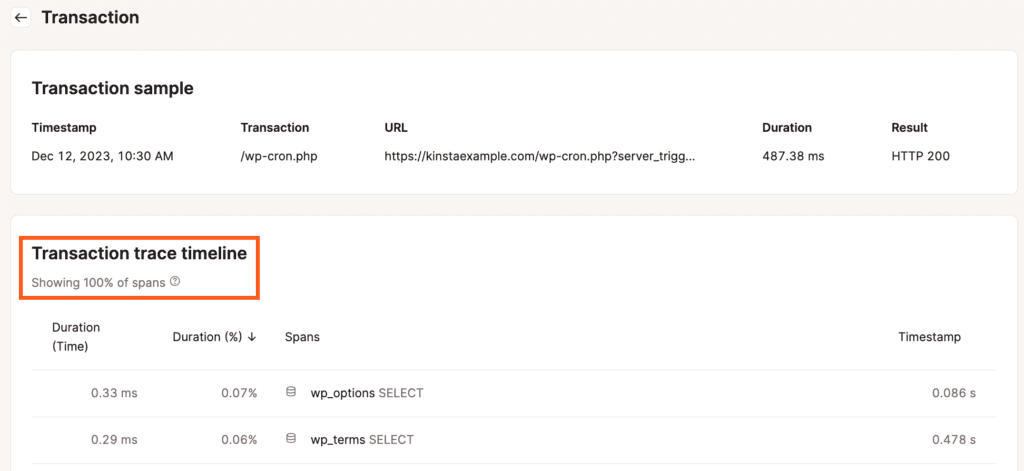
Transaction trace timeline
In addition to basic transaction info, the APM tool also gives you a more detailed transaction trace timeline. Within the transaction trace timeline, you can see a step-through presentation of spans – PHP processes, MySQL database queries, and external calls for a particular transaction sample.
You can sort the spans by Duration (time) or Duration (%) in ascending or descending order by clicking on the column name. This is useful for identifying the longest-running transactions quickly.
Each span also has its associated duration and relative timestamp, so you can quickly identify the longest and most problematic part of the request.
Relative to the total duration of the transaction sample:
- Spans with more than 5% duration are shown in orange
- Spans with more than 25% duration are shown in red
These highlights always refer to the relative duration of the span in its own sample’s context. So if you’re seeing anything red, take into account that it’s always compared to that given sample (and your site or web app might not be slow as a whole).
Note that for MySQL and Redis queries, we do not include spans shorter than 0.001 ms. For non-database-related spans, the threshold is 1 ms. We purposely exclude short spans because recording a high number of fast elements can impact the performance of your site and does not provide very useful data.
This detailed trace timeline is very useful for troubleshooting performance issues because it helps you pinpoint exactly what the bottleneck is.
For example, you may notice that slowness when /wp-admin/admin-ajax.php is requested is caused by long API requests to social network APIs. Armed with this knowledge, you can then continue testing your site with your social plugin disabled to see if it makes a difference.
Similarly, if you see a slow transaction to /wp-cron.php containing repetitive HTTP requests initiated by a cache preloading plugin, you can act quickly on that information and disable the cache preloading functionality.
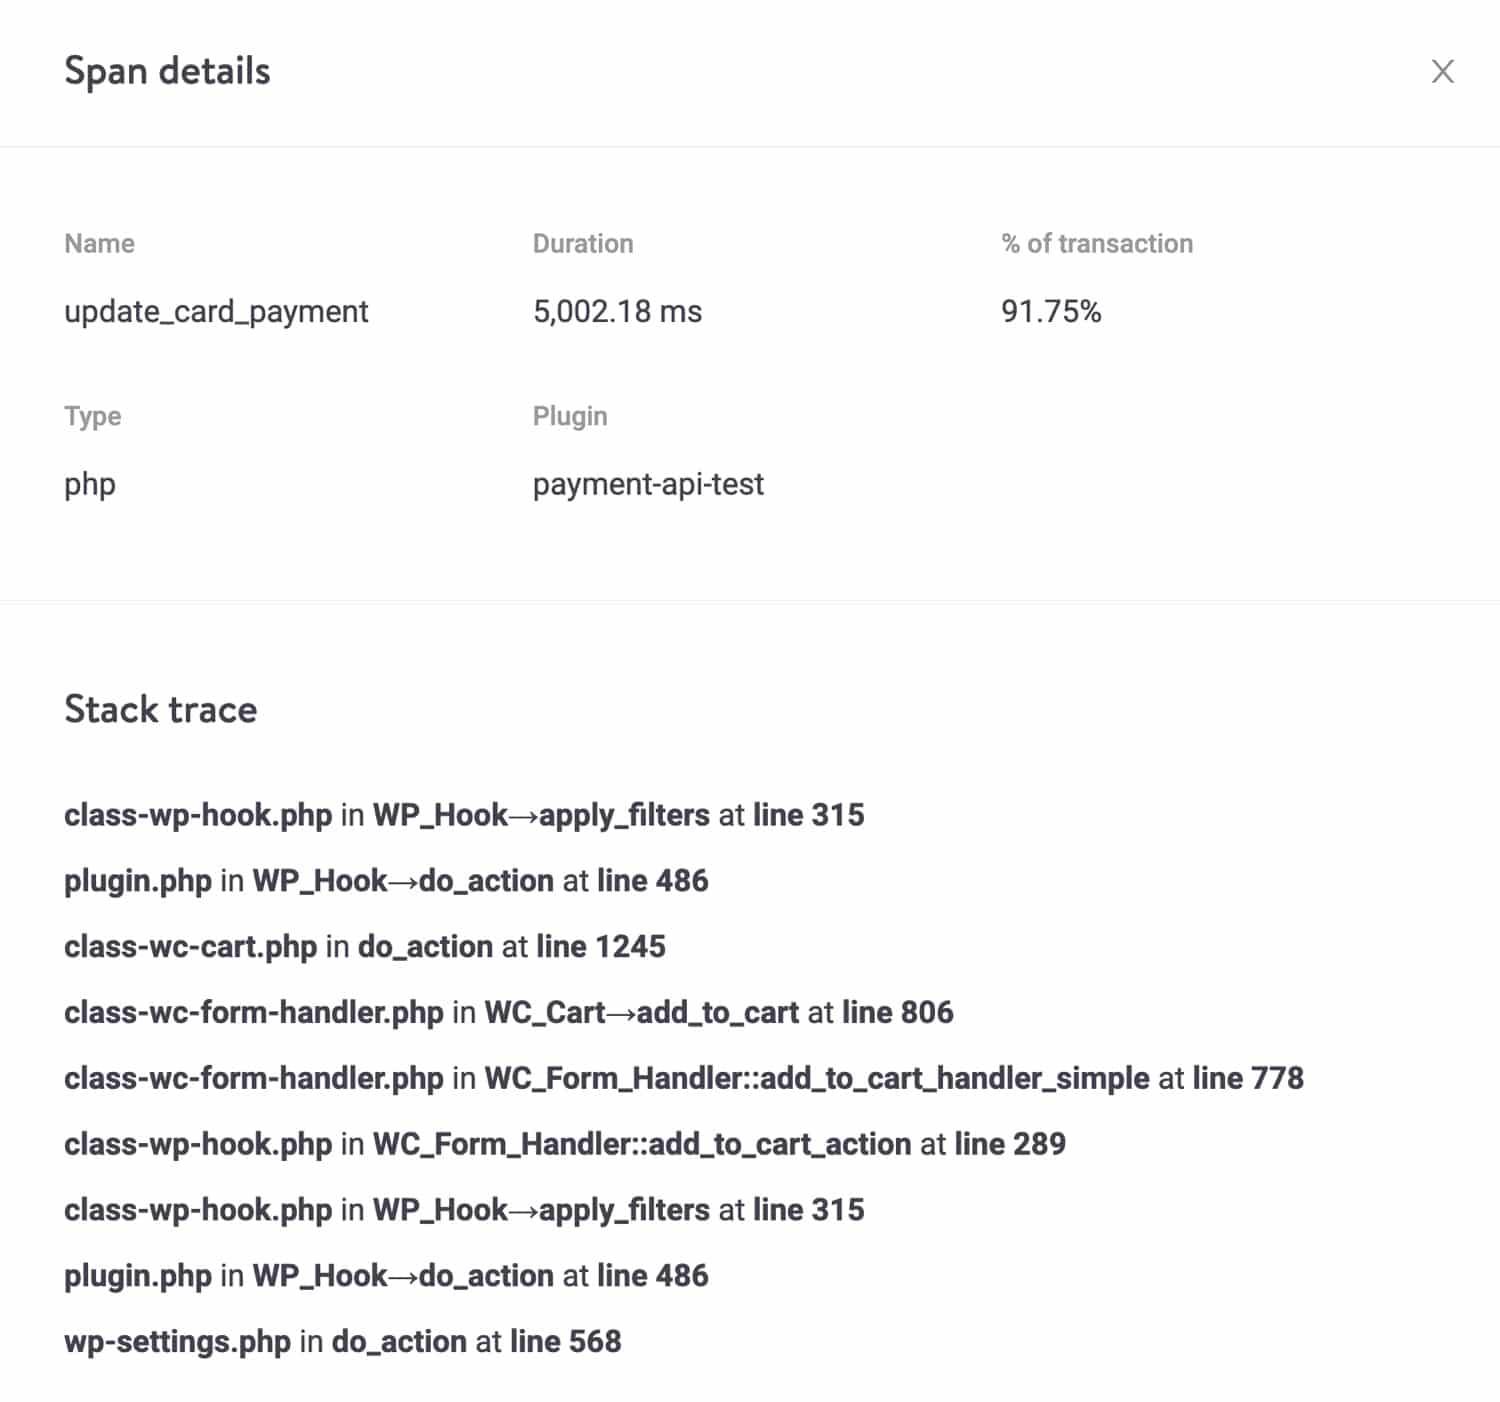
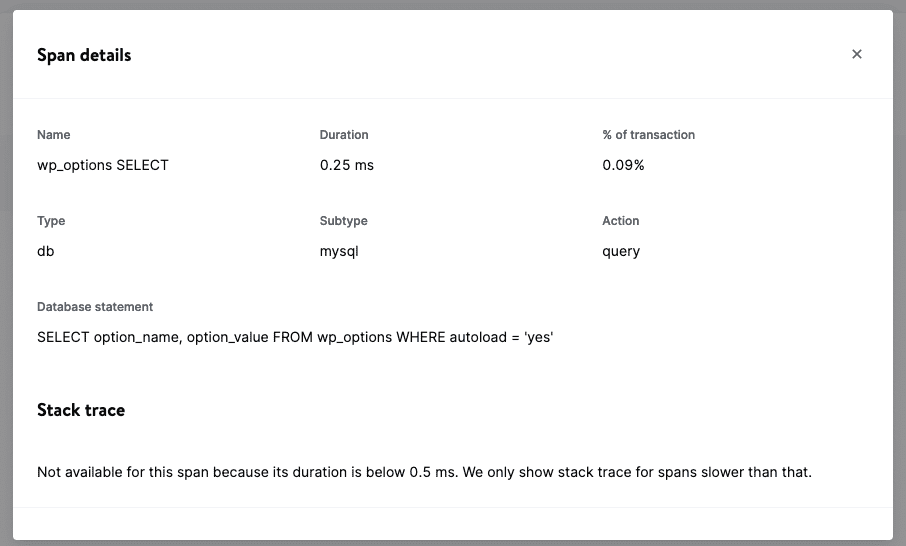
Span details
If you click on a span in the transaction trace timeline, you’ll be able to see a detailed overview with a complete stack trace and associated information.
For example, if you click on a MySQL query span, you’ll see the database query that was executed along with the stack trace. By inspecting the span details, you can gain a deeper level of insight into PHP transactions on your WordPress site.
For more specific examples of how to read and use the APM tool data, check out our guide below on using Kinsta’s APM tool to diagnose performance issues.
Monitoring results
On each of the tabs on the APM page, you can view specific data for Transactions, WordPress, Database, and External requests.
Transactions
This tab is where you’ll find data on overall transaction time and the slowest transactions.
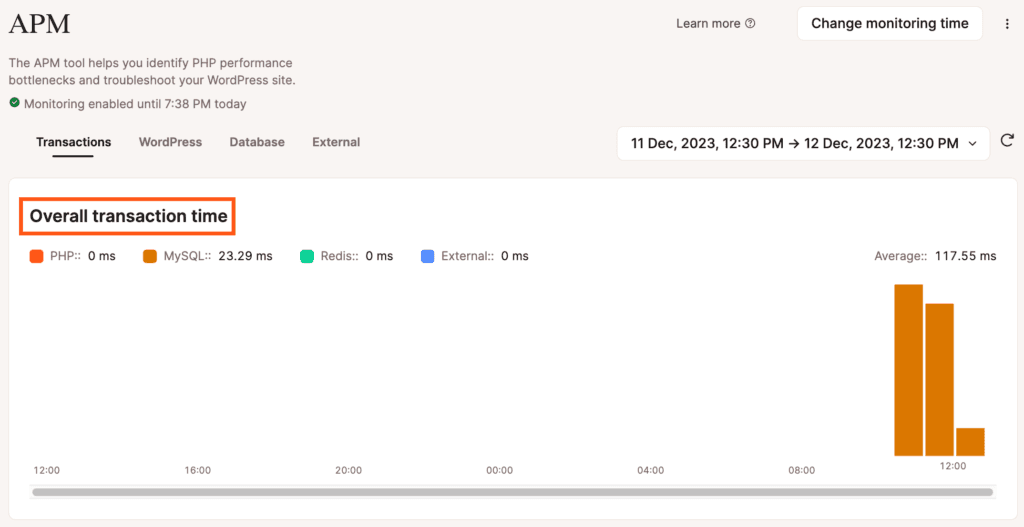
Overall transaction time
The Overall transaction time bar graph gives you a visual representation of transaction time data from the selected time frame. Each bar consists of a multicolor breakdown of PHP, MySQL, Redis, and External transaction times. The Overall Transaction Time graph also shows the selected time frame’s average transaction time in the upper right corner.
Slowest transactions
The top ten slowest PHP transactions will appear in the Slowest transactions section below the Overall transaction time bar graph. In addition to the common columns, the first column of this data is the Transaction column, which displays the transaction endpoint of slow requests that consumed the most PHP time (e.g. /wp-cron.php, /wp-json, etc.).
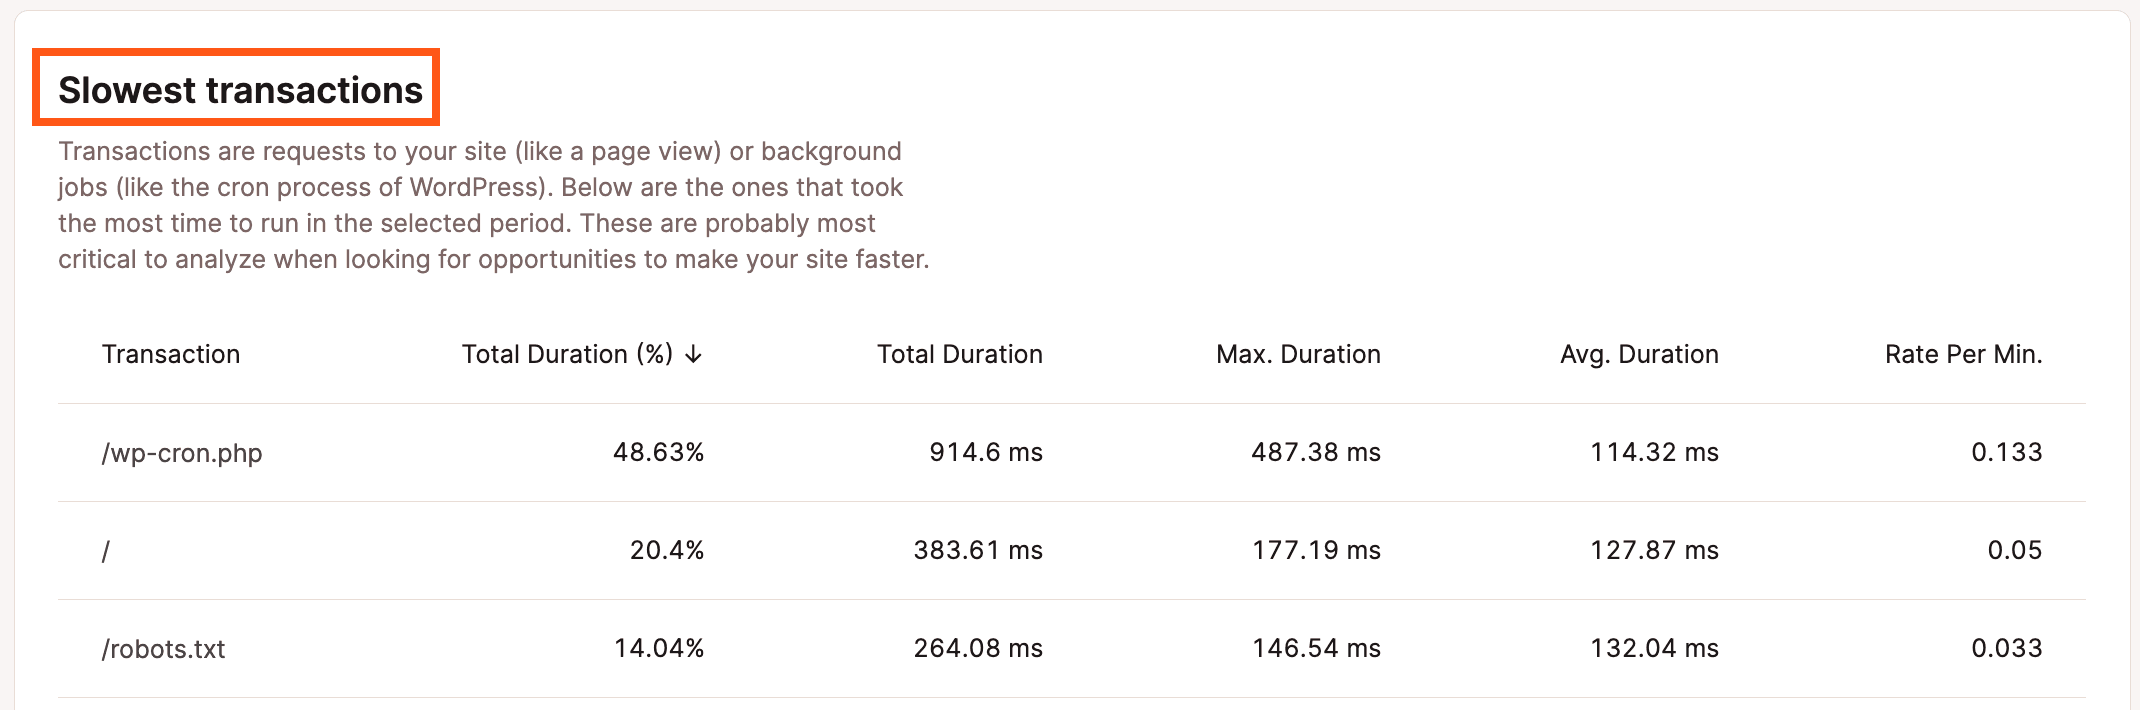
You can click on each transaction endpoint to view the transaction samples and navigate further into each individual transaction sample, trace timeline, span details, and stack trace.
WordPress
On the WordPress tab, you’ll find data specific to WordPress plugins and hooks.
Slowest WordPress plugins
The slowest recorded plugins are listed at the top with the slug (folder/directory name) of the plugin in the first column, then the rest of the common data columns. You can click on each plugin slug to view the transaction samples and navigate further into each individual transaction sample, trace timeline, span details, and stack trace.
Slowest WordPress hooks
Under the Slowest WordPress plugins list, you’ll see the list of slowest WordPress hooks. WordPress hooks are functions in themes or plugins that allow you to modify WordPress at specific spots in the processing of the code.
A hook is either an action or a filter, and the hooks in this list are prepended with their type (action or filter), followed by the function name. Clicking on a hook will show the transaction samples, where you can navigate further into each individual transaction sample, trace timeline, span details, and stack trace.
Database
This tab shows data for the slowest database queries and slowest Redis cache transactions (if Redis is enabled).
Slowest database queries
The top 10 slowest database queries are shown in the Slowest database queries section. Clicking on a query will show the transaction samples, where you can navigate further into each individual transaction sample, trace timeline, span details, and stack trace.
Slowest Redis cache
For sites with the Redis add-on, details related to Redis cache can be found in this section. If your site doesn’t have the Redis add-on installed, no data will be shown. Clicking on a cache item will show the transaction samples, where you can navigate further into each individual transaction sample, trace timeline, span details, and stack trace.
External
Data for any external requests your site makes can be found on the External tab. External requests are HTTP requests made by your site to another site or server. These calls are usually made by plugins or themes for retrieving or sending data or for communication with an API.
Each URL in the first column of the list is followed by the HTTP method used for the request (GET, POST, PUT, etc.). Clicking on a request URL will show the transaction samples, where you can navigate further into each individual transaction sample, trace timeline, span details, and stack trace.
Diagnose performance issues
Kinsta’s APM tool is a powerful tool for troubleshooting your website. This article will take you through a few different scenarios for troubleshooting performance issues on a site using the APM tool to investigate and analyze the issues.
Getting started
Before diving deeper into using the APM tool to troubleshoot an issue, there are a few steps you’ll need to take, regardless of the issue:
- Make sure you can recreate the issue if it isn’t currently happening. Look for patterns of when the issue occurs or if specific actions seem to trigger the problem (e.g. editing a page, adding a product to an ecommerce cart, uploading images, etc.).
- Enable the APM tool in MyKinsta and give it a few minutes to start collecting data. The APM tool can only record and analyze data while it’s enabled.
- Once the APM tool begins collecting data, recreate the issue to record the necessary information.
- If Redis is enabled on your site, make sure you use either the WP Redis or Redis Object Cache plugin (but not both). We may not be able to collect and show Redis data from other plugins in Kinsta’s APM tool.
Analyze slow-loading pages or actions
In this example, pages load quickly, but everything slows to a crawl when adding any product to the cart, whether it’s a simple or a variable product.
After adding a few products to the cart, we take a look at the results in APM (Sites > sitename > APM) and see the /single-product transaction is at the top of the list of Slowest transactions, with a maximum duration of over 5 seconds and an average duration of over 2 seconds.
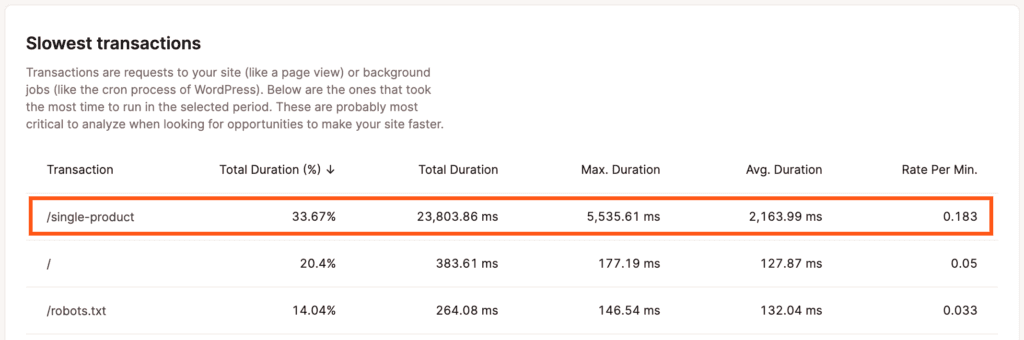
Clicking on that transaction opens the Transaction samples modal/pop-up where we can select the slowest transaction (first in the list) to see more details.
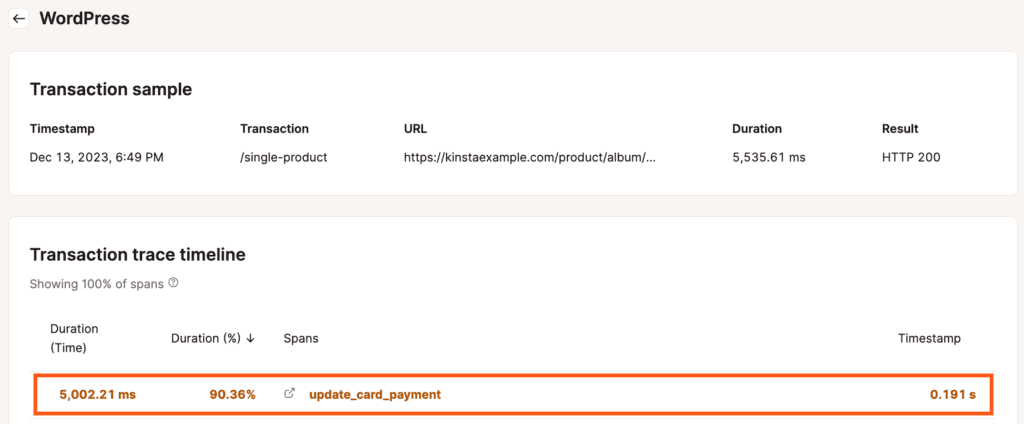
This takes us to the Transaction trace timeline, where we can sort the transactions by Duration (time) to see which processes in this transaction sample are the slowest. Here we can see that the update_card_payment span is the slowest process in the timeline, taking up 5,002.21 ms of a 5,535.61 ms transaction.
Clicking on that span opens the Span details modal/pop-up and includes the stack trace of the span.
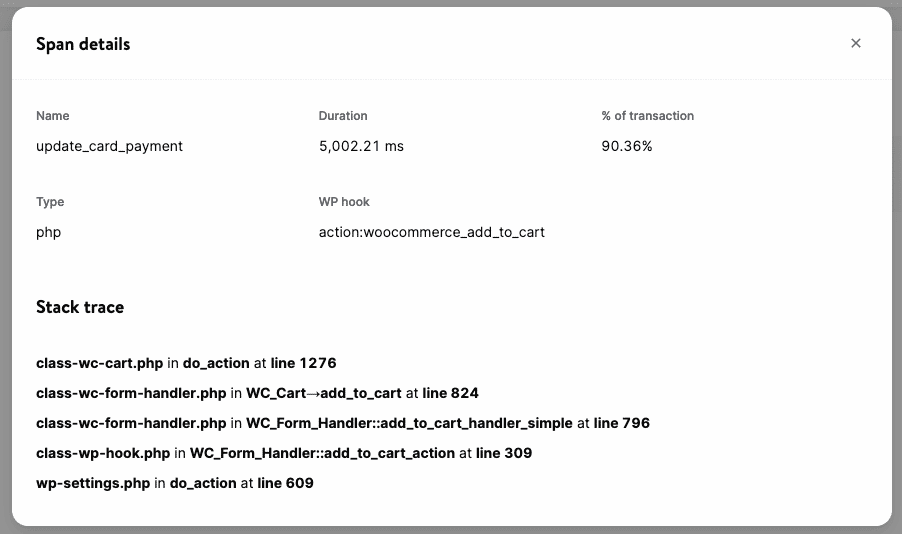
We can see the WordPress hook action:woocommerce_add_to_cart is associated with this span in the span details.
There are a couple of ways to track down what plugin or theme this is associated with.
If you’re comfortable with the command line, you can use the grep command to search for the update_card_payment function and see which plugin or theme files contain that function.
Alternatively, you can look at the WordPress tab under Monitoring Results and look for a plugin with a similar Total Duration and Max Duration. It will most likely be at the top of the list.
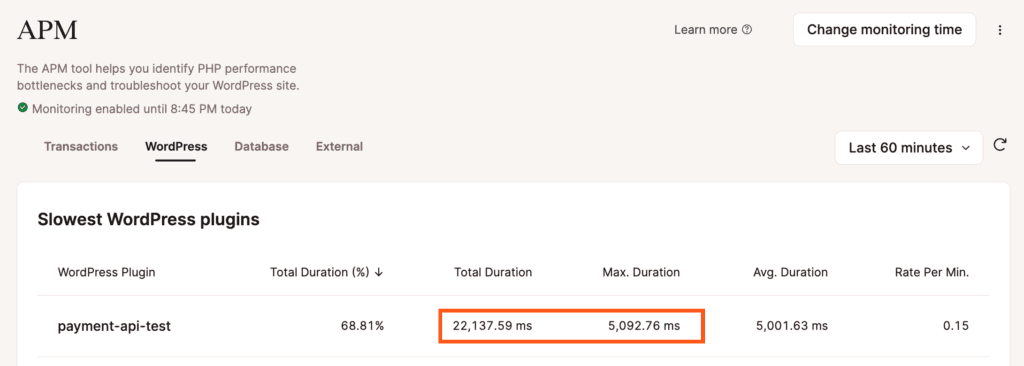
You can confirm the match by selecting the plugin in the Slowest WordPress plugins list. If the plugin isn’t listed in the WordPress plugin column in the Transaction samples modal/pop-up, select the slowest transaction sample to view the Transaction trace timeline.
Sort the timeline by Duration and look for the same function name (e.g. update_card_payment) to be at or near the top of the list when sorted.
Investigate overall slowness
Overall slowness on a site is often due to a plugin and is one of the first places you’ll want to check. If a plugin is causing your site to be slow, this can usually be identified by viewing the WordPress tab (Sites > sitename > APM > WordPress). In the screenshot below, note that the highlighted plugin’s total duration percentage is over 98%, and the max and average duration are pretty high.
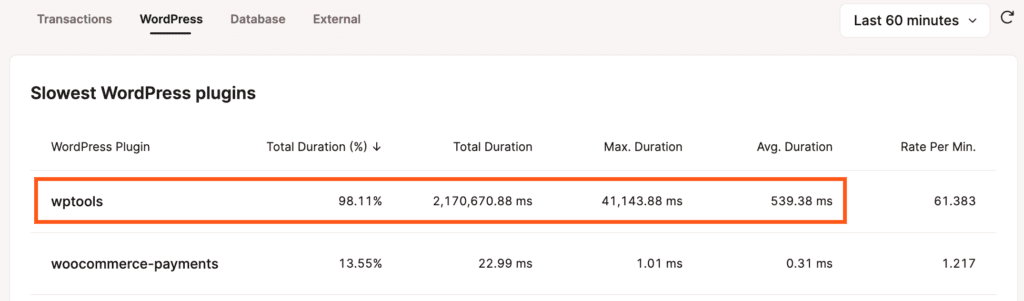
This indicates this plugin is the most likely source of overall slowness on the site. To confirm this, we can deactivate the plugin, observe the site’s performance, and check the results in the APM tool once again after enough data has been collected. If you’re sure the plugin is configured correctly but continues to cause slowness on your site, we recommend contacting the plugin developer to work with them on resolving the issue.
Pinpoint intermittent third-party issues
External requests are HTTP requests made by the site to another (third-party) server. Plugins or themes usually make these requests for loading scripts or stylesheets or communication with an API.
When troubleshooting a possible external issue, it’s important to note that the APM tool records slow external transactions on the server-side. Many external requests can be made from a site on the client-side, which wouldn’t be recorded in the APM tool. For investigating external requests on the client-side, you’ll need to use a tool like GTmetrix or your browser’s dev tools.
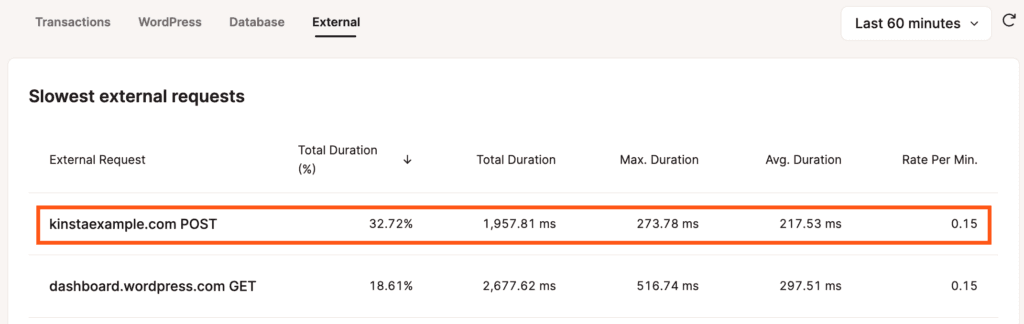
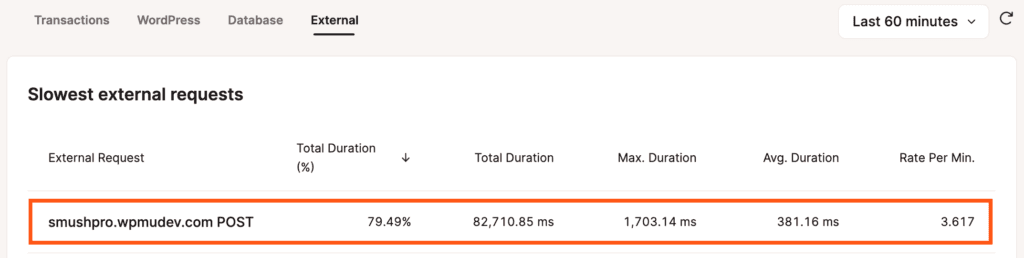
To view slow external requests, go to the External tab under Monitoring Results to view the Slowest external requests. In this example, we’ve noticed some slowness when uploading images in the media library, with some uploads taking 5 minutes or more to complete.
We begin by looking at what the external requests look like when we’re not doing anything more than logging into the WordPress dashboard. Before uploading images to the Media Library, POST requests to wp-cron are the slowest requests, with 273.78 ms max duration and 1,957.81 ms total duration.
When we upload several images ranging in size from 3MB-17MB, it takes several minutes for those to finish uploading. Looking at External requests again, we see that POST requests to smushpro.wpmudev.com are the slowest external requests, with a max duration of 1,703.14 ms and a total duration of 82,710.85 ms.
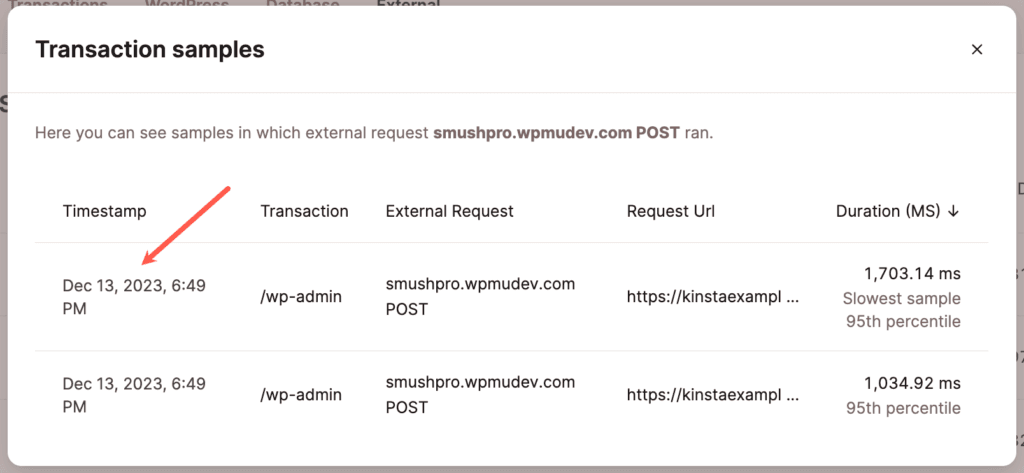
Clicking on that transaction opens the Transaction samples modal/pop-up where we can select the slowest transaction (first in the list) to see more details.
This takes us to the Transaction trace timeline, where we can sort the transactions by Duration (time) to see which spans are the slowest. Here we can see that several POST requests to smushpro.wpmudev.com are the slowest in this sample, with the total of those POST requests taking up 6,712.64 ms of a 7,168.58 ms transaction.
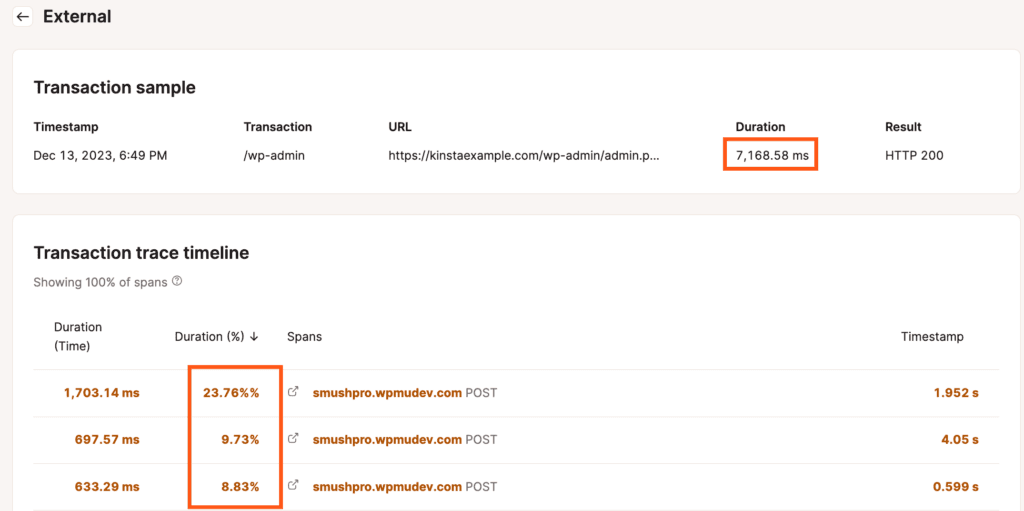
We can also observe that the duration of each request varies significantly, with the shortest request only taking 138.2 ms and the longest taking 1,703.14 ms. So, while the Smush plugin is optimizing our images, each of those images spawns an external request, which adds up and can slow things down on the site.
In this case, optimizing our images before uploading instead of relying on a plugin for image optimization would significantly reduce our external requests. This is one of those cases where we’ll need to decide which is more important, convenience or site performance. We can keep the plugin if we’re okay with the necessary slowness caused by the external requests. If we would prefer or need to improve our site performance, removing the plugin and optimizing our images before uploading will be our best option.
APM FAQ
We’ve compiled a few popular questions regarding APM and provided answers to them below.
How can I enable Kinsta’s APM?
Kinsta’s APM is available at no additional cost with all plans. To enable it, you need to:
- Log in to MyKinsta.
- Select the website you’d like to debug.
- Click the Monitoring tab.
- Click the Enable APM button to start the APM tool.
Will the APM slow down my WordPress site?
As with other APM tools, Kinsta’s APM agent might add additional load to your server’s CPU and RAM resources and could potentially slow down your WordPress site for a limited time.
We strongly recommend only enabling the APM when you’re actively diagnosing a performance issue on your site.
Does Kinsta still support personal New Relic monitoring for customers with personal New Relic licenses?
Yes, Kinsta sites still support New Relic monitoring for customers with personal licenses.
Is it possible to use Kinsta’s APM and New Relic at the same time?
We do not recommend using both Kinsta’s APM and New Relic for monitoring at the same time. However, it’s okay to switch between the APM and New Relic as long as both tools are not active at the same time.
Is the APM compatible with other CMS platforms and frameworks? Is the APM Compatible With Other CMS Platforms and Frameworks?
At this time, the APM is only fully compatible with WordPress.
Will the APM work with Bedrock (or other sites that use Composer)?
Yes, but if WP-CLI is a dependency in your site’s composer.json file, you’ll need to add a configuration so that Kinsta’s autoloader can work together with the WP-CLI autoloader:
"prepend-autoloader": falseHere’s an example config array from a Bedrock site after adding the prepend configuration:
"config": {
"optimize-autoloader": true,
"preferred-install": "dist",
"prepend-autoloader": false
},
What if I see some unexpected behavior on my site after I enable the APM?
We’ve already done extensive testing with different WordPress versions and a long list of plugins. However, there can still be unknown wrinkles to work out, like a plugin version or some custom development being incompatible with our monitoring solution.
For this reason, when you enable the feature, always double-check that your site works fine. If you see any unintended behavior, disable the feature and let us know so that we can investigate and work out the issue.
How long is data from the APM tool available?
APM data is retained for 14 days. To view data older than 24 hours, click the time frame button near the top right of the APM page, go to the Absolute tab in the Select time frame modal/pop-up, select a 24-hour time frame within the past 14 days, and click the Apply time frame button.
Summary
Kinsta’s APM tool gives context to performance issues on your WordPress site. Instead of generic HTTP 502 errors or timeouts, the APM tool provides detailed breakdowns of slow requests.
With Kinsta’s APM tool, you’ll be able to debug performance issues without installing a plugin like Query Monitor or activating a third-party service like New Relic.
If you’re working with a developer to address issues on your WordPress site, Kinsta’s APM tool can also help you save time and money by providing you with a place to start.