Counting Visits
At Kinsta, you can choose a hosting plan based on the total monthly server bandwidth used by your sites or the total number of monthly visits to your sites. The number of visits in a given month is the sum of the unique IP addresses seen each 24-hour period as recorded in the logs. These visits are shared across your WordPress Hosting plan. We use this data to approximate your resource usage.
What is a visit?
Kinsta records the exact number of visits to your WordPress sites that occur directly on our hosting infrastructure. We do not count visits from most well-known “bot” user agents are not counted (see Bots and discrepancies in analytics). If we identify something trying to brute force “wp-login.php,” we ban it from our infrastructure.
The MyKinsta analytics Plan usage report shows billable visits usage, not necessarily all the traffic your site receives.
The Visits report shows the number of visits to your live WordPress environments that count toward your billable usage. This chart does not represent the total traffic your site receives, only the portion included in your plan’s usage calculations. For a full breakdown of all traffic to your site, including bots, see the bot traffic analytics in MyKinsta.
The Visits chart is fully dynamic and includes additional drill-down details. For example, if you highlight a specific point in time on the graph, it shows you some comparison statistics, such as the total number of visitors being higher than the previous day, etc.
Full log data regarding analytics is retained for 30 days. Visits are shared across your plan; if you are worried about going over your plan visits limit, we suggest checking the dashboard and analytics section for all of your sites more frequently after first migrating to Kinsta.
If you see an unexplained traffic spike or inconsistency, contact our Support team, and we can further investigate the logs to help determine the cause.
What generates a visit and what doesn’t
- When someone loads a page of your site, this counts as a visit.
- If that person then goes to another page of your site, this is still considered one visit.
- Visits served from the edge cache, or CDN cache, are still counted as visits.
- Only visits to the live environment are counted in your plan usage. We do not count visits to your staging (standard or premium) environments.
- If someone uses two different browsers on the same computer (or network) to view your site, it’s treated as one visit because the IP address is the same. This is also why every visit in a day from the same location is considered one visit, no matter how many devices were used. As long as the same internet connection with the same IP address is used on the same day, it’s one visit.
- If someone visits your site from their workplace (outside of their home) and then again from their home, these are counted as separate visits because two different IP addresses are used.
- Visits from most well-known “bot” user agents are not counted as visits, and we do our best to filter those out.
- Requests that return 401, 403, 429, 451, 499, and 501 errors are not counted as visits.
- Visits to the wp-login.php page are not counted as visits.
Kinsta visitor counts and other analytics tools
It’s important to understand that third-party analytics tools might show something different from what we have calculated. This is due to the fact that every analytics tool uses a different set of data as the basis for their calculations and may or may not implement their own logic to attempt to show you the total number of real human visitors, after having filtered out bots and crawlers.
All tools also show different numbers based on the data they have collected and their own set of rules—what they consider to be irrelevant bot traffic and what they consider to be legitimate traffic.
Google Analytics
Google Analytics works by adding JavaScript to your site, which runs in each site visitor’s browser to gather data. This can be set up manually or using a Google Analytics WordPress plugin. It calculates the number of users and sessions using the data gathered from visitor browsers. Google Analytics is designed to show you only human visitors by filtering out bots and tracking visitors across devices and through network changes (such as when a visitor’s IP changes).
Most ad blockers and tracker blockers automatically blacklist www.google-analytics.com, preventing the Google Analytics JavaScript library from loading and sending data to Google’s servers. As a result, website owners may see incomplete or inaccurate visitor data in the Google Analytics reports. For blockers that don’t blacklist Google Analytics by default, users are typically prompted with a consent request, often in the form of a popup. If the user denies permission, tracking remains disabled. Additionally, some privacy-focused browsers, such as Brave and Firefox with Enhanced Tracking Protection, block Google Analytics by default. Users who install extensions like uBlock Origin, Ghostery, or Privacy Badger further limit tracking, reducing the effectiveness of Google Analytics in measuring real-world traffic.
As a result, Google Analytics typically cannot track visitors who use ad blockers or tracker blockers, those who deny consent, visits from privacy-focused browsers, or users with extensions that restrict tracking. However, at Kinsta, these visits are still counted because we capture all requests made to the server regardless of client-side tracking limitations.
Google Analytics does not track visits to static assets (such as images, CSS files, JavaScript files, or other media files) by default. It primarily tracks page views and events based on JavaScript execution within a webpage. Since static assets do not run JavaScript, they do not trigger tracking and are not counted as visits. However, at Kinsta, visits to static assets are still included in the total visit count.
Google Analytics may also apply data thresholds to limit the information included in reports if it could potentially reveal the identity or sensitive details of individual users based on their demographics. This ensures compliance with privacy regulations and prevents the exposure of personally identifiable information.
Google Analytics does not generate any value that is directly comparable to our visit count. Therefore, we do not recommend using Google Analytics data as the basis for your estimate of monthly visits.
Cloudflare Analytics
Cloudflare Analytics provides details about how many visitors hit your site. To access it, log in to your Cloudflare dashboard and select Websites > site name> Analytics & Logs > Unique Visitors.
Cloudflare shows unique visitors for the entire time frame you choose. This means if you choose a weekly view, the data points will show daily unique visitors, but the weekly visitor count at the top of the chart will count unique visitors throughout the whole week, regardless of how many times they visited the domain on a daily basis.
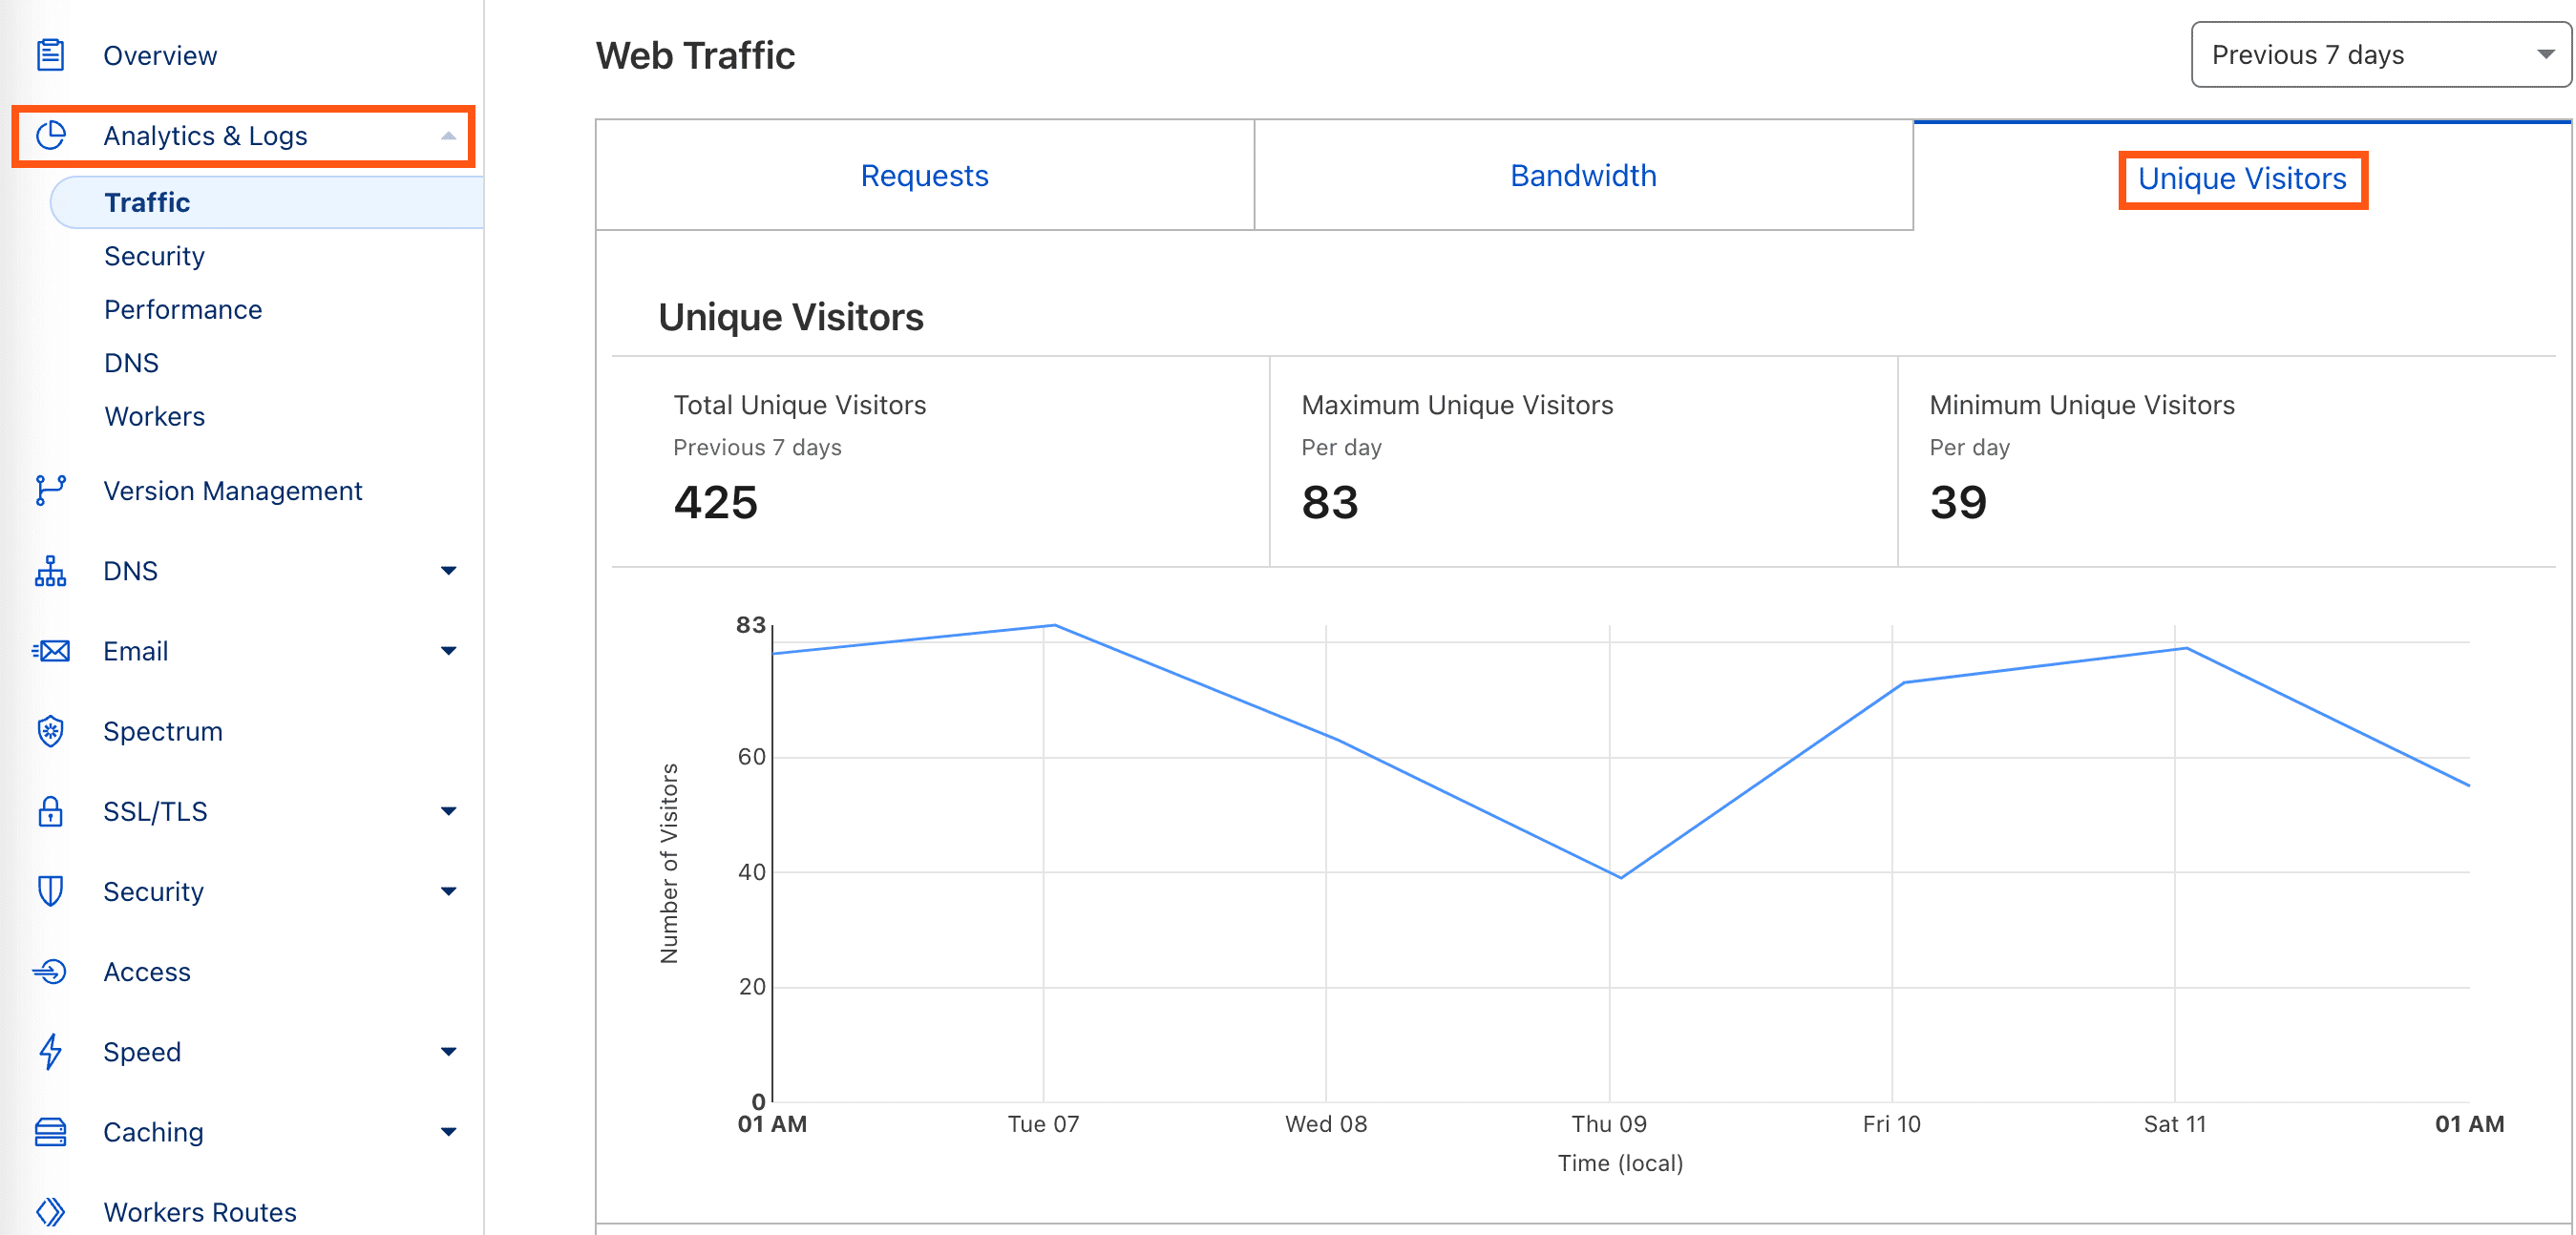
To properly compare Cloudflare’s visitors to Kinsta, you can either add up the daily visitors individually or pick a single day, let that be the average, and multiply it. Let’s use the screenshot above as an example. When we total up the daily visitors (78 + 83 + 63 + 39 + 73 + 79 + 55) they actually add up to 470. This is how to get the total that will be closer to what you see in Kinsta. Our numbers aren’t higher than Cloudflare, but we do use a different calculation method.
Suggested reading: How to Set up Cloudflare APO for WordPress.
Server statistics
There are many other server statistics packages available on the market today, one of which may be installed on your current server. If you have access to statistics on your current server, you can probably locate information allowing you to estimate visits with a large degree of accuracy.
The key here is to understand how the server statistics package on your current server counts visits and how that compares to how Kinsta counts visits.
In this article, we’ve already explained how we count visits. You may also need to do a little research to understand how the statistics package on your current server counts visits. Once you’ve done that, you can use the statistics on your current server to create an informed estimate of what visits will look like on our platform.
AWStats is one such program that is included by many web hosts who use cPanel. If you have access to AWStats, their “visits” count is similar to our visits calculation and should provide a reasonable estimate of visits for the purposes of sizing a hosting plan.
To find this data, log in to cPanel, click Awstats from within the Metrics section, and look for the total in the “Number of visits” column.
Bots and discrepancies in analytics
When a bot visits your site, it may or may not be counted as a visit.
We do not count visits from most well-known “bot” user-agents and do our best to filter them out of our analytics data. If we identify something trying to brute force “wp-login.php,” we ban it from our infrastructure.
However, bots have also been known to spoof user agents, in which case they might appear legitimate in our access logs but don’t show up in Google Analytics or other tools that rely on JavaScript running in the visitor’s browser. Because of this, it is normal for there to be a discrepancy between the total visits we show and another tool, especially if that tool relies on JavaScript running in the browser.
Bot traffic requires server resources (RAM/CPU/bandwidth), as such, some bots might be included in your total visits count since our servers still have to serve those visitors. We exclude properly identified bot traffic as a courtesy, but ultimately, bot traffic takes just as much work for our servers as human traffic.
If you are struggling with a large discrepancy or excessive bot traffic, we recommend implementing a web application firewall (WAF) from a reputable security solution provider such as Cloudflare or Sucuri. These services have extensive databases of what should be treated as “bad” traffic and traffic from these “bad” IP addresses is prevented from ever hitting your Kinsta site. Many of our clients see much less of a discrepancy between our analytics and what Google Analytics and other tools report after utilizing one of these services. This can, in turn, save you money by limiting the size of the hosting plan needed for your site.
Our Kinsta support team can also add additional IP or User-Agent banning rules. For example, if you need to deny a specific User-Agent or IP address, share that information with our support team, who will add a rule blocking that traffic source from your site. Due to how our infrastructure works, this should be done at the server-level and not with a WordPress plugin. Please open up a ticket if you need assistance.
Spikes in visitor count
A spike in visitors to your site could be legitimate, but to better understand the cause, consider checking the following:
- Total visitor count: The visitor count includes all sites in your Kinsta plan. If you’ve recently added a new site, this may contribute to the increase.
- Marketing and promotions: Have you recently run a sales campaign, promotional event, or other marketing activities that could be driving traffic?
- Social media mentions: A viral post, influencer mention, or trending discussion about your site on platforms like Twitter, Reddit, or Facebook can drive sudden spikes in traffic.
- Backlinks from high-traffic sites: If a popular website, blog, or news outlet has recently linked to your content, it could result in a significant visitor increase.
- Suspicious activity: Review the Top client IPs list for any unusual patterns. If you notice suspicious activity, you can block problematic IPs with the IP deny tool in MyKinsta. You can also set up your own Cloudflare account to enable and configure Cloudflare’s Web Application Firewall for more advanced filtering.
- New integrations: Have you added a tool or service that pulls data from your site, such as a news application, API, or scraper? This could contribute to increased traffic.
- Hotlinking: If other websites are directly linking to files or images served by your CDN, it can increase your visitor count. This occurs because each request to access those files is counted as a visit, even if the traffic isn’t coming directly to your site. If you have your own Cloudflare account, you can enable Hotlink Protection to prevent your images from being used by other sites.
- Bot traffic: If you suspect bot activity, you can set up your own Cloudflare account to enable Bot Fight Mode to differentiate between real users and bots. While this feature can provide valuable insight into whether most visits are from bots or genuine users, it may also block legitimate bots and API integrations while active. Be sure to review its impact and adjust settings as needed.
By reviewing these factors, you can determine whether the traffic spike is organic or requires further action. If you still can’t determine the source of the spike, contact our Support team to assist you with the investigation.
Summary
In conclusion, every analytics program or package generates analytics using its own data set and calculation methodology. At Kinsta, our count of visits is based on the raw access logs, which track the IP addresses that request resources from your websites and exclude known bots.
Because every program uses its own data and methodology, we cannot guarantee a perfect match between our analytics and those generated by another program. However, if you have access to another analytics program that uses server access logs to count up unique user IP addresses (such as Cloudflare or AWStats), that information can be used to estimate how many visits your sites will receive when hosted at Kinsta.